ワクチン販売市場レポート:2023-2033
Vaccine Sales Market Report 2023-2033
レポート詳細
ワクチン販売市場レポート 2023-2033 :本レポートは、新たな収益の柱を目指す大手企業にとって、業界とその根底にある力学をより深く理解する上で貴重なものとなろう。異業種への進出や... もっと見る
※上記価格は部署ライセンス(Departmental licence)価格です。
その他の価格についてはデータリソースまでお問合せください。
日本語のページは自動翻訳を利用し作成しています。
実際のレポートは英文のみでご納品いたします。

|

|
サマリー
レポート詳細
ワクチン販売市場レポート 2023-2033:本レポートは、新たな収益の柱を目指す大手企業にとって、業界とその根底にある力学をより深く理解する上で貴重なものとなろう。異業種への進出や、新たな地域での既存事業の拡大を希望する企業にとっても有用であろう。
ワクチン開発への投資が業界の成長を促進する
ワクチン研究に対する注目の高まりは、微生物病原学と免疫学の領域における著しい進歩に起因している。このような進歩により、研究者や開発者は予防ワクチンや治療ワクチンを考案しやすくなり、また以前は実現不可能とされていた新規疾患をターゲットとすることができるようになりました。科学的進歩とは別に、現在の世界的なワクチン市場の拡大や、多額の販売収入をもたらす「ブロックバスター」の地位を獲得する可能性が、ワクチン製造業者に研究活動の活性化や拡大への意欲を与えている。これは、商業的成功を達成すると同時に、公衆衛生への影響を強化することを目的としている。
市場調査レポートを購入する前にすべき質問とは?
- ワクチン販売市場はどのように進化しているのか?
- ワクチン販売市場の推進要因と阻害要因は何か?
- 各ワクチン販売サブ市場セグメントは予測期間中にどのように成長し、2033年にはどれくらいの売上を占めるようになるのか?
- 2023年から2033年にかけて、各ワクチン販売サブマーケットの市場シェアはどのように推移するのか?
- 2023年から2033年にかけての市場全体の主な牽引役は何か?
- 主要なワクチン販売市場はマクロ経済の動きに概ね追随するのか、それとも個々の国内市場が他を凌駕するのか?
- 2033年までに各国市場のシェアはどのように変化し、2033年にはどの地域が市場をリードするのか?
- 主要プレイヤーは誰で、予測期間中の見通しは?
- 主要企業のワクチン販売計画は?
- 2023年から2033年の間に、業界はどのように進化するのか?現在および今後実施される
現在および今後10年間のワクチン販売プロジェクトにはどのような意味があるのでしょうか?
- ワクチン販売市場をさらに拡大するために、製品化の必要性は高まっていますか?
- ワクチン販売市場はどこへ向かい、どのようにすれば市場の最前線に立てるのか?
- 新製品やサービスラインへの最適な投資オプションは何か?
- 企業を新たな成長軌道に乗せ、C-suiteに移行させるための重要な展望とは?
このことが現在、そして今後10年間のワクチン販売市場にどのような影響を与えるかを見極める必要がある:
- 364ページにわたる本レポートでは、140の表と199の図表を掲載しています。
- 本レポートは、業界の主要な儲かる分野をハイライトしており、今すぐターゲットを絞ることができます。
- 世界、地域、国の売上と成長に関する詳細な分析が含まれています。
- 競合他社が成功した主なトレンド、変化、収益予測をハイライトしています。
本レポートは、ワクチン販売市場が今後10年間でどのように発展するか、またCOVID-19の景気後退と好転の変動に合わせてどのように発展するかをお伝えします。この市場は、過去10年間のどの時点よりも今が重要である。
2033年までの予測やその他の分析から、商業的な展望が明らかになる
- 2033年までの収益予測に加え、直近の業績、成長率、市場シェアもご覧いただけます。
- ビジネスの展望と展開に関する独自の分析をご覧いただけます。
- 定性的分析(市場ダイナミクス、促進要因、機会、阻害要因など)、ポーターのファイブフォース分析、PEST分析、最近の動向をご覧いただけます。
本レポートには、COVID-19が業界と貴社にどのような影響を与えるかについてのデータ分析と貴重な洞察が含まれている。本レポートでは、COVID-19の4つの回復パターンとその影響、すなわち「V」、「L」、「W」、「U」について論じている。
レポート対象セグメント
タイプ
- 不活性化
- 弱毒化
- トキソイド
- リコンビナント/コンジュゲート/サブユニット
用途
- 肺炎球菌
- インフルエンザ
- 肝炎
- 髄膜炎菌
- COVID-19
- その他
投与経路
- 筋肉内
- 皮下
- 経口
販売チャネル
- 病院・小売薬局
- 政府系サプライヤー
- その他
年齢層
- 小児
- 成人
世界市場全体と各分野の収益予測に加え、5つの地域と22の主要国市場の収益予測も掲載している:
北米
- アメリカ
- カナダ
欧州
- ドイツ
- 英国
- フランス
- イタリア
- スペイン
- ロシア
- その他の欧州
アジア太平洋
- 日本
- 中国
- インド
- オーストラリア
- 韓国
- 東南アジア
- その他のアジア太平洋地域
ラテンアメリカ
- ブラジル
- メキシコ
- その他のラテンアメリカ
MEA
- GCC
- 南アフリカ
- その他のMEA
本レポートでは、2023年から2033年にかけてのワクチン販売市場における主要企業のプロファイルも掲載している。
主要企業と市場成長の可能性
・ AstraZeneca
・ Bavarian Nordic
・ Bharat Biotech
・ CSL
・ Daiichi Sankyo, Inc.
・ Emergent BioSolutions Inc.
・ GSK plc
・ INOVIO Pharmaceuticals
・ Johnson & Johnson Services, Inc.
・ Merck & Co., Inc.
・ Mitsubishi Tanabe Pharma Corporation
・ Moderna, Inc.
・ Novavax
・ Panacea Biotec
・ Pfizer Inc.
・ Sanofi
・ Serum Institute of India Pvt. Ltd.
・ Sinopharm
・ SINOVAC
・ Takeda Pharmaceutical Company Limited
2023年から2033年までの世界のワクチン販売市場全体の売上高(金額ベース)は、2023年に1,200億米ドルを突破する。2033年まで力強い収益成長を予測。当社の調査では、最も大きな可能性を秘めた企業を特定。彼らの能力、進歩、商業的展望を発見し、あなたが一歩先を行くのを支援します。
ワクチン販売市場、2023-2033年レポートはどのように役立つのか?
要約すると、360ページを超えるレポートでは、以下のような知識を得ることができる:
- ワクチン販売市場の2023年から2033年までの収益予測 世界および地域レベルで、種類、用途、投与経路、流通チャネル、年齢層別に予測 - 業界の将来性を発見し、投資と収益に最も有利な場所を見つけることができます。
- 5つの地域と22の主要国市場の2033年までの収益予測 - 北米、欧州、アジア太平洋、ラテンアメリカ、MEAのワクチン販売市場の2023年から2033年までの予測をご覧ください。また、米国、カナダ、メキシコ、ブラジル、ドイツ、フランス、英国、イタリア、中国、インド、日本、オーストラリアなどの主要経済圏の市場も予測しています。
既存企業および市場参入を目指す企業の展望 - ワクチン販売市場に関わる主要企業20社の企業プロファイルを含む、2023年から2033年までの展望。
独自の予測による定量的・定性的分析をご覧ください。私たちのレポートだけに含まれる情報を入手し、貴重なビジネスインテリジェンスで情報を得ることができます。
他にはない情報
私たちの新しいレポートがあれば、知識に遅れをとったり、チャンスを逃したりする可能性が低くなります。弊社の調査レポートが貴社の調査、分析、意思決定にどのように役立つかをご覧ください。Visiongainの調査は、ワクチン販売市場、2023年から2033年、市場をリードする企業の商業分析を必要とするすべての人のためのものです。データ、トレンド、予測をご覧いただけます。
ページTOPに戻る
目次
目次
1 レポート概要
1.1 研究の目的
1.2 ワクチン販売市場の紹介
1.3 本レポートの内容
1.4 本レポートを読むべき理由
1.5 本分析レポートが回答する主な質問は以下の通り:
1.6 本レポートの対象者
1.7 方法論
1.7.1 市場の定義
1.7.2 市場評価・予測手法
1.7.3 データの検証
1.7.3.1 一次調査
1.7.3.2 セカンダリーリサーチ
1.8 よくある質問(FAQ)
1.9 Visiongainの関連レポート
1.10 Visiongainについて
2 エグゼクティブ・サマリー
3 市場概要
3.1 主要な調査結果
3.2 市場ダイナミクス
3.2.1 市場促進要因
3.2.1.1 予防接種プログラムへの注目と政府支援の高まり
3.2.1.2 ワクチン開発への投資の増加
3.2.1.3 ワクチン研究開発強化に向けた企業の取り組み増加
3.2.1.4 感染症罹患率の高さ
3.2.1.5 ワクチン投与技術の進歩
3.2.1.6 急速な予防接種ニーズ
3.2.1.7 堅実なR&Dに支えられた旺盛な供給が市場を牽引
3.2.2 市場抑制要因
3.2.2.1 保険償還の不十分さ
3.2.2.2 ワクチン開発コストの高さ
3.2.2.3 ワクチン製造の長いタイムラインがワクチン市場の成長を妨げる
3.2.2.4 政府の厳しい承認規制
3.2.2.5 ワクチンへの不十分なアクセス
3.2.2.6 製品回収
3.2.3 市場機会
3.2.3.1 新興市場における高い成長見通し
3.2.3.2 治療用ワクチンへの注目
3.2.3.3 ワクチンにおけるアジュバントの使用
3.2.3.4 将来のワクチン研究開発に対する政府の支援
3.3 COVID-19インパクト分析
3.4 ポーターのファイブフォース分析
3.4.1 サプライヤーの交渉力
3.4.2 買い手の交渉力
3.4.3 競争相手のライバル関係
3.4.4 新規参入の脅威
3.4.5 代替品の脅威
3.5 PEST分析
4 ワクチン販売市場分析:タイプ別
4.1 主要な調査結果
4.2 タイプ別セグメント 市場魅力度指数
4.3 タイプ別ワクチン販売市場規模の推定と予測
4.4 不活化ワクチン
4.4.1 2023〜2033年の地域別市場予測(US$ Bn, AGR %)
4.4.2 地域別市場シェア、2023年・2033年 (%)
4.5 ライブアッテネート
4.5.1 地域別市場予測、2023~2033年(US$ Bn, AGR %)
4.5.2 地域別市場シェア、2023年・2033年 (%)
4.6 トキソイド
4.6.1 2023~2033年の地域別市場予測(US$ Bn, AGR %)
4.6.2 地域別市場シェア、2023年・2033年 (%)
4.7 リコンビナント/コンジュゲート/サブユニット
4.7.1 2023〜2033年の地域別市場予測(US$ Bn, AGR %)
4.7.2 地域別市場シェア、2023年・2033年 (%)
5 ワクチン販売市場分析:用途別
5.1 主要な調査結果
5.2 用途別セグメント 市場魅力度指数
5.3 用途別ワクチン販売市場規模の推定と予測
5.4 肺炎球菌
5.4.1 2023〜2033年の地域別市場予測(US$ Bn, AGR %)
5.4.2 地域別市場シェア、2023年・2033年 (%)
5.5 インフルエンザ
5.5.1 2023〜2033年の地域別市場予測(US$ Bn, AGR %)
5.5.2 地域別市場シェア、2023年・2033年 (%)
5.6 肝炎
5.6.1 2023〜2033年の地域別市場予測(US$ Bn, AGR %)
5.6.2 地域別市場シェア、2023年・2033年 (%)
5.7 髄膜炎菌
5.7.1 2023~2033年の地域別市場予測(US$ Bn, AGR %)
5.7.2 地域別市場シェア、2023年・2033年 (%)
5.8 COVID-19
5.8.1 2023~2033年の地域別市場予測 (US$Bn、AGR %)
5.8.2 地域別市場シェア、2023年・2033年 (%)
5.9 その他
5.9.1 2023年~2033年の地域別市場予測(US$ Bn, AGR %)
5.9.2 地域別市場シェア、2023年・2033年 (%)
6 ワクチン販売市場分析:投与経路別
6.1 主要調査結果
6.2 投与経路セグメント 市場魅力度指数
6.3 投与経路別ワクチン販売市場規模推定と予測
6.4 筋肉内投与
6.4.1 2023〜2033年の地域別市場予測(US$ Bn, AGR %)
6.4.2 地域別市場シェア、2023年・2033年 (%)
6.5 皮下
6.5.1 2023〜2033年の地域別市場予測(US$ Bn, AGR %)
6.5.2 地域別市場シェア、2023年・2033年 (%)
6.6 経口
6.6.1 2023~2033年の地域別市場予測(US$ Bn, AGR %)
6.6.2 地域別市場シェア、2023年・2033年 (%)
7 ワクチン販売市場分析:流通チャネル別
7.1 主要な調査結果
7.2 流通チャネルセグメント市場魅力度指数
7.3 流通チャネル別ワクチン販売市場規模の推定と予測
7.4 病院&小売薬局
7.4.1 2023~2033年の地域別市場予測(US$ Bn, AGR %)
7.4.2 地域別市場シェア、2023年・2033年 (%)
7.5 政府系サプライヤー
7.5.1 2023~2033年の地域別市場展望(US$ Bn, AGR %)
7.5.2 地域別市場シェア、2023年~2033年(%)
7.6 その他
7.6.1 2023〜2033年の地域別市場展望(US$ Bn, AGR %)
7.6.2 地域別市場シェア、2023〜2033年 (%)
8 ワクチン販売市場分析:年齢層別
8.1 主要調査結果
8.2 年齢層別セグメント 市場魅力度指数
8.3 年齢層別ワクチン販売市場規模の推定と予測
8.4 小児
8.4.1 2023〜2033年の地域別市場予測(US$ Bn, AGR %)
8.4.2 地域別市場シェア、2023〜2033年 (%)
8.5 大人
8.5.1 2023〜2033年の地域別市場予測(US$ Bn, AGR %)
8.5.2 地域別市場シェア、2023〜2033年 (%)
9 ワクチン販売市場分析:地域別
9.1 主要な調査結果
9.2 地域別市場規模の推定と予測
10 北米のワクチン販売市場分析
10.1 主要な調査結果
10.2 北米ワクチン販売市場魅力度指数
10.3 2023年、2028年、2033年の国別市場規模(US$ Bn)
10.4 2023〜2033年の国別市場規模推定と予測(US$ Bn)
10.5 タイプ別市場規模推定と予測、2023〜2033年(US$ Bn)
10.6 用途別市場規模推定と予測、2023-2033年(US$ Bn)
10.7 投与経路別市場規模推定と予測、2023-2033年(US$ Bn)
10.8 流通チャネル別市場規模推定と予測、2023-2033年(US$ Bn)
10.9 年齢層別市場規模推定と予測、2023~2033年(US$ Bn)
10.10 米国ワクチン販売市場分析
10.11 カナダのワクチン販売市場分析
11 欧州のワクチン販売市場分析
11.1 主要な調査結果
11.2 欧州ワクチン販売市場魅力度指数
11.3 2023年、2028年、2033年の国別市場規模(US$ Bn)
11.4 2023〜2033年の国別市場規模推定と予測(US$ Bn)
11.5 タイプ別市場規模推定と予測、2023〜2033年(US$ Bn)
11.6 用途別市場規模推定と予測、2023-2033年(US$ Bn)
11.7 投与経路別市場規模推定と予測、2023-2033年(US$ Bn)
11.8 流通チャネル別市場規模推定と予測、2023-2033年(US$ Bn)
11.9 年齢層別市場規模推定と予測、2023-2033年(US$ Bn)
11.10 ドイツのワクチン販売市場分析
11.11 イギリスのワクチン売上市場分析
11.12 フランスのワクチン売上市場分析
11.13 イタリアのワクチン売上市場分析
11.14 スペインのワクチン売上市場分析
11.15 ロシアのワクチン売上市場分析
11.16 その他の欧州のワクチン売上市場分析
12 アジア太平洋地域のワクチン販売市場分析
12.1 主要な調査結果
12.2 アジア太平洋地域のワクチン販売市場魅力度指数
12.3 2023年、2028年、2033年の国別市場規模(US$ Bn)
12.4 2023〜2033年の国別市場規模推定と予測(US$ Bn)
12.5 タイプ別市場規模推定と予測、2023〜2033年(US$ Bn)
12.6 用途別市場規模推定と予測、2023-2033年(US$ Bn)
12.7 投与経路別市場規模推定と予測、2023-2033年(US$ Bn)
12.8 流通チャネル別の市場規模推定と予測、2023-2033年(US$ Bn)
12.9 年齢層別市場規模推定と予測、2023-2033年(US$ Bn)
12.10 日本のワクチン販売市場分析
12.11 中国のワクチン販売市場分析
12.12 インドのワクチン売上市場分析
12.13 オーストラリアのワクチン売上高市場分析
12.14 韓国のワクチン売上市場分析
12.15 東南アジアのワクチン売上市場分析
12.16 その他のアジア太平洋地域のワクチン売上市場分析
13 ラテンアメリカのワクチン販売市場分析
13.1 主要な調査結果
13.2 ラテンアメリカのワクチン販売市場魅力度指数
13.3 2023年、2028年、2033年の国別市場規模(US$ Bn)
13.4 2023〜2033年の国別市場規模推定と予測(US$ Bn)
13.5 タイプ別市場規模推定と予測、2023〜2033年(US$ Bn)
13.6 用途別市場規模推定と予測、2023-2033年(US$ Bn)
13.7 投与経路別市場規模推定と予測、2023-2033年(US$ Bn)
13.8 流通チャネル別の市場規模推定と予測、2023-2033年(US$ Bn)
13.9 年齢層別市場規模推定と予測、2023-2033年(US$ Bn)
13.10 ブラジルのワクチン販売市場分析
13.11 メキシコのワクチン販売市場分析
13.12 その他のラテンアメリカのワクチン販売市場分析
14 MEAのnワクチン販売市場分析
14.1 主要な調査結果
14.2 MEAのワクチン販売市場魅力度指数
14.3 2023年、2028年、2033年の国別市場規模(Bnドル)
14.4 2023〜2033年の国別市場規模推定と予測(US$ Bn)
14.5 タイプ別市場規模推定と予測、2023〜2033年(US$ Bn)
14.6 用途別市場規模推定と予測、2023-2033年(US$ Bn)
14.7 投与経路別市場規模推定と予測、2023-2033年(US$ Bn)
14.8 流通チャネル別の市場規模推定と予測、2023-2033年(US$ Bn)
14.9 年齢層別市場規模推定と予測、2023~2033年(US$ Bn)
14.10 GCCのワクチン販売市場分析
14.11 南アフリカのワクチン売上市場分析
14.12 その他のMEAのワクチン売上市場分析
15 会社概要
15.1 Bavarian Nordic
15.1.1 会社概要
15.1.2 会社概要
15.1.3 財務分析
15.1.3.1 純収入、2015-2022年
15.1.3.2 売上高、2015-2022年
15.1.3.3 地域市場シェア、2022年
15.1.4 製品ベンチマーク
15.1.5 戦略的展望
15.2 Bharat Biotech
15.2.1 会社概要
15.2.2 会社概要
15.2.3 製品ベンチマーク
15.2.4 戦略的展望
15.3 CSL
15.3.1 会社概要
15.3.2 会社概要
15.3.3 財務分析
15.3.3.1 純収入、2015-2022年
15.3.3.2 R&D、2015-2022年
15.3.3.3 地域市場シェア、2022年
15.3.4 製品ベンチマーク
15.3.5 戦略的展望
15.4 Emergent BioSolutions Inc.
15.4.1 会社概要
15.4.2 会社概要
15.4.3 財務分析
15.4.3.1 純収入、2015-2022年
15.4.3.2 売上高、2015-2022年
15.4.4 製品ベンチマーク
15.4.5 戦略的展望
15.5 GSK plc
15.5.1 会社概要
15.5.2 会社概要
15.5.3 財務分析
15.5.3.1 純収入、2015-2022年
15.5.3.2 売上高、2015-2022年
15.5.3.3 地域市場シェア、2022年
15.5.4 製品ベンチマーク
15.5.5 戦略的展望
15.6 INOVIO Pharmaceuticals
15.6.1 会社概要
15.6.2 会社概要
15.6.3 財務分析
15.6.3.1 純収入、2015-2022年
15.6.3.2 売上高、2015-2022年
15.6.4 製品ベンチマーク
15.6.5 戦略的展望
15.7 Johnson & Johnson Services, Inc.
15.7.1 会社概要
15.7.2 会社概要
15.7.3 財務分析
15.7.3.1 純収入、2015-2022年
15.7.3.2 売上高、2015-2022年
15.7.3.3 地域市場シェア、2022年
15.7.4 製品ベンチマーク
15.7.5 戦略的展望
15.8 Merck Co., Inc.
15.8.1 会社概要
15.8.2 会社概要
15.8.3 財務分析
15.8.3.1 純収入、2015-2022年
15.8.3.2 売上高、2015-2022年
15.8.3.3 地域市場シェア、2022年
15.8.4 製品ベンチマーク
15.8.5 戦略的展望
15.9 Mitsubishi Tanabe Pharma Corporation
15.9.1 会社概要
15.9.2 会社概要
15.9.3 製品ベンチマーク
15.9.4 戦略的展望
15.10 Moderna, Inc.
15.10.1 会社概要
15.10.2 会社概要
15.10.3 財務分析
15.10.3.1 純収入、2015-2022年
15.10.3.2 売上高、2015-2022年
15.10.4 製品ベンチマーク
15.10.5 戦略的展望
15.11 Novavax
15.11.1 会社概要
15.11.2 会社概要
15.11.3 財務分析
15.11.3.1 純収入、2015-2022年
15.11.3.2 売上高、2015-2022年
15.11.3.3 地域市場シェア、2022年
15.11.4 製品ベンチマーク
15.11.5 戦略的展望
15.12 Panacea Biotec
15.12.1 会社概要
15.12.2 会社概要
15.12.3 製品ベンチマーク
15.13 Pfizer Inc.
15.13.1 会社概要
15.13.2 会社概要
15.13.3 財務分析
15.13.3.1 純収入、2015-2022年
15.13.3.2 売上高、2015-2022年
15.13.4 製品ベンチマーク
15.13.5 戦略的展望
15.14 Sanofi
15.14.1 会社概要
15.14.2 会社概要
15.14.3 財務分析
15.14.3.1 純収入、2015-2022年
15.14.3.2 R&D、2015-2022年
15.14.3.3 地域市場シェア、2022年
15.14.4 製品ベンチマーク
15.14.5 戦略的展望
15.15 Serum Institute of India Pvt.
15.15.1 会社概要
15.15.2 会社概要
15.15.3 製品ベンチマーク
15.15.4 戦略的展望
15.16 AstraZeneca
15.16.1 会社概要
15.16.2 会社概要
15.16.3 財務分析
15.16.3.1 純収入、2015-2022年
15.16.3.2 R&D、2015-2022年
15.16.3.3 地域市場シェア、2022年
15.16.4 製品ベンチマーク
15.16.5 戦略的展望
15.17 Sinopharm
15.17.1 会社概要
15.17.2 会社概要
15.17.3 製品ベンチマーク
15.18 SINOVAC
15.18.1 会社概要
15.18.2 会社概要
15.18.3 財務分析
15.18.3.1 純収入、2015-2022年
15.18.3.2 売上高、2015-2022年
15.18.4 製品ベンチマーク
15.18.5 戦略的展望
15.19 Takeda Pharmaceutical Company Limited
15.19.1 会社概要
15.19.2 会社概要
15.19.3 財務分析
15.19.3.1 純売上高、2015-2022年
15.19.3.2 売上高、2015-2022年
15.19.3.3 地域市場シェア、2022年
15.19.4 製品ベンチマーク
15.19.5 戦略的展望
15.20 Daiichi Sankyo, Inc.
15.20.1 会社概要
15.20.2 会社概要
15.20.3 財務分析
15.20.3.1 純収入、2015-2022年
15.20.3.2 売上高、2015-2022年
15.20.4 製品ベンチマーク
15.20.5 戦略的展望
16 結論と提言
16.1 Visiongainからの結びの言葉
16.2 市場プレイヤーへの提言
ページTOPに戻る
図表リスト
表の一覧
Table 1 Vaccine Sales Market Snapshot, 2023 & 2033 (US$ Billion, CAGR %)
Table 2 Vaccine Cost Comparison: CDC Cost vs. Private Sector Cost (US$)
Table 3 Vaccine Sales Market Forecast by Region, 2023-2033 (US$ Billion, AGR%, CAGR%): "V" Shaped Recovery
Table 4 Vaccine Sales Market Forecast by Region, 2023-2033 (US$ Billion, AGR%, CAGR%): "U" Shaped Recovery
Table 5 Vaccine Sales Market Forecast by Region, 2023-2033 (US$ Billion, AGR%, CAGR%): "W" Shaped Recovery
Table 6 Vaccine Sales Market Forecast by Region, 2023-2033 (US$ Billion, AGR%, CAGR%): "L" Shaped Recovery
Table 7 Vaccine Sales Market Forecast by Type, 2023-2033 (US$ Billion, AGR%, CAGR%)
Table 8 Inactivated Segment Market Forecast by Region, 2023-2033 (US$ Billion, AGR%, CAGR%)
Table 9 Live Attenuated Segment Market Forecast by Region, 2023-2033 (US$ Billion, AGR%, CAGR%)
Table 10 Toxoid Segment Market Forecast by Region, 2023-2033 (US$ Billion, AGR%, CAGR%)
Table 11 Recombinant/Conjugate/Subunit Segment Market Forecast by Region, 2023-2033 (US$ Billion, AGR%, CAGR%)
Table 12 Vaccine Sales Market Forecast by Application, 2023-2033 (US$ Billion, AGR%, CAGR%)
Table 13 Pneumococcal Segment Market Forecast by Region, 2023-2033 (US$ Billion, AGR%, CAGR%)
Table 14 Influenza Segment Market Forecast by Region, 2023-2033 (US$ Billion, AGR%, CAGR%)
Table 15 Hepatitis Segment Market Forecast by Region, 2023-2033 (US$ Billion, AGR%, CAGR%)
Table 16 Meningococcal Segment Market Forecast by Region, 2023-2033 (US$ Billion, AGR%, CAGR%)
Table 17 COVID-19 Segment Market Forecast by Region, 2023-2033 (US$ Billion, AGR%, CAGR%)
Table 18 Others Segment Market Forecast by Region, 2023-2033 (US$ Billion, AGR%, CAGR%)
Table 19 Vaccine Sales Market Forecast by Route of Administration, 2023-2033 (US$ Billion, AGR%, CAGR%)
Table 20 Intramuscular Segment Market Forecast by Region, 2023-2033 (US$ Billion, AGR%, CAGR%)
Table 21 Subcutaneous Segment Market Forecast by Region, 2023-2033 (US$ Billion, AGR%, CAGR%)
Table 22 Oral Segment Market Forecast by Region, 2023-2033 (US$ Billion, AGR%, CAGR%)
Table 23 Vaccine Sales Market Forecast by Distribution Channel, 2023-2033 (US$ Billion, AGR%, CAGR%)
Table 24 Hospital & Retail Pharmacies Segment Market Forecast by Region, 2023-2033 (US$ Billion, AGR%, CAGR%)
Table 25 Government Suppliers Segment Market Forecast by Region, 2023-2033 (US$ Billion, AGR%, CAGR%)
Table 26 Others Segment Market Forecast by Region, 2023-2033 (US$ Billion, AGR%, CAGR%)
Table 27 Vaccine Sales Market Forecast by Age Group, 2023-2033 (US$ Billion, AGR%, CAGR%)
Table 28 Paediatrics Segment Market Forecast by Region, 2023-2033 (US$ Billion, AGR%, CAGR%)
Table 29 Adults Segment Market Forecast by Region, 2023-2033 (US$ Billion, AGR%, CAGR%)
Table 30 Vaccine Sales Market Forecast by Region, 2023-2033 (US$ Billion, AGR%, CAGR%)
Table 31 North America Vaccine Sales Market Forecast by Country, 2023-2033 (US$ Billion, AGR%, CAGR%)
Table 32 North America Vaccine Sales Market Forecast by Type, 2023-2033 (US$ Billion, AGR%, CAGR%)
Table 33 North America Vaccine Sales Market Forecast by Application, 2023-2033 (US$ Billion, AGR%, CAGR%)
Table 34 North America Vaccine Sales Market Forecast by Route of Administration, 2023-2033 (US$ Billion, AGR%, CAGR%)
Table 35 North America Vaccine Sales Market Forecast by Distribution Channel, 2023-2033 (US$ Billion, AGR%, CAGR%)
Table 36 North America Vaccine Sales Market Forecast by Age Group, 2023-2033 (US$ Billion, AGR%, CAGR%)
Table 37 U.S. Vaccine Sales Market Forecast, 2023-2033 (US$ Bn, AGR%, CAGR%)
Table 38 Canada Vaccine Sales Market Forecast, 2023-2033 (US$ Bn, AGR%, CAGR%)
Table 39 Europe Vaccine Sales Market Forecast by Country, 2023-2033 (US$ Billion, AGR%, CAGR%)
Table 40 Europe Vaccine Sales Market Forecast by Type, 2023-2033 (US$ Billion, AGR%, CAGR%)
Table 41 Europe Vaccine Sales Market Forecast by Application, 2023-2033 (US$ Billion, AGR%, CAGR%)
Table 42 Europe Vaccine Sales Market Forecast by Route of Administration, 2023-2033 (US$ Billion, AGR%, CAGR%)
Table 43 Europe Vaccine Sales Market Forecast by Distribution Channel, 2023-2033 (US$ Billion, AGR%, CAGR%)
Table 44 Europe Vaccine Sales Market Forecast by Age Group, 2023-2033 (US$ Billion, AGR%, CAGR%)
Table 45 Germany Vaccine Sales Market Forecast, 2023-2033 (US$ Bn, AGR%, CAGR%)
Table 46 UK Vaccine Sales Market Forecast, 2023-2033 (US$ Bn, AGR%, CAGR%)
Table 47 France Vaccine Sales Market Forecast, 2023-2033 (US$ Bn, AGR%, CAGR%)
Table 48 Italy Vaccine Sales Market Forecast, 2023-2033 (US$ Bn, AGR%, CAGR%)
Table 49 Spain Vaccine Sales Market Forecast, 2023-2033 (US$ Bn, AGR%, CAGR%)
Table 50 Russia Vaccine Sales Market Forecast, 2023-2033 (US$ Bn, AGR%, CAGR%)
Table 51 Rest of Europe Vaccine Sales Market Forecast, 2023-2033 (US$ Bn, AGR%, CAGR%)
Table 52 Asia Pacific Vaccine Sales Market Forecast by Country, 2023-2033 (US$ Billion, AGR%, CAGR%)
Table 53 Asia Pacific Vaccine Sales Market Forecast by Type, 2023-2033 (US$ Billion, AGR%, CAGR%)
Table 54 Asia Pacific Vaccine Sales Market Forecast by Application, 2023-2033 (US$ Billion, AGR%, CAGR%)
Table 55 Asia Pacific Vaccine Sales Market Forecast by Route of Administration, 2023-2033 (US$ Billion, AGR%, CAGR%)
Table 56 Asia Pacific Vaccine Sales Market Forecast by Distribution Channel, 2023-2033 (US$ Billion, AGR%, CAGR%)
Table 57 Asia Pacific Vaccine Sales Market Forecast by Age Group, 2023-2033 (US$ Billion, AGR%, CAGR%)
Table 58 Japan Vaccine Sales Market Forecast, 2023-2033 (US$ Bn, AGR%, CAGR%)
Table 59 China Vaccine Sales Market Forecast, 2023-2033 (US$ Bn, AGR%, CAGR%)
Table 60 India Vaccine Sales Market Forecast, 2023-2033 (US$ Bn, AGR%, CAGR%)
Table 61 Australia Vaccine Sales Market Forecast, 2023-2033 (US$ Bn, AGR%, CAGR%)
Table 62 South Korea Vaccine Sales Market Forecast, 2023-2033 (US$ Bn, AGR%, CAGR%)
Table 63 South-East Asia Vaccine Sales Market Forecast, 2023-2033 (US$ Bn, AGR%, CAGR%)
Table 64 Rest of Asia Pacific Vaccine Sales Market Forecast, 2023-2033 (US$ Bn, AGR%, CAGR%)
Table 65 Latin America Vaccine Sales Market Forecast by Country, 2023-2033 (US$ Billion, AGR%, CAGR%)
Table 66 Latin America Vaccine Sales Market Forecast by Type, 2023-2033 (US$ Billion, AGR%, CAGR%)
Table 67 Latin America Vaccine Sales Market Forecast by Application, 2023-2033 (US$ Billion, AGR%, CAGR%)
Table 68 Latin America Vaccine Sales Market Forecast by Route of Administration, 2023-2033 (US$ Billion, AGR%, CAGR%)
Table 69 Latin America Vaccine Sales Market Forecast by Distribution Channel, 2023-2033 (US$ Billion, AGR%, CAGR%)
Table 70 Latin America Vaccine Sales Market Forecast by Age Group, 2023-2033 (US$ Billion, AGR%, CAGR%)
Table 71 Brazil Vaccine Sales Market Forecast, 2023-2033 (US$ Bn, AGR%, CAGR%)
Table 72 Mexico Vaccine Sales Market Forecast, 2023-2033 (US$ Bn, AGR%, CAGR%)
Table 73 Rest of Latin America Vaccine Sales Market Forecast, 2023-2033 (US$ Bn, AGR%, CAGR%)
Table 74 MEA Vaccine Sales Market Forecast by Country, 2023-2033 (US$ Billion, AGR%, CAGR%)
Table 75 MEA Vaccine Sales Market Forecast by Type, 2023-2033 (US$ Billion, AGR%, CAGR%)
Table 76 MEA Vaccine Sales Market Forecast by Application, 2023-2033 (US$ Billion, AGR%, CAGR%)
Table 77 MEA Vaccine Sales Market Forecast by Route of Administration, 2023-2033 (US$ Billion, AGR%, CAGR%)
Table 78 MEA Vaccine Sales Market Forecast by Distribution Channel, 2023-2033 (US$ Billion, AGR%, CAGR%)
Table 79 MEA Vaccine Sales Market Forecast by Age Group, 2023-2033 (US$ Billion, AGR%, CAGR%)
Table 80 GCC Vaccine Sales Market Forecast, 2023-2033 (US$ Bn, AGR%, CAGR%)
Table 81 South Africa Vaccine Sales Market Forecast, 2023-2033 (US$ Bn, AGR%, CAGR%)
Table 82 Rest of MEA Vaccine Sales Market Forecast, 2023-2033 (US$ Bn, AGR%, CAGR%)
Table 83 Bavarian Nordic: Key Details, (CEO, HQ, Revenue, Founded, No. of Employees, Company Type, Website, Business Segment)
Table 84 Bavarian Nordic: Product Benchmarking
Table 85 Bavarian Nordic: Strategic Outlook
Table 86 Bharat Biotech: Key Details, (CEO, HQ, Revenue, Founded, No. of Employees, Company Type, Website, Business Segment)
Table 87 Bharat Biotech: Product Benchmarking
Table 88 Bharat Biotech: Strategic Outlook
Table 89 CSL: Key Details, (CEO, HQ, Revenue, Founded, No. of Employees, Company Type, Website, Business Segment)
Table 90 CSL: Product Benchmarking
Table 91 CSL: Strategic Outlook
Table 92 Emergent BioSolutions Inc.: Key Details, (CEO, HQ, Revenue, Founded, No. of Employees, Company Type, Website, Business Segment)
Table 93 Emergent BioSolutions Inc.: Product Benchmarking
Table 94 Emergent BioSolutions Inc.: Strategic Outlook
Table 95 GSK plc: Key Details, (CEO, HQ, Revenue, Founded, No. of Employees, Company Type, Website, Business Segment)
Table 96 GSK plc: Product Benchmarking
Table 97 GSK plc: Strategic Outlook
Table 98 INOVIO Pharmaceuticals: Key Details, (CEO, HQ, Revenue, Founded, No. of Employees, Company Type, Website, Business Segment)
Table 99 INOVIO Pharmaceuticals: Product Benchmarking
Table 100 INOVIO Pharmaceuticals: Strategic Outlook
Table 101 Johnson & Johnson Services, Inc.: Key Details, (CEO, HQ, Revenue, Founded, No. of Employees, Company Type, Website, Business Segment)
Table 102 Johnson & Johnson Services, Inc.: Product Benchmarking
Table 103 Johnson & Johnson Services, Inc.: Strategic Outlook
Table 104 Merck Co., Inc.: Key Details, (CEO, HQ, Revenue, Founded, No. of Employees, Company Type, Website, Business Segment)
Table 105 Merck Co., Inc.: Product Benchmarking
Table 106 Merck Co., Inc.: Strategic Outlook
Table 107 Mitsubishi Tanabe Pharma Corporation: Key Details, (CEO, HQ, Revenue, Founded, No. of Employees, Company Type, Website, Business Segment)
Table 108 Mitsubishi Tanabe Pharma Corporation: Product Benchmarking
Table 109 Mitsubishi Tanabe Pharma Corporation: Strategic Outlook
Table 110 Moderna, Inc.: Key Details, (CEO, HQ, Revenue, Founded, No. of Employees, Company Type, Website, Business Segment)
Table 111 Moderna, Inc.: Product Benchmarking
Table 112 Moderna, Inc.: Strategic Outlook
Table 113 Novavax: Key Details, (CEO, HQ, Revenue, Founded, No. of Employees, Company Type, Website, Business Segment)
Table 114 Novavax: Product Benchmarking
Table 115 Novavax: Strategic Outlook
Table 116 Panacea Biotec.: Key Details, (CEO, HQ, Revenue, Founded, No. of Employees, Company Type, Website, Business Segment)
Table 117 Panacea Biotec: Product Benchmarking
Table 118 Pfizer Inc.: Key Details, (CEO, HQ, Revenue, Founded, No. of Employees, Company Type, Website, Business Segment)
Table 119 Pfizer Inc.: Product Benchmarking
Table 120 Pfizer Inc.: Strategic Outlook
Table 121 Sanofi: Key Details, (CEO, HQ, Revenue, Founded, No. of Employees, Company Type, Website, Business Segment)
Table 122 Sanofi: Product Benchmarking
Table 123 Sanofi: Strategic Outlook
Table 124 Serum Institute of India Pvt. Ltd.: Key Details, (CEO, HQ, Revenue, Founded, No. of Employees, Company Type, Website, Business Segment)
Table 125 Serum Institute of India Pvt. Ltd.: Product Benchmarking
Table 126 Serum Institute of India Pvt. Ltd.: Strategic Outlook
Table 127 AstraZeneca: Key Details, (CEO, HQ, Revenue, Founded, No. of Employees, Company Type, Website, Business Segment)
Table 128 AstraZeneca: Product Benchmarking
Table 129 AstraZeneca: Strategic Outlook
Table 130 Sinopharm: Key Details, (CEO, HQ, Revenue, Founded, No. of Employees, Company Type, Website, Business Segment)
Table 131 Sinopharm: Product Benchmarking
Table 132 SINOVAC: Key Details, (CEO, HQ, Revenue, Founded, No. of Employees, Company Type, Website, Business Segment)
Table 133 SINOVAC: Product Benchmarking
Table 134 SINOVAC: Strategic Outlook
Table 135 Takeda Pharmaceutical Company Limited: Key Details, (CEO, HQ, Revenue, Founded, No. of Employees, Company Type, Website, Business Segment)
Table 136 Takeda Pharmaceutical Company Limited: Product Benchmarking
Table 137 Takeda Pharmaceutical Company Limited: Strategic Outlook
Table 138 Daiichi Sankyo, Inc.: Key Details, (CEO, HQ, Revenue, Founded, No. of Employees, Company Type, Website, Business Segment)
Table 139 Daiichi Sankyo, Inc.: Product Benchmarking
Table 140 Daiichi Sankyo, Inc.: Strategic Outlook
図の一覧
Figure 1 Vaccine Sales Market Segmentation
Figure 2 Vaccine Sales Market by Type: Market Attractiveness Index
Figure 3 Vaccine Sales Market by Application: Market Attractiveness Index
Figure 4 Vaccine Sales Market by Route of Administration: Market Attractiveness Index
Figure 5 Vaccines market by distribution channel: Market Attractiveness Index
Figure 6 Vaccine Sales Market by Age Group: Market Attractiveness Index
Figure 7 Vaccine Sales Market Attractiveness Index by Region
Figure 8 Vaccine Sales Market: Market Dynamics
Figure 9 Vaccine Sales Market by Region, 2023-2033 (US$ Bn, AGR %): “V” Shaped Recovery
Figure 10 Vaccine Sales Market by Region, 2023-2033 (US$ Bn, AGR %): “U” Shaped Recovery
Figure 11 Vaccine Sales Market by Region, 2023-2033 (US$ Bn, AGR %): “W” Shaped Recovery
Figure 12 Vaccine Sales Market by Region, 2023-2033 (US$ Bn, AGR %): “L” Shaped Recovery
Figure 13 Vaccine Sales Market: Porter’s Five Forces Analysis
Figure 14 Vaccine Sales Market: PEST Analysis
Figure 15 Vaccine Sales Market Attractiveness Index by Type
Figure 16 Vaccine Sales Market Forecast by Type, 2023-2033 (US$ Billion, AGR %)
Figure 17 Vaccine Sales Market Share Forecast by Type, 2023, 2028, 2033 (%)
Figure 18 Inactivated Segment Market Forecast by Region, 2023-2033 (US$ Billion, AGR %)
Figure 19 Inactivated Segment Market Share Forecast by Region, 2023 & 2033 (%)
Figure 20 Live Attenuated Segment Market Forecast by Region, 2023-2033 (US$ Billion, AGR %)
Figure 21 Live Attenuated Segment Market Share Forecast by Region, 2023 & 2033 (%)
Figure 22 Toxoid Segment Market Forecast by Region, 2023-2033 (US$ Billion, AGR %)
Figure 23 Toxoid Segment Market Share Forecast by Region, 2023 & 2033 (%)
Figure 24 Recombinant/Conjugate/Subunit Segment Market Forecast by Region, 2023-2033 (US$ Billion, AGR %)
Figure 25 Recombinant/Conjugate/Subunit Segment Market Share Forecast by Region, 2023 & 2033 (%)
Figure 26 Vaccine Sales Market Attractiveness Index by Type
Figure 27 Vaccine Sales Market Forecast by Application, 2023-2033 (US$ Billion, AGR %)
Figure 28 Vaccine Sales Market Share Forecast by Application, 2023, 2028, 2033 (%)
Figure 29 Pneumococcal Segment Market Forecast by Region, 2023-2033 (US$ Billion, AGR %)
Figure 30 Pneumococcal Segment Market Share Forecast by Region, 2023 & 2033 (%)
Figure 31 Influenza Segment Market Forecast by Region, 2023-2033 (US$ Billion, AGR %)
Figure 32 Influenza Segment Market Share Forecast by Region, 2023 & 2033 (%)
Figure 33 Hepatitis Segment Market Forecast by Region, 2023-2033 (US$ Billion, AGR %)
Figure 34 Hepatitis Segment Market Share Forecast by Region, 2023 & 2033 (%)
Figure 35 Meningococcal Segment Market Forecast by Region, 2023-2033 (US$ Billion, AGR %)
Figure 36 Meningococcal Segment Market Share Forecast by Region, 2023 & 2033 (%)
Figure 37 COVID-19 Segment Market Forecast by Region, 2023-2033 (US$ Billion, AGR %)
Figure 38 COVID-19 Segment Market Share Forecast by Region, 2023 & 2033 (%)
Figure 39 Others Segment Market Forecast by Region, 2023-2033 (US$ Billion, AGR %)
Figure 40 Others Segment Market Share Forecast by Region, 2023 & 2033 (%)
Figure 41 Vaccine Sales Market Attractiveness Index by Route of Administration
Figure 42 Vaccine Sales Market Forecast by Route of Administration, 2023-2033 (US$ Billion, AGR %)
Figure 43 Vaccine Sales Market Share Forecast by Route of Administration, 2023, 2028, 2033 (%)
Figure 44 Intramuscular Segment Market Forecast by Region, 2023-2033 (US$ Billion, AGR %)
Figure 45 Intramuscular Segment Market Share Forecast by Region, 2023 & 2033 (%)
Figure 46 Subcutaneous Segment Market Forecast by Region, 2023-2033 (US$ Billion, AGR %)
Figure 47 Subcutaneous Segment Market Share Forecast by Region, 2023 & 2033 (%)
Figure 48 Oral Segment Market Forecast by Region, 2023-2033 (US$ Billion, AGR %)
Figure 49 Oral Segment Market Share Forecast by Region, 2023 & 2033 (%)
Figure 50 Vaccine Sales Market Attractiveness Index by Distribution Channel
Figure 51 Vaccine Sales Market Forecast by Distribution Channel, 2023-2033 (US$ Billion, AGR %)
Figure 52 Vaccine Sales Market Share Forecast by Distribution Channel, 2023, 2028, 2033 (%)
Figure 53 Hospital & Retail Pharmacies Segment Market Forecast by Region, 2023-2033 (US$ Billion, AGR %)
Figure 54 Hospital & Retail Pharmacies Segment Market Share Forecast by Region, 2023 & 2033 (%)
Figure 55 Government Suppliers Segment Market Forecast by Region, 2023-2033 (US$ Billion, AGR %)
Figure 56 Government Suppliers Segment Market Share Forecast by Region, 2023 & 2033 (%)
Figure 57 Others Segment Market Forecast by Region, 2023-2033 (US$ Billion, AGR %)
Figure 58 Others Segment Market Share Forecast by Region, 2023 & 2033 (%)
Figure 59 Vaccine Sales Market Attractiveness Index by Age Group
Figure 60 Vaccine Sales Market Forecast by Age Group, 2023-2033 (US$ Billion, AGR %)
Figure 61 Vaccine Sales Market Share Forecast by Age Group, 2023, 2028, 2033 (%)
Figure 62 Paediatrics Segment Market Forecast by Region, 2023-2033 (US$ Billion, AGR %)
Figure 63 Paediatrics Segment Market Share Forecast by Region, 2023 & 2033 (%)
Figure 64 Adults Segment Market Forecast by Region, 2023-2033 (US$ Billion, AGR %)
Figure 65 Adults Segment Market Share Forecast by Region, 2023 & 2033 (%)
Figure 66 Vaccine Sales Market Forecast by Region 2023 & 2033 (Revenue, CAGR%)
Figure 67 Vaccine Sales Market Share Forecast by Region 2023, 2028, 2033 (%)
Figure 68 Vaccine Sales Market by Region, 2023-2033 (US$ Bn)
Figure 69 North America Vaccine Sales Market Attractiveness Index
Figure 70 North America Vaccine Sales Market by Region, 2023, 2028 & 2033 (US$ Billion)
Figure 71 North America Vaccine Sales Market Forecast by Country, 2023-2033 (US$ Billion)
Figure 72 North America Vaccine Sales Market Share Forecast by Country, 2023 & 2033 (%)
Figure 73 North America Vaccine Sales Market Forecast by Type, 2023-2033 (US$ Billion, AGR %)
Figure 74 North America Vaccine Sales Market Share Forecast by Type, 2023 & 2033 (%)
Figure 75 North America Vaccine Sales Market Forecast by Application, 2023-2033 (US$ Billion, AGR %)
Figure 76 North America Vaccine Sales Market Share Forecast by Application, 2023 & 2033 (%)
Figure 77 North America Vaccine Sales Market Forecast by Route of Administration, 2023-2033 (US$ Billion, AGR %)
Figure 78 North America Vaccine Sales Market Share Forecast by Route of Administration, 2023 & 2033 (%)
Figure 79 North America Vaccine Sales Market Forecast by Distribution Channel, 2023-2033 (US$ Billion, AGR %)
Figure 80 North America Vaccine Sales Market Share Forecast by Distribution Channel, 2023 & 2033 (%)
Figure 81 North America Vaccine Sales Market Forecast by Age Group, 2023-2033 (US$ Billion, AGR %)
Figure 82 North America Vaccine Sales Market Share Forecast by Age Group, 2023 & 2033 (%)
Figure 83 U.S. Vaccine Sales Market Forecast, 2023-2033 (US$ Billion, AGR %)
Figure 84 Canada Vaccine Sales Market Forecast, 2023-2033 (US$ Billion, AGR %)
Figure 85 Europe Vaccine Sales Market Attractiveness Index
Figure 86 Europe Vaccine Sales Market by Region, 2023, 2028 & 2033 (US$ Billion)
Figure 87 Europe Vaccine Sales Market Forecast by Country, 2023-2033 (US$ Billion)
Figure 88 Europe Vaccine Sales Market Share Forecast by Country, 2023 & 2033 (%)
Figure 89 Europe Vaccine Sales Market Forecast by Type, 2023-2033 (US$ Billion, AGR %)
Figure 90 Europe Vaccine Sales Market Share Forecast by Type, 2023 & 2033 (%)
Figure 91 Europe Vaccine Sales Market Forecast by Application, 2023-2033 (US$ Billion, AGR %)
Figure 92 Europe Vaccine Sales Market Share Forecast by Application, 2023 & 2033 (%)
Figure 93 Europe Vaccine Sales Market Forecast by Route of Administration, 2023-2033 (US$ Billion, AGR %)
Figure 94 Europe Vaccine Sales Market Share Forecast by Route of Administration, 2023 & 2033 (%)
Figure 95 Europe Vaccine Sales Market Forecast by Distribution Channel, 2023-2033 (US$ Billion, AGR %)
Figure 96 Europe Vaccine Sales Market Share Forecast by Distribution Channel, 2023 & 2033 (%)
Figure 97 Europe Vaccine Sales Market Forecast by Age Group, 2023-2033 (US$ Billion, AGR %)
Figure 98 Europe Vaccine Sales Market Share Forecast by Age Group, 2023 & 2033 (%)
Figure 99 Germany Vaccine Sales Market Forecast, 2023-2033 (US$ Billion, AGR %)
Figure 100 UK Vaccine Sales Market Forecast, 2023-2033 (US$ Billion, AGR %)
Figure 101 France Vaccine Sales Market Forecast, 2023-2033 (US$ Billion, AGR %)
Figure 102 Italy Vaccine Sales Market Forecast, 2023-2033 (US$ Billion, AGR %)
Figure 103 Spain Vaccine Sales Market Forecast, 2023-2033 (US$ Billion, AGR %)
Figure 104 Russia Vaccine Sales Market Forecast, 2023-2033 (US$ Billion, AGR %)
Figure 105 Rest of Europe Vaccine Sales Market Forecast, 2023-2033 (US$ Billion, AGR %)
Figure 106 Asia Pacific Vaccine Sales Market Attractiveness Index
Figure 107 Asia Pacific Vaccine Sales Market by Region, 2023, 2028 & 2033 (US$ Billion)
Figure 108 Asia Pacific Vaccine Sales Market Forecast by Country, 2023-2033 (US$ Billion)
Figure 109 Asia Pacific Vaccine Sales Market Share Forecast by Country, 2023 & 2033 (%)
Figure 110 Asia Pacific Vaccine Sales Market Forecast by Type, 2023-2033 (US$ Billion, AGR %)
Figure 111 Asia Pacific Vaccine Sales Market Share Forecast by Type, 2023 & 2033 (%)
Figure 112 Asia Pacific Vaccine Sales Market Forecast by Application, 2023-2033 (US$ Billion, AGR %)
Figure 113 Asia Pacific Vaccine Sales Market Share Forecast by Application, 2023 & 2033 (%)
Figure 114 Asia Pacific Vaccine Sales Market Forecast by Route of Administration, 2023-2033 (US$ Billion, AGR %)
Figure 115 Asia Pacific Vaccine Sales Market Share Forecast by Route of Administration, 2023 & 2033 (%)
Figure 116 Asia Pacific Vaccine Sales Market Forecast by Distribution Channel, 2023-2033 (US$ Billion, AGR %)
Figure 117 Asia Pacific Vaccine Sales Market Share Forecast by Distribution Channel, 2023 & 2033 (%)
Figure 118 Asia Pacific Vaccine Sales Market Forecast by Age Group, 2023-2033 (US$ Billion, AGR %)
Figure 119 Asia Pacific Vaccine Sales Market Share Forecast by Age Group, 2023 & 2033 (%)
Figure 120 Japan Vaccine Sales Market Forecast, 2023-2033 (US$ Billion, AGR %)
Figure 121 China Vaccine Sales Market Forecast, 2023-2033 (US$ Billion, AGR %)
Figure 122 India Vaccine Sales Market Forecast, 2023-2033 (US$ Billion, AGR %)
Figure 123 Australia Vaccine Sales Market Forecast, 2023-2033 (US$ Billion, AGR %)
Figure 124 South Korea Vaccine Sales Market Forecast, 2023-2033 (US$ Billion, AGR %)
Figure 125 South-East Asia Vaccine Sales Market Forecast, 2023-2033 (US$ Billion, AGR %)
Figure 126 Rest of Asia Pacific Vaccine Sales Market Forecast, 2023-2033 (US$ Billion, AGR %)
Figure 127 Latin America Vaccine Sales Market Attractiveness Index
Figure 128 Latin America Vaccine Sales Market by Region, 2023, 2028 & 2033 (US$ Billion)
Figure 129 Latin America Vaccine Sales Market Forecast by Country, 2023-2033 (US$ Billion)
Figure 130 Latin America Vaccine Sales Market Share Forecast by Country, 2023 & 2033 (%)
Figure 131 Latin America Vaccine Sales Market Forecast by Type, 2023-2033 (US$ Billion, AGR %)
Figure 132 Latin America Vaccine Sales Market Share Forecast by Type, 2023 & 2033 (%)
Figure 133 Latin America Vaccine Sales Market Forecast by Application, 2023-2033 (US$ Billion, AGR %)
Figure 134 Latin America Vaccine Sales Market Share Forecast by Application, 2023 & 2033 (%)
Figure 135 Latin America Vaccine Sales Market Forecast by Route of Administration, 2023-2033 (US$ Billion, AGR %)
Figure 136 Latin America Vaccine Sales Market Share Forecast by Route of Administration, 2023 & 2033 (%)
Figure 137 Latin America Vaccine Sales Market Forecast by Distribution Channel, 2023-2033 (US$ Billion, AGR %)
Figure 138 Latin America Vaccine Sales Market Share Forecast by Distribution Channel, 2023 & 2033 (%)
Figure 139 Latin America Vaccine Sales Market Forecast by Age Group, 2023-2033 (US$ Billion, AGR %)
Figure 140 Latin America Vaccine Sales Market Share Forecast by Age Group, 2023 & 2033 (%)
Figure 141 Brazil Vaccine Sales Market Forecast, 2023-2033 (US$ Billion, AGR %)
Figure 142 Mexico Vaccine Sales Market Forecast, 2023-2033 (US$ Billion, AGR %)
Figure 143 Rest of Latin America Vaccine Sales Market Forecast, 2023-2033 (US$ Billion, AGR %)
Figure 144 MEA Vaccine Sales Market Attractiveness Index
Figure 145 MEA Vaccine Sales Market by Region, 2023, 2028 & 2033 (US$ Billion)
Figure 146 MEA Vaccine Sales Market Forecast by Country, 2023-2033 (US$ Billion)
Figure 147 MEA Vaccine Sales Market Share Forecast by Country, 2023 & 2033 (%)
Figure 148 MEA Vaccine Sales Market Forecast by Type, 2023-2033 (US$ Billion, AGR %)
Figure 149 MEA Vaccine Sales Market Share Forecast by Type, 2023 & 2033 (%)
Figure 150 MEA Vaccine Sales Market Forecast by Application, 2023-2033 (US$ Billion, AGR %)
Figure 151 MEA Vaccine Sales Market Share Forecast by Application, 2023 & 2033 (%)
Figure 152 MEA Vaccine Sales Market Forecast by Route of Administration, 2023-2033 (US$ Billion, AGR %)
Figure 153 MEA Vaccine Sales Market Share Forecast by Route of Administration, 2023 & 2033 (%)
Figure 154 MEA Vaccine Sales Market Forecast by Distribution Channel, 2023-2033 (US$ Billion, AGR %)
Figure 155 MEA Vaccine Sales Market Share Forecast by Distribution Channel, 2023 & 2033 (%)
Figure 156 MEA Vaccine Sales Market Forecast by Age Group, 2023-2033 (US$ Billion, AGR %)
Figure 157 MEA Vaccine Sales Market Share Forecast by Age Group, 2023 & 2033 (%)
Figure 158 GCC Vaccine Sales Market Forecast, 2023-2033 (US$ Billion, AGR %)
Figure 159 South Africa Vaccine Sales Market Forecast, 2023-2033 (US$ Billion, AGR %)
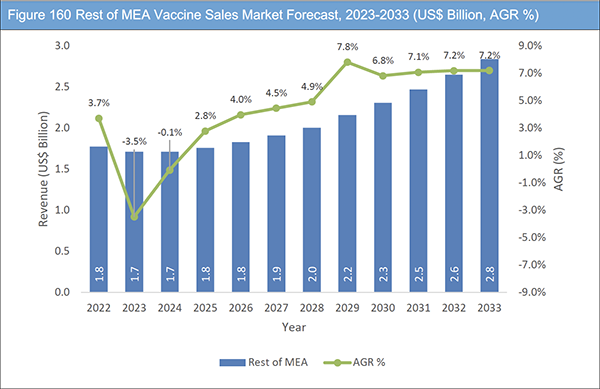
Figure 160 Rest of MEA Vaccine Sales Market Forecast, 2023-2033 (US$ Billion, AGR %)
Figure 161 Bavarian Nordic: Net Revenue, 2015-2022 (US$ Million, AGR %)
Figure 162 Bavarian Nordic: R&D, 2015-2022 (US$ Million, AGR %)
Figure 163 Bavarian Nordic: Regional Market Shares, 2022
Figure 164 CSL: Net Revenue, 2015-2022 (US$ Million, AGR %)
Figure 165 CSL: R&D, 2015-2022 (US$ Million, AGR %)
Figure 166 CSL: Regional Market Shares, 2022
Figure 167 Emergent BioSolutions Inc.: Net Revenue, 2015-2022 (US$ Million, AGR %)
Figure 168 Emergent BioSolutions Inc.: R&D, 2015-2022 (US$ Million, AGR %)
Figure 169 GSK plc: Net Revenue, 2015-2022 (US$ Million, AGR %)
Figure 170 GSK plc: R&D, 2015-2022 (US$ Million, AGR %)
Figure 171 GSK plc: Regional Market Shares, 2022
Figure 172 INOVIO Pharmaceuticals: Net Revenue, 2015-2022 (US$ Million, AGR %)
Figure 173 INOVIO Pharmaceuticals: R&D, 2015-2022 (US$ Million, AGR %)
Figure 174 Johnson & Johnson Services, Inc.: Net Revenue, 2015-2022 (US$ Million, AGR %)
Figure 175 Johnson & Johnson Services, Inc.: R&D, 2015-2022 (US$ Million, AGR %)
Figure 176 Johnson & Johnson Services, Inc.: Regional Market Shares, 2022
Figure 177 Merck Co., Inc.: Net Revenue, 2015-2022 (US$ Million, AGR %)
Figure 178 Merck Co., Inc.: R&D, 2015-2022 (US$ Million, AGR %)
Figure 179 Merck Co., Inc.: Regional Market Shares, 2022
Figure 180 Moderna, Inc.: Net Revenue, 2015-2022 (US$ Million, AGR %)
Figure 181 Moderna, Inc.: R&D, 2015-2022 (US$ Million, AGR %)
Figure 182 Novavax: Net Revenue, 2015-2022 (US$ Million, AGR %)
Figure 183 Novavax: R&D, 2015-2022 (US$ Million, AGR %)
Figure 184 Novavax: Regional Market Shares, 2022
Figure 185 Pfizer Inc.: Net Revenue, 2015-2022 (US$ Million, AGR %)
Figure 186 Pfizer Inc.: R&D, 2015-2022 (US$ Million, AGR %)
Figure 187 Sanofi: Net Revenue, 2015-2022 (US$ Million, AGR %)
Figure 188 Sanofi: R&D, 2015-2022 (US$ Million, AGR %)
Figure 189 Sanofi: Regional Market Shares, 2022
Figure 190 AstraZeneca: Net Revenue, 2015-2022 (US$ Million, AGR %)
Figure 191 AstraZeneca: R&D, 2015-2022 (US$ Million, AGR %)
Figure 192 AstraZeneca: Regional Market Shares, 2022
Figure 193 SINOVAC: Net Revenue, 2015-2022 (US$ Million, AGR %)
Figure 194 SINOVAC: R&D, 2015-2022 (US$ Million, AGR %)
Figure 195 Takeda Pharmaceutical Company Limited: Net Revenue, 2015-2022 (US$ Million, AGR %)
Figure 196 Takeda Pharmaceutical Company Limited: R&D, 2015-2022 (US$ Million, AGR %)
Figure 197 Takeda Pharmaceutical Company Limited: Regional Market Shares, 2022
Figure 198 Daiichi Sankyo, Inc.: Net Revenue, 2015-2022 (US$ Million, AGR %)
Figure 199 Daiichi Sankyo, Inc.: R&D, 2015-2022 (US$ Million, AGR %)
ページTOPに戻る
Summary
Report Details
The Vaccine Sales Market Report 2023-2033: This report will prove invaluable to leading firms striving for new revenue pockets if they wish to better understand the industry and its underlying dynamics. It will be useful for companies that would like to expand into different industries or to expand their existing operations in a new region.
Investment in the Development of Vaccines to Boost Industry Growth
The growing attention towards vaccine research is attributed to the significant advancements in the domains of microbial pathogenesis and immunology. These developments have facilitated researchers and developers in devising preventive and therapeutic vaccines, as well as targeting novel diseases that were previously deemed unfeasible. Apart from the scientific progress, the current expansion of the worldwide vaccine market and the potential to attain “blockbuster” status by generating substantial sales revenue have motivated vaccine producers to revitalise and/or broaden their research endeavours. This is aimed at enhancing the public health impact while also achieving commercial success.
What Questions Should You Ask before Buying a Market Research Report?
• How is the vaccine sales market evolving?
• What is driving and restraining the vaccine sales market?
• How will each vaccine sales submarket segment grow over the forecast period and how much revenue will these submarkets account for in 2033?
• How will the market shares for each vaccine sales submarket develop from 2023 to 2033?
• What will be the main driver for the overall market from 2023 to 2033?
• Will leading vaccine sales markets broadly follow the macroeconomic dynamics, or will individual national markets outperform others?
• How will the market shares of the national markets change by 2033 and which geographical region will lead the market in 2033?
• Who are the leading players and what are their prospects over the forecast period?
• What are the vaccine sales projects for these leading companies?
• How will the industry evolve during the period between 2023 and 2033? What are the implications of
vaccine sales projects taking place now and over the next 10 years?
• Is there a greater need for product commercialisation to further scale the vaccine sales market?
• Where is the vaccine sales market heading and how can you ensure you are at the forefront of the market?
• What are the best investment options for new product and service lines?
• What are the key prospects for moving companies into a new growth path and C-suite?
You need to discover how this will impact the vaccine sales market today, and over the next 10 years:
• Our 364-page report provides 140 tables and 199 charts/graphs exclusively to you.
• The report highlights key lucrative areas in the industry so you can target them – NOW.
• It contains in-depth analysis of global, regional and national sales and growth.
• It highlights for you the key successful trends, changes and revenue projections made by your competitors.
This report tells you TODAY how the vaccine sales market will develop in the next 10 years, and in line with the variations in COVID-19 economic recession and bounce. This market is more critical now than at any point over the last 10 years.
Forecasts to 2033 and other analyses reveal commercial prospects
• In addition to revenue forecasting to 2033, our new study provides you with recent results, growth rates, and market shares.
• You will find original analyses, with business outlooks and developments.
• Discover qualitative analyses (including market dynamics, drivers, opportunities, and restraints), Porter’s Five Forces Analysis, PEST Analysis and recent developments.
This report includes data analysis and invaluable insight into how COVID-19 will affect the industry and your company. Four COVID-19 recovery patterns and their impact, namely, “V”, “L”, “W” and “U” are discussed in this report.
Segments Covered in the Report
Type
• Inactivated
• Live Attenuated
• Toxoid
• Recombinant/Conjugate/Subunit
Application
• Pneumococcal
• Influenza
• Hepatitis
• Meningococcal
• COVID-19
• Others
Route of Administration
• Intramuscular
• Subcutaneous
• Oral
Distribution Channel
• Hospital & Retail Pharmacies
• Government Suppliers
• Others
Age Group
• Paediatrics
• Adults
In addition to the revenue predictions for the overall world market and segments, you will also find revenue forecasts for five regional and 22 leading national markets:
North America
• U.S.
• Canada
Europe
• Germany
• UK
• France
• Italy
• Spain
• Russia
• Rest of Europe
Asia Pacific
• Japan
• China
• India
• Australia
• South Korea
• South-East Asia
• Rest of Asia Pacific
Latin America
• Brazil
• Mexico
• Rest of Latin America
MEA
• GCC
• South Africa
• Rest of MEA
The report also includes profiles and for some of the leading companies in the Vaccine Sales Market, 2023 to 2033, with a focus on this segment of these companies’ operations.
Leading companies and the potential for market growth
• AstraZeneca
• Bavarian Nordic
• Bharat Biotech
• CSL
• Daiichi Sankyo, Inc.
• Emergent BioSolutions Inc.
• GSK plc
• INOVIO Pharmaceuticals
• Johnson & Johnson Services, Inc.
• Merck & Co., Inc.
• Mitsubishi Tanabe Pharma Corporation
• Moderna, Inc.
• Novavax
• Panacea Biotec
• Pfizer Inc.
• Sanofi
• Serum Institute of India Pvt. Ltd.
• Sinopharm
• SINOVAC
• Takeda Pharmaceutical Company Limited
Overall world revenue for Vaccine Sales Market, 2023 to 2033 in terms of value the market will surpass US$120 billion in 2023, our work calculates. We predict strong revenue growth through to 2033. Our work identifies which organizations hold the greatest potential. Discover their capabilities, progress, and commercial prospects, helping you stay ahead.
How will the Vaccine Sales Market, 2023 to 2033 report help you?
In summary, our 360+ page report provides you with the following knowledge:
• Revenue forecasts to 2033 for Vaccine Sales Market, 2023 to 2033 Market, with forecasts for type, application, route of administration, distribution channel, and age group, each forecast at a global and regional level – discover the industry’s prospects, finding the most lucrative places for investments and revenues.
• Revenue forecasts to 2033 for five regional and 22 key national markets – See forecasts for the Vaccine Sales Market, 2023 to 2033 market in North America, Europe, Asia-Pacific, Latin America, and MEA. Also forecasted is the market in the US, Canada, Mexico, Brazil, Germany, France, UK, Italy, China, India, Japan, and Australia among other prominent economies.
• Prospects for established firms and those seeking to enter the market – including company profiles for 20 of the major companies involved in the Vaccine Sales Market, 2023 to 2033.
Find quantitative and qualitative analyses with independent predictions. Receive information that only our report contains, staying informed with invaluable business intelligence.
Information found nowhere else
With our new report, you are less likely to fall behind in knowledge or miss out on opportunities. See how our work could benefit your research, analyses, and decisions. Visiongain’s study is for everybody needing commercial analyses for the Vaccine Sales Market, 2023 to 2033, market-leading companies. You will find data, trends and predictions.
ページTOPに戻る
Table of Contents
Table of Contents
1 Report Overview
1.1 Objectives of the Study
1.2 Introduction to Vaccine Sales Market
1.3 What This Report Delivers
1.4 Why You Should Read This Report
1.5 Key Questions Answered by This Analytical Report Include:
1.6 Who is This Report For?
1.7 Methodology
1.7.1 Market Definitions
1.7.2 Market Evaluation & Forecasting Methodology
1.7.3 Data Validation
1.7.3.1 Primary Research
1.7.3.2 Secondary Research
1.8 Frequently Asked Questions (FAQs)
1.9 Associated Visiongain Reports
1.10 About Visiongain
2 Executive Summary
3 Market Overview
3.1 Key Findings
3.2 Market Dynamics
3.2.1 Market Driving Factors
3.2.1.1 Rising Focus and Government Support on Immunization Programs
3.2.1.2 Growing Investment in Vaccine Development
3.2.1.3 Increasing Company Initiatives to Enhance Vaccine R&D
3.2.1.4 High Prevalence of Infectious Diseases
3.2.1.5 Technological Advancements in Vaccine Administration
3.2.1.6 Rapid Need of Immunization
3.2.1.7 Strong Supply Backed Up by Robust R&D to Drive the Market
3.2.2 Market Restraining Factors
3.2.2.1 Inadequate Reimbursement Coverage
3.2.2.2 High Cost of Vaccine Development
3.2.2.3 Long Timelines of Vaccine Manufacturing Hinder the Growth of the Vaccines Market
3.2.2.4 Stringent Government Regulations for Approval
3.2.2.5 Inadequate Access to Vaccines
3.2.2.6 Product Recalls
3.2.3 Market Opportunities
3.2.3.1 High Growth Prospects in Emerging Markets
3.2.3.2 Focus on Therapeutic Vaccines
3.2.3.3 Use of Adjuvants in Vaccines
3.2.3.4 Government Support for Future Vaccine R&D
3.3 COVID-19 Impact Analysis
3.4 Porter’s Five Forces Analysis
3.4.1 Bargaining Power of Supplier
3.4.2 Bargaining Power of Buyer
3.4.3 Competitive Rivalry
3.4.4 Threat of New Entrants
3.4.5 Threat of Substitutes
3.5 PEST Analysis
4 Vaccine Sales Market Analysis by Type
4.1 Key Findings
4.2 Type Segment: Market Attractiveness Index
4.3 Vaccine Sales Market Size Estimation and Forecast by Type
4.4 Inactivated
4.4.1 Market Forecast by Region, 2023-2033 (US$ Bn, AGR %)
4.4.2 Market Share by Region, 2023 & 2033 (%)
4.5 Live Attenuated
4.5.1 Market Forecast by Region, 2023-2033 (US$ Bn, AGR %)
4.5.2 Market Share by Region, 2023 & 2033 (%)
4.6 Toxoid
4.6.1 Market Forecast by Region, 2023-2033 (US$ Bn, AGR %)
4.6.2 Market Share by Region, 2023 & 2033 (%)
4.7 Recombinant/Conjugate/Subunit
4.7.1 Market Forecast by Region, 2023-2033 (US$ Bn, AGR %)
4.7.2 Market Share by Region, 2023 & 2033 (%)
5 Vaccine Sales Market Analysis by Application
5.1 Key Findings
5.2 Application Segment: Market Attractiveness Index
5.3 Vaccine Sales Market Size Estimation and Forecast by Application
5.4 Pneumococcal
5.4.1 Market Forecast by Region, 2023-2033 (US$ Bn, AGR %)
5.4.2 Market Share by Region, 2023 & 2033 (%)
5.5 Influenza
5.5.1 Market Forecast by Region, 2023-2033 (US$ Bn, AGR %)
5.5.2 Market Share by Region, 2023 & 2033 (%)
5.6 Hepatitis
5.6.1 Market Forecast by Region, 2023-2033 (US$ Bn, AGR %)
5.6.2 Market Share by Region, 2023 & 2033 (%)
5.7 Meningococcal
5.7.1 Market Forecast by Region, 2023-2033 (US$ Bn, AGR %)
5.7.2 Market Share by Region, 2023 & 2033 (%)
5.8 COVID-19
5.8.1 Market Forecast by Region, 2023-2033 (US$ Bn, AGR %)
5.8.2 Market Share by Region, 2023 & 2033 (%)
5.9 Others
5.9.1 Market Forecast by Region, 2023-2033 (US$ Bn, AGR %)
5.9.2 Market Share by Region, 2023 & 2033 (%)
6 Vaccine Sales Market Analysis by Route of Administration
6.1 Key Findings
6.2 Route of Administration Segment: Market Attractiveness Index
6.3 Vaccine Sales Market Size Estimation and Forecast by Route of Administration
6.4 Intramuscular
6.4.1 Market Forecast by Region, 2023-2033 (US$ Bn, AGR %)
6.4.2 Market Share by Region, 2023 & 2033 (%)
6.5 Subcutaneous
6.5.1 Market Forecast by Region, 2023-2033 (US$ Bn, AGR %)
6.5.2 Market Share by Region, 2023 & 2033 (%)
6.6 Oral
6.6.1 Market Forecast by Region, 2023-2033 (US$ Bn, AGR %)
6.6.2 Market Share by Region, 2023 & 2033 (%)
7 Vaccine Sales Market Analysis by Distribution Channel
7.1 Key Findings
7.2 Distribution Channel Segment: Market Attractiveness Index
7.3 Vaccine Sales Market Size Estimation and Forecast by Distribution Channel
7.4 Hospital & Retail Pharmacies
7.4.1 Market Forecast by Region, 2023-2033 (US$ Bn, AGR %)
7.4.2 Market Share by Region, 2023 & 2033 (%)
7.5 Government Suppliers
7.5.1 Market Forecast by Region, 2023-2033 (US$ Bn, AGR %)
7.5.2 Market Share by Region, 2023 & 2033 (%)
7.6 Others
7.6.1 Market Forecast by Region, 2023-2033 (US$ Bn, AGR %)
7.6.2 Market Share by Region, 2023 & 2033 (%)
8 Vaccine Sales Market Analysis by Age Group
8.1 Key Findings
8.2 Age Group Segment: Market Attractiveness Index
8.3 Vaccine Sales Market Size Estimation and Forecast by Age Group
8.4 Paediatrics
8.4.1 Market Forecast by Region, 2023-2033 (US$ Bn, AGR %)
8.4.2 Market Share by Region, 2023 & 2033 (%)
8.5 Adults
8.5.1 Market Forecast by Region, 2023-2033 (US$ Bn, AGR %)
8.5.2 Market Share by Region, 2023 & 2033 (%)
9 Vaccine Sales Market Analysis by Region
9.1 Key Findings
9.2 Regional Market Size Estimation and Forecast
10 North America Vaccine Sales Market Analysis
10.1 Key Findings
10.2 North America Vaccine Sales Market Attractiveness Index
10.3 Market Size by Country, 2023, 2028 & 2033 (US$ Bn)
10.4 Market Size Estimation and Forecast by Country, 2023-2033 (US$ Bn)
10.5 Market Size Estimation and Forecast by Type, 2023-2033 (US$ Bn)
10.6 Market Size Estimation and Forecast by Application, 2023-2033 (US$ Bn)
10.7 Market Size Estimation and Forecast by Route of Administration, 2023-2033 (US$ Bn)
10.8 Market Size Estimation and Forecast by Distribution Channel, 2023-2033 (US$ Bn)
10.9 Market Size Estimation and Forecast by Age Group, 2023-2033 (US$ Bn)
10.10 U.S. Vaccine Sales Market Analysis
10.11 Canada Vaccine Sales Market Analysis
11 Europe Vaccine Sales Market Analysis
11.1 Key Findings
11.2 Europe Vaccine Sales Market Attractiveness Index
11.3 Market Size by Country, 2023, 2028 & 2033 (US$ Bn)
11.4 Market Size Estimation and Forecast by Country, 2023-2033 (US$ Bn)
11.5 Market Size Estimation and Forecast by Type, 2023-2033 (US$ Bn)
11.6 Market Size Estimation and Forecast by Application, 2023-2033 (US$ Bn)
11.7 Market Size Estimation and Forecast by Route of Administration, 2023-2033 (US$ Bn)
11.8 Market Size Estimation and Forecast by Distribution Channel, 2023-2033 (US$ Bn)
11.9 Market Size Estimation and Forecast by Age Group, 2023-2033 (US$ Bn)
11.10 Germany Vaccine Sales Market Analysis
11.11 UK Vaccine Sales Market Analysis
11.12 France Vaccine Sales Market Analysis
11.13 Italy Vaccine Sales Market Analysis
11.14 Spain Vaccine Sales Market Analysis
11.15 Russia Vaccine Sales Market Analysis
11.16 Rest of Europe Vaccine Sales Market Analysis
12 Asia Pacific Vaccine Sales Market Analysis
12.1 Key Findings
12.2 Asia Pacific Vaccine Sales Market Attractiveness Index
12.3 Market Size by Country, 2023, 2028 & 2033 (US$ Bn)
12.4 Market Size Estimation and Forecast by Country, 2023-2033 (US$ Bn)
12.5 Market Size Estimation and Forecast by Type, 2023-2033 (US$ Bn)
12.6 Market Size Estimation and Forecast by Application, 2023-2033 (US$ Bn)
12.7 Market Size Estimation and Forecast by Route of Administration, 2023-2033 (US$ Bn)
12.8 Market Size Estimation and Forecast by Distribution Channel, 2023-2033 (US$ Bn)
12.9 Market Size Estimation and Forecast by Age Group, 2023-2033 (US$ Bn)
12.10 Japan Vaccine Sales Market Analysis
12.11 China Vaccine Sales Market Analysis
12.12 India Vaccine Sales Market Analysis
12.13 Australia Vaccine Sales Market Analysis
12.14 South Korea Vaccine Sales Market Analysis
12.15 South-East Asia Vaccine Sales Market Analysis
12.16 Rest of Asia Pacific Vaccine Sales Market Analysis
13 Latin America Vaccine Sales Market Analysis
13.1 Key Findings
13.2 Latin America Vaccine Sales Market Attractiveness Index
13.3 Market Size by Country, 2023, 2028 & 2033 (US$ Bn)
13.4 Market Size Estimation and Forecast by Country, 2023-2033 (US$ Bn)
13.5 Market Size Estimation and Forecast by Type, 2023-2033 (US$ Bn)
13.6 Market Size Estimation and Forecast by Application, 2023-2033 (US$ Bn)
13.7 Market Size Estimation and Forecast by Route of Administration, 2023-2033 (US$ Bn)
13.8 Market Size Estimation and Forecast by Distribution Channel, 2023-2033 (US$ Bn)
13.9 Market Size Estimation and Forecast by Age Group, 2023-2033 (US$ Bn)
13.10 Brazil Vaccine Sales Market Analysis
13.11 Mexico Vaccine Sales Market Analysis
13.12 Rest of Latin America Vaccine Sales Market Analysis
14 MEA Vaccine Sales Market Analysis
14.1 Key Findings
14.2 MEA Vaccine Sales Market Attractiveness Index
14.3 Market Size by Country, 2023, 2028 & 2033 (US$ Bn)
14.4 Market Size Estimation and Forecast by Country, 2023-2033 (US$ Bn)
14.5 Market Size Estimation and Forecast by Type, 2023-2033 (US$ Bn)
14.6 Market Size Estimation and Forecast by Application, 2023-2033 (US$ Bn)
14.7 Market Size Estimation and Forecast by Route of Administration, 2023-2033 (US$ Bn)
14.8 Market Size Estimation and Forecast by Distribution Channel, 2023-2033 (US$ Bn)
14.9 Market Size Estimation and Forecast by Age Group, 2023-2033 (US$ Bn)
14.10 GCC Vaccine Sales Market Analysis
14.11 South Africa Vaccine Sales Market Analysis
14.12 Rest of MEA Vaccine Sales Market Analysis
15 Company Profiles
15.1 Bavarian Nordic
15.1.1 Company Snapshot
15.1.2 Company Overview
15.1.3 Financial Analysis
15.1.3.1 Net Revenue, 2015-2022
15.1.3.2 R&D, 2015-2022
15.1.3.3 Regional Market Shares, 2022
15.1.4 Product Benchmarking
15.1.5 Strategic Outlook
15.2 Bharat Biotech
15.2.1 Company Snapshot
15.2.2 Company Overview
15.2.3 Product Benchmarking
15.2.4 Strategic Outlook
15.3 CSL
15.3.1 Company Snapshot
15.3.2 Company Overview
15.3.3 Financial Analysis
15.3.3.1 Net Revenue, 2015-2022
15.3.3.2 R&D, 2015-2022
15.3.3.3 Regional Market Shares, 2022
15.3.4 Product Benchmarking
15.3.5 Strategic Outlook
15.4 Emergent BioSolutions Inc.
15.4.1 Company Snapshot
15.4.2 Company Overview
15.4.3 Financial Analysis
15.4.3.1 Net Revenue, 2015-2022
15.4.3.2 R&D, 2015-2022
15.4.4 Product Benchmarking
15.4.5 Strategic Outlook
15.5 GSK plc
15.5.1 Company Snapshot
15.5.2 Company Overview
15.5.3 Financial Analysis
15.5.3.1 Net Revenue, 2015-2022
15.5.3.2 R&D, 2015-2022
15.5.3.3 Regional Market Shares, 2022
15.5.4 Product Benchmarking
15.5.5 Strategic Outlook
15.6 INOVIO Pharmaceuticals
15.6.1 Company Snapshot
15.6.2 Company Overview
15.6.3 Financial Analysis
15.6.3.1 Net Revenue, 2015-2022
15.6.3.2 R&D, 2015-2022
15.6.4 Product Benchmarking
15.6.5 Strategic Outlook
15.7 Johnson & Johnson Services, Inc.
15.7.1 Company Snapshot
15.7.2 Company Overview
15.7.3 Financial Analysis
15.7.3.1 Net Revenue, 2015-2022
15.7.3.2 R&D, 2015-2022
15.7.3.3 Regional Market Shares, 2022
15.7.4 Product Benchmarking
15.7.5 Strategic Outlook
15.8 Merck Co., Inc.
15.8.1 Company Snapshot
15.8.2 Company Overview
15.8.3 Financial Analysis
15.8.3.1 Net Revenue, 2015-2022
15.8.3.2 R&D, 2015-2022
15.8.3.3 Regional Market Shares, 2022
15.8.4 Product Benchmarking
15.8.5 Strategic Outlook
15.9 Mitsubishi Tanabe Pharma Corporation
15.9.1 Company Snapshot
15.9.2 Company Overview
15.9.3 Product Benchmarking
15.9.4 Strategic Outlook
15.10 Moderna, Inc.
15.10.1 Company Snapshot
15.10.2 Company Overview
15.10.3 Financial Analysis
15.10.3.1 Net Revenue, 2015-2022
15.10.3.2 R&D, 2015-2022
15.10.4 Product Benchmarking
15.10.5 Strategic Outlook
15.11 Novavax
15.11.1 Company Snapshot
15.11.2 Company Overview
15.11.3 Financial Analysis
15.11.3.1 Net Revenue, 2015-2022
15.11.3.2 R&D, 2015-2022
15.11.3.3 Regional Market Shares, 2022
15.11.4 Product Benchmarking
15.11.5 Strategic Outlook
15.12 Panacea Biotec
15.12.1 Company Snapshot
15.12.2 Company Overview
15.12.3 Product Benchmarking
15.13 Pfizer Inc.
15.13.1 Company Snapshot
15.13.2 Company Overview
15.13.3 Financial Analysis
15.13.3.1 Net Revenue, 2015-2022
15.13.3.2 R&D, 2015-2022
15.13.4 Product Benchmarking
15.13.5 Strategic Outlook
15.14 Sanofi
15.14.1 Company Snapshot
15.14.2 Company Overview
15.14.3 Financial Analysis
15.14.3.1 Net Revenue, 2015-2022
15.14.3.2 R&D, 2015-2022
15.14.3.3 Regional Market Shares, 2022
15.14.4 Product Benchmarking
15.14.5 Strategic Outlook
15.15 Serum Institute of India Pvt. Ltd.
15.15.1 Company Snapshot
15.15.2 Company Overview
15.15.3 Product Benchmarking
15.15.4 Strategic Outlook
15.16 AstraZeneca
15.16.1 Company Snapshot
15.16.2 Company Overview
15.16.3 Financial Analysis
15.16.3.1 Net Revenue, 2015-2022
15.16.3.2 R&D, 2015-2022
15.16.3.3 Regional Market Shares, 2022
15.16.4 Product Benchmarking
15.16.5 Strategic Outlook
15.17 Sinopharm
15.17.1 Company Snapshot
15.17.2 Company Overview
15.17.3 Product Benchmarking
15.18 SINOVAC
15.18.1 Company Snapshot
15.18.2 Company Overview
15.18.3 Financial Analysis
15.18.3.1 Net Revenue, 2015-2022
15.18.3.2 R&D, 2015-2022
15.18.4 Product Benchmarking
15.18.5 Strategic Outlook
15.19 Takeda Pharmaceutical Company Limited
15.19.1 Company Snapshot
15.19.2 Company Overview
15.19.3 Financial Analysis
15.19.3.1 Net Revenue, 2015-2022
15.19.3.2 R&D, 2015-2022
15.19.3.3 Regional Market Shares, 2022
15.19.4 Product Benchmarking
15.19.5 Strategic Outlook
15.20 Daiichi Sankyo, Inc.
15.20.1 Company Snapshot
15.20.2 Company Overview
15.20.3 Financial Analysis
15.20.3.1 Net Revenue, 2015-2022
15.20.3.2 R&D, 2015-2022
15.20.4 Product Benchmarking
15.20.5 Strategic Outlook
16 Conclusion and Recommendations
16.1 Concluding Remarks from Visiongain
16.2 Recommendations for Market Players
ページTOPに戻る
List of Tables/Graphs
List of Tables
Table 1 Vaccine Sales Market Snapshot, 2023 & 2033 (US$ Billion, CAGR %)
Table 2 Vaccine Cost Comparison: CDC Cost vs. Private Sector Cost (US$)
Table 3 Vaccine Sales Market Forecast by Region, 2023-2033 (US$ Billion, AGR%, CAGR%): "V" Shaped Recovery
Table 4 Vaccine Sales Market Forecast by Region, 2023-2033 (US$ Billion, AGR%, CAGR%): "U" Shaped Recovery
Table 5 Vaccine Sales Market Forecast by Region, 2023-2033 (US$ Billion, AGR%, CAGR%): "W" Shaped Recovery
Table 6 Vaccine Sales Market Forecast by Region, 2023-2033 (US$ Billion, AGR%, CAGR%): "L" Shaped Recovery
Table 7 Vaccine Sales Market Forecast by Type, 2023-2033 (US$ Billion, AGR%, CAGR%)
Table 8 Inactivated Segment Market Forecast by Region, 2023-2033 (US$ Billion, AGR%, CAGR%)
Table 9 Live Attenuated Segment Market Forecast by Region, 2023-2033 (US$ Billion, AGR%, CAGR%)
Table 10 Toxoid Segment Market Forecast by Region, 2023-2033 (US$ Billion, AGR%, CAGR%)
Table 11 Recombinant/Conjugate/Subunit Segment Market Forecast by Region, 2023-2033 (US$ Billion, AGR%, CAGR%)
Table 12 Vaccine Sales Market Forecast by Application, 2023-2033 (US$ Billion, AGR%, CAGR%)
Table 13 Pneumococcal Segment Market Forecast by Region, 2023-2033 (US$ Billion, AGR%, CAGR%)
Table 14 Influenza Segment Market Forecast by Region, 2023-2033 (US$ Billion, AGR%, CAGR%)
Table 15 Hepatitis Segment Market Forecast by Region, 2023-2033 (US$ Billion, AGR%, CAGR%)
Table 16 Meningococcal Segment Market Forecast by Region, 2023-2033 (US$ Billion, AGR%, CAGR%)
Table 17 COVID-19 Segment Market Forecast by Region, 2023-2033 (US$ Billion, AGR%, CAGR%)
Table 18 Others Segment Market Forecast by Region, 2023-2033 (US$ Billion, AGR%, CAGR%)
Table 19 Vaccine Sales Market Forecast by Route of Administration, 2023-2033 (US$ Billion, AGR%, CAGR%)
Table 20 Intramuscular Segment Market Forecast by Region, 2023-2033 (US$ Billion, AGR%, CAGR%)
Table 21 Subcutaneous Segment Market Forecast by Region, 2023-2033 (US$ Billion, AGR%, CAGR%)
Table 22 Oral Segment Market Forecast by Region, 2023-2033 (US$ Billion, AGR%, CAGR%)
Table 23 Vaccine Sales Market Forecast by Distribution Channel, 2023-2033 (US$ Billion, AGR%, CAGR%)
Table 24 Hospital & Retail Pharmacies Segment Market Forecast by Region, 2023-2033 (US$ Billion, AGR%, CAGR%)
Table 25 Government Suppliers Segment Market Forecast by Region, 2023-2033 (US$ Billion, AGR%, CAGR%)
Table 26 Others Segment Market Forecast by Region, 2023-2033 (US$ Billion, AGR%, CAGR%)
Table 27 Vaccine Sales Market Forecast by Age Group, 2023-2033 (US$ Billion, AGR%, CAGR%)
Table 28 Paediatrics Segment Market Forecast by Region, 2023-2033 (US$ Billion, AGR%, CAGR%)
Table 29 Adults Segment Market Forecast by Region, 2023-2033 (US$ Billion, AGR%, CAGR%)
Table 30 Vaccine Sales Market Forecast by Region, 2023-2033 (US$ Billion, AGR%, CAGR%)
Table 31 North America Vaccine Sales Market Forecast by Country, 2023-2033 (US$ Billion, AGR%, CAGR%)
Table 32 North America Vaccine Sales Market Forecast by Type, 2023-2033 (US$ Billion, AGR%, CAGR%)
Table 33 North America Vaccine Sales Market Forecast by Application, 2023-2033 (US$ Billion, AGR%, CAGR%)
Table 34 North America Vaccine Sales Market Forecast by Route of Administration, 2023-2033 (US$ Billion, AGR%, CAGR%)
Table 35 North America Vaccine Sales Market Forecast by Distribution Channel, 2023-2033 (US$ Billion, AGR%, CAGR%)
Table 36 North America Vaccine Sales Market Forecast by Age Group, 2023-2033 (US$ Billion, AGR%, CAGR%)
Table 37 U.S. Vaccine Sales Market Forecast, 2023-2033 (US$ Bn, AGR%, CAGR%)
Table 38 Canada Vaccine Sales Market Forecast, 2023-2033 (US$ Bn, AGR%, CAGR%)
Table 39 Europe Vaccine Sales Market Forecast by Country, 2023-2033 (US$ Billion, AGR%, CAGR%)
Table 40 Europe Vaccine Sales Market Forecast by Type, 2023-2033 (US$ Billion, AGR%, CAGR%)
Table 41 Europe Vaccine Sales Market Forecast by Application, 2023-2033 (US$ Billion, AGR%, CAGR%)
Table 42 Europe Vaccine Sales Market Forecast by Route of Administration, 2023-2033 (US$ Billion, AGR%, CAGR%)
Table 43 Europe Vaccine Sales Market Forecast by Distribution Channel, 2023-2033 (US$ Billion, AGR%, CAGR%)
Table 44 Europe Vaccine Sales Market Forecast by Age Group, 2023-2033 (US$ Billion, AGR%, CAGR%)
Table 45 Germany Vaccine Sales Market Forecast, 2023-2033 (US$ Bn, AGR%, CAGR%)
Table 46 UK Vaccine Sales Market Forecast, 2023-2033 (US$ Bn, AGR%, CAGR%)
Table 47 France Vaccine Sales Market Forecast, 2023-2033 (US$ Bn, AGR%, CAGR%)
Table 48 Italy Vaccine Sales Market Forecast, 2023-2033 (US$ Bn, AGR%, CAGR%)
Table 49 Spain Vaccine Sales Market Forecast, 2023-2033 (US$ Bn, AGR%, CAGR%)
Table 50 Russia Vaccine Sales Market Forecast, 2023-2033 (US$ Bn, AGR%, CAGR%)
Table 51 Rest of Europe Vaccine Sales Market Forecast, 2023-2033 (US$ Bn, AGR%, CAGR%)
Table 52 Asia Pacific Vaccine Sales Market Forecast by Country, 2023-2033 (US$ Billion, AGR%, CAGR%)
Table 53 Asia Pacific Vaccine Sales Market Forecast by Type, 2023-2033 (US$ Billion, AGR%, CAGR%)
Table 54 Asia Pacific Vaccine Sales Market Forecast by Application, 2023-2033 (US$ Billion, AGR%, CAGR%)
Table 55 Asia Pacific Vaccine Sales Market Forecast by Route of Administration, 2023-2033 (US$ Billion, AGR%, CAGR%)
Table 56 Asia Pacific Vaccine Sales Market Forecast by Distribution Channel, 2023-2033 (US$ Billion, AGR%, CAGR%)
Table 57 Asia Pacific Vaccine Sales Market Forecast by Age Group, 2023-2033 (US$ Billion, AGR%, CAGR%)
Table 58 Japan Vaccine Sales Market Forecast, 2023-2033 (US$ Bn, AGR%, CAGR%)
Table 59 China Vaccine Sales Market Forecast, 2023-2033 (US$ Bn, AGR%, CAGR%)
Table 60 India Vaccine Sales Market Forecast, 2023-2033 (US$ Bn, AGR%, CAGR%)
Table 61 Australia Vaccine Sales Market Forecast, 2023-2033 (US$ Bn, AGR%, CAGR%)
Table 62 South Korea Vaccine Sales Market Forecast, 2023-2033 (US$ Bn, AGR%, CAGR%)
Table 63 South-East Asia Vaccine Sales Market Forecast, 2023-2033 (US$ Bn, AGR%, CAGR%)
Table 64 Rest of Asia Pacific Vaccine Sales Market Forecast, 2023-2033 (US$ Bn, AGR%, CAGR%)
Table 65 Latin America Vaccine Sales Market Forecast by Country, 2023-2033 (US$ Billion, AGR%, CAGR%)
Table 66 Latin America Vaccine Sales Market Forecast by Type, 2023-2033 (US$ Billion, AGR%, CAGR%)
Table 67 Latin America Vaccine Sales Market Forecast by Application, 2023-2033 (US$ Billion, AGR%, CAGR%)
Table 68 Latin America Vaccine Sales Market Forecast by Route of Administration, 2023-2033 (US$ Billion, AGR%, CAGR%)
Table 69 Latin America Vaccine Sales Market Forecast by Distribution Channel, 2023-2033 (US$ Billion, AGR%, CAGR%)
Table 70 Latin America Vaccine Sales Market Forecast by Age Group, 2023-2033 (US$ Billion, AGR%, CAGR%)
Table 71 Brazil Vaccine Sales Market Forecast, 2023-2033 (US$ Bn, AGR%, CAGR%)
Table 72 Mexico Vaccine Sales Market Forecast, 2023-2033 (US$ Bn, AGR%, CAGR%)
Table 73 Rest of Latin America Vaccine Sales Market Forecast, 2023-2033 (US$ Bn, AGR%, CAGR%)
Table 74 MEA Vaccine Sales Market Forecast by Country, 2023-2033 (US$ Billion, AGR%, CAGR%)
Table 75 MEA Vaccine Sales Market Forecast by Type, 2023-2033 (US$ Billion, AGR%, CAGR%)
Table 76 MEA Vaccine Sales Market Forecast by Application, 2023-2033 (US$ Billion, AGR%, CAGR%)
Table 77 MEA Vaccine Sales Market Forecast by Route of Administration, 2023-2033 (US$ Billion, AGR%, CAGR%)
Table 78 MEA Vaccine Sales Market Forecast by Distribution Channel, 2023-2033 (US$ Billion, AGR%, CAGR%)
Table 79 MEA Vaccine Sales Market Forecast by Age Group, 2023-2033 (US$ Billion, AGR%, CAGR%)
Table 80 GCC Vaccine Sales Market Forecast, 2023-2033 (US$ Bn, AGR%, CAGR%)
Table 81 South Africa Vaccine Sales Market Forecast, 2023-2033 (US$ Bn, AGR%, CAGR%)
Table 82 Rest of MEA Vaccine Sales Market Forecast, 2023-2033 (US$ Bn, AGR%, CAGR%)
Table 83 Bavarian Nordic: Key Details, (CEO, HQ, Revenue, Founded, No. of Employees, Company Type, Website, Business Segment)
Table 84 Bavarian Nordic: Product Benchmarking
Table 85 Bavarian Nordic: Strategic Outlook
Table 86 Bharat Biotech: Key Details, (CEO, HQ, Revenue, Founded, No. of Employees, Company Type, Website, Business Segment)
Table 87 Bharat Biotech: Product Benchmarking
Table 88 Bharat Biotech: Strategic Outlook
Table 89 CSL: Key Details, (CEO, HQ, Revenue, Founded, No. of Employees, Company Type, Website, Business Segment)
Table 90 CSL: Product Benchmarking
Table 91 CSL: Strategic Outlook
Table 92 Emergent BioSolutions Inc.: Key Details, (CEO, HQ, Revenue, Founded, No. of Employees, Company Type, Website, Business Segment)
Table 93 Emergent BioSolutions Inc.: Product Benchmarking
Table 94 Emergent BioSolutions Inc.: Strategic Outlook
Table 95 GSK plc: Key Details, (CEO, HQ, Revenue, Founded, No. of Employees, Company Type, Website, Business Segment)
Table 96 GSK plc: Product Benchmarking
Table 97 GSK plc: Strategic Outlook
Table 98 INOVIO Pharmaceuticals: Key Details, (CEO, HQ, Revenue, Founded, No. of Employees, Company Type, Website, Business Segment)
Table 99 INOVIO Pharmaceuticals: Product Benchmarking
Table 100 INOVIO Pharmaceuticals: Strategic Outlook
Table 101 Johnson & Johnson Services, Inc.: Key Details, (CEO, HQ, Revenue, Founded, No. of Employees, Company Type, Website, Business Segment)
Table 102 Johnson & Johnson Services, Inc.: Product Benchmarking
Table 103 Johnson & Johnson Services, Inc.: Strategic Outlook
Table 104 Merck Co., Inc.: Key Details, (CEO, HQ, Revenue, Founded, No. of Employees, Company Type, Website, Business Segment)
Table 105 Merck Co., Inc.: Product Benchmarking
Table 106 Merck Co., Inc.: Strategic Outlook
Table 107 Mitsubishi Tanabe Pharma Corporation: Key Details, (CEO, HQ, Revenue, Founded, No. of Employees, Company Type, Website, Business Segment)
Table 108 Mitsubishi Tanabe Pharma Corporation: Product Benchmarking
Table 109 Mitsubishi Tanabe Pharma Corporation: Strategic Outlook
Table 110 Moderna, Inc.: Key Details, (CEO, HQ, Revenue, Founded, No. of Employees, Company Type, Website, Business Segment)
Table 111 Moderna, Inc.: Product Benchmarking
Table 112 Moderna, Inc.: Strategic Outlook
Table 113 Novavax: Key Details, (CEO, HQ, Revenue, Founded, No. of Employees, Company Type, Website, Business Segment)
Table 114 Novavax: Product Benchmarking
Table 115 Novavax: Strategic Outlook
Table 116 Panacea Biotec.: Key Details, (CEO, HQ, Revenue, Founded, No. of Employees, Company Type, Website, Business Segment)
Table 117 Panacea Biotec: Product Benchmarking
Table 118 Pfizer Inc.: Key Details, (CEO, HQ, Revenue, Founded, No. of Employees, Company Type, Website, Business Segment)
Table 119 Pfizer Inc.: Product Benchmarking
Table 120 Pfizer Inc.: Strategic Outlook
Table 121 Sanofi: Key Details, (CEO, HQ, Revenue, Founded, No. of Employees, Company Type, Website, Business Segment)
Table 122 Sanofi: Product Benchmarking
Table 123 Sanofi: Strategic Outlook
Table 124 Serum Institute of India Pvt. Ltd.: Key Details, (CEO, HQ, Revenue, Founded, No. of Employees, Company Type, Website, Business Segment)
Table 125 Serum Institute of India Pvt. Ltd.: Product Benchmarking
Table 126 Serum Institute of India Pvt. Ltd.: Strategic Outlook
Table 127 AstraZeneca: Key Details, (CEO, HQ, Revenue, Founded, No. of Employees, Company Type, Website, Business Segment)
Table 128 AstraZeneca: Product Benchmarking
Table 129 AstraZeneca: Strategic Outlook
Table 130 Sinopharm: Key Details, (CEO, HQ, Revenue, Founded, No. of Employees, Company Type, Website, Business Segment)
Table 131 Sinopharm: Product Benchmarking
Table 132 SINOVAC: Key Details, (CEO, HQ, Revenue, Founded, No. of Employees, Company Type, Website, Business Segment)
Table 133 SINOVAC: Product Benchmarking
Table 134 SINOVAC: Strategic Outlook
Table 135 Takeda Pharmaceutical Company Limited: Key Details, (CEO, HQ, Revenue, Founded, No. of Employees, Company Type, Website, Business Segment)
Table 136 Takeda Pharmaceutical Company Limited: Product Benchmarking
Table 137 Takeda Pharmaceutical Company Limited: Strategic Outlook
Table 138 Daiichi Sankyo, Inc.: Key Details, (CEO, HQ, Revenue, Founded, No. of Employees, Company Type, Website, Business Segment)
Table 139 Daiichi Sankyo, Inc.: Product Benchmarking
Table 140 Daiichi Sankyo, Inc.: Strategic Outlook
List of Figures
Figure 1 Vaccine Sales Market Segmentation
Figure 2 Vaccine Sales Market by Type: Market Attractiveness Index
Figure 3 Vaccine Sales Market by Application: Market Attractiveness Index
Figure 4 Vaccine Sales Market by Route of Administration: Market Attractiveness Index
Figure 5 Vaccines market by distribution channel: Market Attractiveness Index
Figure 6 Vaccine Sales Market by Age Group: Market Attractiveness Index
Figure 7 Vaccine Sales Market Attractiveness Index by Region
Figure 8 Vaccine Sales Market: Market Dynamics
Figure 9 Vaccine Sales Market by Region, 2023-2033 (US$ Bn, AGR %): “V” Shaped Recovery
Figure 10 Vaccine Sales Market by Region, 2023-2033 (US$ Bn, AGR %): “U” Shaped Recovery
Figure 11 Vaccine Sales Market by Region, 2023-2033 (US$ Bn, AGR %): “W” Shaped Recovery
Figure 12 Vaccine Sales Market by Region, 2023-2033 (US$ Bn, AGR %): “L” Shaped Recovery
Figure 13 Vaccine Sales Market: Porter’s Five Forces Analysis
Figure 14 Vaccine Sales Market: PEST Analysis
Figure 15 Vaccine Sales Market Attractiveness Index by Type
Figure 16 Vaccine Sales Market Forecast by Type, 2023-2033 (US$ Billion, AGR %)
Figure 17 Vaccine Sales Market Share Forecast by Type, 2023, 2028, 2033 (%)
Figure 18 Inactivated Segment Market Forecast by Region, 2023-2033 (US$ Billion, AGR %)
Figure 19 Inactivated Segment Market Share Forecast by Region, 2023 & 2033 (%)
Figure 20 Live Attenuated Segment Market Forecast by Region, 2023-2033 (US$ Billion, AGR %)
Figure 21 Live Attenuated Segment Market Share Forecast by Region, 2023 & 2033 (%)
Figure 22 Toxoid Segment Market Forecast by Region, 2023-2033 (US$ Billion, AGR %)
Figure 23 Toxoid Segment Market Share Forecast by Region, 2023 & 2033 (%)
Figure 24 Recombinant/Conjugate/Subunit Segment Market Forecast by Region, 2023-2033 (US$ Billion, AGR %)
Figure 25 Recombinant/Conjugate/Subunit Segment Market Share Forecast by Region, 2023 & 2033 (%)
Figure 26 Vaccine Sales Market Attractiveness Index by Type
Figure 27 Vaccine Sales Market Forecast by Application, 2023-2033 (US$ Billion, AGR %)
Figure 28 Vaccine Sales Market Share Forecast by Application, 2023, 2028, 2033 (%)
Figure 29 Pneumococcal Segment Market Forecast by Region, 2023-2033 (US$ Billion, AGR %)
Figure 30 Pneumococcal Segment Market Share Forecast by Region, 2023 & 2033 (%)
Figure 31 Influenza Segment Market Forecast by Region, 2023-2033 (US$ Billion, AGR %)
Figure 32 Influenza Segment Market Share Forecast by Region, 2023 & 2033 (%)
Figure 33 Hepatitis Segment Market Forecast by Region, 2023-2033 (US$ Billion, AGR %)
Figure 34 Hepatitis Segment Market Share Forecast by Region, 2023 & 2033 (%)
Figure 35 Meningococcal Segment Market Forecast by Region, 2023-2033 (US$ Billion, AGR %)
Figure 36 Meningococcal Segment Market Share Forecast by Region, 2023 & 2033 (%)
Figure 37 COVID-19 Segment Market Forecast by Region, 2023-2033 (US$ Billion, AGR %)
Figure 38 COVID-19 Segment Market Share Forecast by Region, 2023 & 2033 (%)
Figure 39 Others Segment Market Forecast by Region, 2023-2033 (US$ Billion, AGR %)
Figure 40 Others Segment Market Share Forecast by Region, 2023 & 2033 (%)
Figure 41 Vaccine Sales Market Attractiveness Index by Route of Administration
Figure 42 Vaccine Sales Market Forecast by Route of Administration, 2023-2033 (US$ Billion, AGR %)
Figure 43 Vaccine Sales Market Share Forecast by Route of Administration, 2023, 2028, 2033 (%)
Figure 44 Intramuscular Segment Market Forecast by Region, 2023-2033 (US$ Billion, AGR %)
Figure 45 Intramuscular Segment Market Share Forecast by Region, 2023 & 2033 (%)
Figure 46 Subcutaneous Segment Market Forecast by Region, 2023-2033 (US$ Billion, AGR %)
Figure 47 Subcutaneous Segment Market Share Forecast by Region, 2023 & 2033 (%)
Figure 48 Oral Segment Market Forecast by Region, 2023-2033 (US$ Billion, AGR %)
Figure 49 Oral Segment Market Share Forecast by Region, 2023 & 2033 (%)
Figure 50 Vaccine Sales Market Attractiveness Index by Distribution Channel
Figure 51 Vaccine Sales Market Forecast by Distribution Channel, 2023-2033 (US$ Billion, AGR %)
Figure 52 Vaccine Sales Market Share Forecast by Distribution Channel, 2023, 2028, 2033 (%)
Figure 53 Hospital & Retail Pharmacies Segment Market Forecast by Region, 2023-2033 (US$ Billion, AGR %)
Figure 54 Hospital & Retail Pharmacies Segment Market Share Forecast by Region, 2023 & 2033 (%)
Figure 55 Government Suppliers Segment Market Forecast by Region, 2023-2033 (US$ Billion, AGR %)
Figure 56 Government Suppliers Segment Market Share Forecast by Region, 2023 & 2033 (%)
Figure 57 Others Segment Market Forecast by Region, 2023-2033 (US$ Billion, AGR %)
Figure 58 Others Segment Market Share Forecast by Region, 2023 & 2033 (%)
Figure 59 Vaccine Sales Market Attractiveness Index by Age Group
Figure 60 Vaccine Sales Market Forecast by Age Group, 2023-2033 (US$ Billion, AGR %)
Figure 61 Vaccine Sales Market Share Forecast by Age Group, 2023, 2028, 2033 (%)
Figure 62 Paediatrics Segment Market Forecast by Region, 2023-2033 (US$ Billion, AGR %)
Figure 63 Paediatrics Segment Market Share Forecast by Region, 2023 & 2033 (%)
Figure 64 Adults Segment Market Forecast by Region, 2023-2033 (US$ Billion, AGR %)
Figure 65 Adults Segment Market Share Forecast by Region, 2023 & 2033 (%)
Figure 66 Vaccine Sales Market Forecast by Region 2023 & 2033 (Revenue, CAGR%)
Figure 67 Vaccine Sales Market Share Forecast by Region 2023, 2028, 2033 (%)
Figure 68 Vaccine Sales Market by Region, 2023-2033 (US$ Bn)
Figure 69 North America Vaccine Sales Market Attractiveness Index
Figure 70 North America Vaccine Sales Market by Region, 2023, 2028 & 2033 (US$ Billion)
Figure 71 North America Vaccine Sales Market Forecast by Country, 2023-2033 (US$ Billion)
Figure 72 North America Vaccine Sales Market Share Forecast by Country, 2023 & 2033 (%)
Figure 73 North America Vaccine Sales Market Forecast by Type, 2023-2033 (US$ Billion, AGR %)
Figure 74 North America Vaccine Sales Market Share Forecast by Type, 2023 & 2033 (%)
Figure 75 North America Vaccine Sales Market Forecast by Application, 2023-2033 (US$ Billion, AGR %)
Figure 76 North America Vaccine Sales Market Share Forecast by Application, 2023 & 2033 (%)
Figure 77 North America Vaccine Sales Market Forecast by Route of Administration, 2023-2033 (US$ Billion, AGR %)
Figure 78 North America Vaccine Sales Market Share Forecast by Route of Administration, 2023 & 2033 (%)
Figure 79 North America Vaccine Sales Market Forecast by Distribution Channel, 2023-2033 (US$ Billion, AGR %)
Figure 80 North America Vaccine Sales Market Share Forecast by Distribution Channel, 2023 & 2033 (%)
Figure 81 North America Vaccine Sales Market Forecast by Age Group, 2023-2033 (US$ Billion, AGR %)
Figure 82 North America Vaccine Sales Market Share Forecast by Age Group, 2023 & 2033 (%)
Figure 83 U.S. Vaccine Sales Market Forecast, 2023-2033 (US$ Billion, AGR %)
Figure 84 Canada Vaccine Sales Market Forecast, 2023-2033 (US$ Billion, AGR %)
Figure 85 Europe Vaccine Sales Market Attractiveness Index
Figure 86 Europe Vaccine Sales Market by Region, 2023, 2028 & 2033 (US$ Billion)
Figure 87 Europe Vaccine Sales Market Forecast by Country, 2023-2033 (US$ Billion)
Figure 88 Europe Vaccine Sales Market Share Forecast by Country, 2023 & 2033 (%)
Figure 89 Europe Vaccine Sales Market Forecast by Type, 2023-2033 (US$ Billion, AGR %)
Figure 90 Europe Vaccine Sales Market Share Forecast by Type, 2023 & 2033 (%)
Figure 91 Europe Vaccine Sales Market Forecast by Application, 2023-2033 (US$ Billion, AGR %)
Figure 92 Europe Vaccine Sales Market Share Forecast by Application, 2023 & 2033 (%)
Figure 93 Europe Vaccine Sales Market Forecast by Route of Administration, 2023-2033 (US$ Billion, AGR %)
Figure 94 Europe Vaccine Sales Market Share Forecast by Route of Administration, 2023 & 2033 (%)
Figure 95 Europe Vaccine Sales Market Forecast by Distribution Channel, 2023-2033 (US$ Billion, AGR %)
Figure 96 Europe Vaccine Sales Market Share Forecast by Distribution Channel, 2023 & 2033 (%)
Figure 97 Europe Vaccine Sales Market Forecast by Age Group, 2023-2033 (US$ Billion, AGR %)
Figure 98 Europe Vaccine Sales Market Share Forecast by Age Group, 2023 & 2033 (%)
Figure 99 Germany Vaccine Sales Market Forecast, 2023-2033 (US$ Billion, AGR %)
Figure 100 UK Vaccine Sales Market Forecast, 2023-2033 (US$ Billion, AGR %)
Figure 101 France Vaccine Sales Market Forecast, 2023-2033 (US$ Billion, AGR %)
Figure 102 Italy Vaccine Sales Market Forecast, 2023-2033 (US$ Billion, AGR %)
Figure 103 Spain Vaccine Sales Market Forecast, 2023-2033 (US$ Billion, AGR %)
Figure 104 Russia Vaccine Sales Market Forecast, 2023-2033 (US$ Billion, AGR %)
Figure 105 Rest of Europe Vaccine Sales Market Forecast, 2023-2033 (US$ Billion, AGR %)
Figure 106 Asia Pacific Vaccine Sales Market Attractiveness Index
Figure 107 Asia Pacific Vaccine Sales Market by Region, 2023, 2028 & 2033 (US$ Billion)
Figure 108 Asia Pacific Vaccine Sales Market Forecast by Country, 2023-2033 (US$ Billion)
Figure 109 Asia Pacific Vaccine Sales Market Share Forecast by Country, 2023 & 2033 (%)
Figure 110 Asia Pacific Vaccine Sales Market Forecast by Type, 2023-2033 (US$ Billion, AGR %)
Figure 111 Asia Pacific Vaccine Sales Market Share Forecast by Type, 2023 & 2033 (%)
Figure 112 Asia Pacific Vaccine Sales Market Forecast by Application, 2023-2033 (US$ Billion, AGR %)
Figure 113 Asia Pacific Vaccine Sales Market Share Forecast by Application, 2023 & 2033 (%)
Figure 114 Asia Pacific Vaccine Sales Market Forecast by Route of Administration, 2023-2033 (US$ Billion, AGR %)
Figure 115 Asia Pacific Vaccine Sales Market Share Forecast by Route of Administration, 2023 & 2033 (%)
Figure 116 Asia Pacific Vaccine Sales Market Forecast by Distribution Channel, 2023-2033 (US$ Billion, AGR %)
Figure 117 Asia Pacific Vaccine Sales Market Share Forecast by Distribution Channel, 2023 & 2033 (%)
Figure 118 Asia Pacific Vaccine Sales Market Forecast by Age Group, 2023-2033 (US$ Billion, AGR %)
Figure 119 Asia Pacific Vaccine Sales Market Share Forecast by Age Group, 2023 & 2033 (%)
Figure 120 Japan Vaccine Sales Market Forecast, 2023-2033 (US$ Billion, AGR %)
Figure 121 China Vaccine Sales Market Forecast, 2023-2033 (US$ Billion, AGR %)
Figure 122 India Vaccine Sales Market Forecast, 2023-2033 (US$ Billion, AGR %)
Figure 123 Australia Vaccine Sales Market Forecast, 2023-2033 (US$ Billion, AGR %)
Figure 124 South Korea Vaccine Sales Market Forecast, 2023-2033 (US$ Billion, AGR %)
Figure 125 South-East Asia Vaccine Sales Market Forecast, 2023-2033 (US$ Billion, AGR %)
Figure 126 Rest of Asia Pacific Vaccine Sales Market Forecast, 2023-2033 (US$ Billion, AGR %)
Figure 127 Latin America Vaccine Sales Market Attractiveness Index
Figure 128 Latin America Vaccine Sales Market by Region, 2023, 2028 & 2033 (US$ Billion)
Figure 129 Latin America Vaccine Sales Market Forecast by Country, 2023-2033 (US$ Billion)
Figure 130 Latin America Vaccine Sales Market Share Forecast by Country, 2023 & 2033 (%)
Figure 131 Latin America Vaccine Sales Market Forecast by Type, 2023-2033 (US$ Billion, AGR %)
Figure 132 Latin America Vaccine Sales Market Share Forecast by Type, 2023 & 2033 (%)
Figure 133 Latin America Vaccine Sales Market Forecast by Application, 2023-2033 (US$ Billion, AGR %)
Figure 134 Latin America Vaccine Sales Market Share Forecast by Application, 2023 & 2033 (%)
Figure 135 Latin America Vaccine Sales Market Forecast by Route of Administration, 2023-2033 (US$ Billion, AGR %)
Figure 136 Latin America Vaccine Sales Market Share Forecast by Route of Administration, 2023 & 2033 (%)
Figure 137 Latin America Vaccine Sales Market Forecast by Distribution Channel, 2023-2033 (US$ Billion, AGR %)
Figure 138 Latin America Vaccine Sales Market Share Forecast by Distribution Channel, 2023 & 2033 (%)
Figure 139 Latin America Vaccine Sales Market Forecast by Age Group, 2023-2033 (US$ Billion, AGR %)
Figure 140 Latin America Vaccine Sales Market Share Forecast by Age Group, 2023 & 2033 (%)
Figure 141 Brazil Vaccine Sales Market Forecast, 2023-2033 (US$ Billion, AGR %)
Figure 142 Mexico Vaccine Sales Market Forecast, 2023-2033 (US$ Billion, AGR %)
Figure 143 Rest of Latin America Vaccine Sales Market Forecast, 2023-2033 (US$ Billion, AGR %)
Figure 144 MEA Vaccine Sales Market Attractiveness Index
Figure 145 MEA Vaccine Sales Market by Region, 2023, 2028 & 2033 (US$ Billion)
Figure 146 MEA Vaccine Sales Market Forecast by Country, 2023-2033 (US$ Billion)
Figure 147 MEA Vaccine Sales Market Share Forecast by Country, 2023 & 2033 (%)
Figure 148 MEA Vaccine Sales Market Forecast by Type, 2023-2033 (US$ Billion, AGR %)
Figure 149 MEA Vaccine Sales Market Share Forecast by Type, 2023 & 2033 (%)
Figure 150 MEA Vaccine Sales Market Forecast by Application, 2023-2033 (US$ Billion, AGR %)
Figure 151 MEA Vaccine Sales Market Share Forecast by Application, 2023 & 2033 (%)
Figure 152 MEA Vaccine Sales Market Forecast by Route of Administration, 2023-2033 (US$ Billion, AGR %)
Figure 153 MEA Vaccine Sales Market Share Forecast by Route of Administration, 2023 & 2033 (%)
Figure 154 MEA Vaccine Sales Market Forecast by Distribution Channel, 2023-2033 (US$ Billion, AGR %)
Figure 155 MEA Vaccine Sales Market Share Forecast by Distribution Channel, 2023 & 2033 (%)
Figure 156 MEA Vaccine Sales Market Forecast by Age Group, 2023-2033 (US$ Billion, AGR %)
Figure 157 MEA Vaccine Sales Market Share Forecast by Age Group, 2023 & 2033 (%)
Figure 158 GCC Vaccine Sales Market Forecast, 2023-2033 (US$ Billion, AGR %)
Figure 159 South Africa Vaccine Sales Market Forecast, 2023-2033 (US$ Billion, AGR %)
Figure 160 Rest of MEA Vaccine Sales Market Forecast, 2023-2033 (US$ Billion, AGR %)
Figure 161 Bavarian Nordic: Net Revenue, 2015-2022 (US$ Million, AGR %)
Figure 162 Bavarian Nordic: R&D, 2015-2022 (US$ Million, AGR %)
Figure 163 Bavarian Nordic: Regional Market Shares, 2022
Figure 164 CSL: Net Revenue, 2015-2022 (US$ Million, AGR %)
Figure 165 CSL: R&D, 2015-2022 (US$ Million, AGR %)
Figure 166 CSL: Regional Market Shares, 2022
Figure 167 Emergent BioSolutions Inc.: Net Revenue, 2015-2022 (US$ Million, AGR %)
Figure 168 Emergent BioSolutions Inc.: R&D, 2015-2022 (US$ Million, AGR %)
Figure 169 GSK plc: Net Revenue, 2015-2022 (US$ Million, AGR %)
Figure 170 GSK plc: R&D, 2015-2022 (US$ Million, AGR %)
Figure 171 GSK plc: Regional Market Shares, 2022
Figure 172 INOVIO Pharmaceuticals: Net Revenue, 2015-2022 (US$ Million, AGR %)
Figure 173 INOVIO Pharmaceuticals: R&D, 2015-2022 (US$ Million, AGR %)
Figure 174 Johnson & Johnson Services, Inc.: Net Revenue, 2015-2022 (US$ Million, AGR %)
Figure 175 Johnson & Johnson Services, Inc.: R&D, 2015-2022 (US$ Million, AGR %)
Figure 176 Johnson & Johnson Services, Inc.: Regional Market Shares, 2022
Figure 177 Merck Co., Inc.: Net Revenue, 2015-2022 (US$ Million, AGR %)
Figure 178 Merck Co., Inc.: R&D, 2015-2022 (US$ Million, AGR %)
Figure 179 Merck Co., Inc.: Regional Market Shares, 2022
Figure 180 Moderna, Inc.: Net Revenue, 2015-2022 (US$ Million, AGR %)
Figure 181 Moderna, Inc.: R&D, 2015-2022 (US$ Million, AGR %)
Figure 182 Novavax: Net Revenue, 2015-2022 (US$ Million, AGR %)
Figure 183 Novavax: R&D, 2015-2022 (US$ Million, AGR %)
Figure 184 Novavax: Regional Market Shares, 2022
Figure 185 Pfizer Inc.: Net Revenue, 2015-2022 (US$ Million, AGR %)
Figure 186 Pfizer Inc.: R&D, 2015-2022 (US$ Million, AGR %)
Figure 187 Sanofi: Net Revenue, 2015-2022 (US$ Million, AGR %)
Figure 188 Sanofi: R&D, 2015-2022 (US$ Million, AGR %)
Figure 189 Sanofi: Regional Market Shares, 2022
Figure 190 AstraZeneca: Net Revenue, 2015-2022 (US$ Million, AGR %)
Figure 191 AstraZeneca: R&D, 2015-2022 (US$ Million, AGR %)
Figure 192 AstraZeneca: Regional Market Shares, 2022
Figure 193 SINOVAC: Net Revenue, 2015-2022 (US$ Million, AGR %)
Figure 194 SINOVAC: R&D, 2015-2022 (US$ Million, AGR %)
Figure 195 Takeda Pharmaceutical Company Limited: Net Revenue, 2015-2022 (US$ Million, AGR %)
Figure 196 Takeda Pharmaceutical Company Limited: R&D, 2015-2022 (US$ Million, AGR %)
Figure 197 Takeda Pharmaceutical Company Limited: Regional Market Shares, 2022
Figure 198 Daiichi Sankyo, Inc.: Net Revenue, 2015-2022 (US$ Million, AGR %)
Figure 199 Daiichi Sankyo, Inc.: R&D, 2015-2022 (US$ Million, AGR %)
ページTOPに戻る
よくあるご質問
Visiongain社はどのような調査会社ですか?
英国の調査会社ヴィジョンゲイン社(Visiongain)は、通信とエネルギーのほか、自動車や化学・医薬品、金属など、広範な市場を対象に調査を行っています。自動車市場については、市場全般に関する調査のほ... もっと見る
調査レポートの納品までの日数はどの程度ですか?
在庫のあるものは速納となりますが、平均的には 3-4日と見て下さい。
但し、一部の調査レポートでは、発注を受けた段階で内容更新をして納品をする場合もあります。
発注をする前のお問合せをお願いします。
注文の手続きはどのようになっていますか?
1)お客様からの御問い合わせをいただきます。
2)見積書やサンプルの提示をいたします。
3)お客様指定、もしくは弊社の発注書をメール添付にて発送してください。
4)データリソース社からレポート発行元の調査会社へ納品手配します。
5) 調査会社からお客様へ納品されます。最近は、pdfにてのメール納品が大半です。
お支払方法の方法はどのようになっていますか?
納品と同時にデータリソース社よりお客様へ請求書(必要に応じて納品書も)を発送いたします。
お客様よりデータリソース社へ(通常は円払い)の御振り込みをお願いします。
請求書は、納品日の日付で発行しますので、翌月最終営業日までの当社指定口座への振込みをお願いします。振込み手数料は御社負担にてお願いします。
お客様の御支払い条件が60日以上の場合は御相談ください。
尚、初めてのお取引先や個人の場合、前払いをお願いすることもあります。ご了承のほど、お願いします。
データリソース社はどのような会社ですか?
当社は、世界各国の主要調査会社・レポート出版社と提携し、世界各国の市場調査レポートや技術動向レポートなどを日本国内の企業・公官庁及び教育研究機関に提供しております。
世界各国の「市場・技術・法規制などの」実情を調査・収集される時には、データリソース社にご相談ください。
お客様の御要望にあったデータや情報を抽出する為のレポート紹介や調査のアドバイスも致します。
|
|


