シングルユースバイオプロセシング用プローブ&センサー市場レポート:2023-2033
Single-use Bioprocessing Probes & Sensors Market Report 2023-2033
レポート詳細
シングルユースバイオプロセシングプローブ&センサーの市場レポート 2023-2033 :本レポートは、新たな収益源の開拓を目指すリーディングカンパニーにとって、業界とその基礎となる力学... もっと見る
※上記価格は部署ライセンス(Departmental licence)価格です。
その他の価格についてはデータリソースまでお問合せください。
日本語のページは自動翻訳を利用し作成しています。
実際のレポートは英文のみでご納品いたします。
サマリー
レポート詳細
シングルユースバイオプロセシングプローブ&センサーの市場レポート 2023-2033:本レポートは、新たな収益源の開拓を目指すリーディングカンパニーにとって、業界とその基礎となる力学をより深く理解する上で、非常に貴重なものとなるでしょう。また、異業種への進出や新地域での既存事業の拡大を目指す企業にとっても有益なレポートです。
技術の進歩が業界の成長を促進すると予測される
人工知能(AI)とナノテクノロジーの進歩は、イノベーションを促進し、バイオプロセスの効率を向上させ、シングルユースバイオプロセシング用プローブ&センサー業界に大きな影響を与えています。AIは、プロセスの最適化と製品品質の向上においてメーカーを支援する、高度なデータ分析と機械学習アルゴリズムの開発に導入されています。例えば、センサーやデバイスからのデータをリアルタイムで分析し、プロセスのパフォーマンスに関する洞察を提供し、より迅速で正確な意思決定を可能にするために、AIを使用することができます。
さらに、ナノテクノロジーは、バイオプロセスで単一に使用する新しい材料を開発するために導入されています。例えば、ナノ材料は、シングルユース容器、バイオリアクター、その他のコンポーネントの機械的強度、柔軟性、耐久性を向上させるために利用することができます。これにより、製品の品質を向上させ、汚染の可能性を低減することができます。3Dプリンティング技術の開発は、テクノロジーがシングルユースバイオプロセシングの業界にどのような影響を及ぼしているかを示すもう一つの例である。特定の製造プロセスや用途に合わせたセンサーや機器などのカスタムコンポーネントの迅速なプロトタイピングと製造は、3Dプリンティングによって可能になります。これにより、プロセスの有効性を高め、コストを削減することができます。
マーケットリサーチレポートを購入する前に、どのような質問をするべきか?
- シングルユースバイオプロセシング用プローブ&センサー市場はどのように進化しているのか?
- シングルユースバイオプロセシング用プローブ&センサー市場を牽引し、抑制しているものは何か?
- シングルユースバイオプロセシング用プローブ&センサーの各サブマーケットセグメントは予測期間中にどのように成長し、これらのサブマーケットが2033年に占める売上はどの程度になるのか?
- シングルユースバイオプロセシング用プローブ&センサーの各サブマーケットの市場シェアは、2023年から2033年にかけてどのように推移するのでしょうか?
- 2023年から2033年にかけて、市場全体の主な牽引役となるのは何か?
- シングルユースバイオプロセシング用プローブ&センサーの主要市場はマクロ経済ダイナミクスに概ね追随するのか、それとも個々の国別市場が他を凌駕するのか?
- 2033年までに各国市場のシェアはどのように変化し、2033年に市場をリードするのはどの地域か?
- 主要プレイヤーは誰で、予測期間中の見通しはどうなっているのか?
- これらの主要企業のシングルユースバイオプロセシング用プローブ&センサーのプロジェクトはどのようなものか?
- 2023年から2033年の間に、業界はどのように進化していくのでしょうか?の意味するところは何でしょうか?
シングルユースバイオプロセシング用プローブ&センサーのプロジェクトは、現在および今後10年間にどのような影響を与えるのか?
- シングルユースバイオプロセシング用プローブ&センサー市場をさらに拡大するために、製品の商業化の必要性は高まっているのか?
- シングルユースバイオプロセシング用プローブ&センサー市場の方向性と、市場の最前線に立つためにはどうすればよいのか?
- 新製品やサービスラインに対する最適な投資オプションは何か?
- 企業を新たな成長軌道に乗せ、C-suiteに移行させるための重要な展望は何か?
このことがシングルユースバイオプロセシングプローブ&センサー市場に現在、そして今後10年間、どのような影響を与えるかを知る必要があります:
- 246ページにわたる本レポートでは、104の表と135のチャート/グラフを独占的に提供します。
- 本レポートでは、業界における主要な収益性の高い分野を取り上げており、今すぐその分野をターゲットにすることができます。
- 世界、地域、国の売上高と成長率を詳細に分析しています。
- 競合他社が成功した主要なトレンド、変化、収益予測をハイライトしています。
本レポートは、シングルユースバイオプロセシング用プローブ&センサー市場が今後10年間でどのように発展するか、またCOVID-19の景気後退やバウンスの変動に合わせて、今日お伝えします。この市場は、過去10年間のどの時点よりも今が重要である。
2033年までの予測やその他の分析により、商業的な展望を明らかにする。
- 今回の調査では、2033年までの収益予測に加え、直近の実績、成長率、市場シェアも掲載しています。
- ビジネスの展望や展開など、独自の分析がご覧いただけます。
- 定性的分析(市場力学、促進要因、機会、阻害要因など)、ポーターのファイブフォース分析、PEST分析、最近の動向をご覧いただけます。
本レポートでは、COVID-19が業界や貴社にどのような影響を与えるかについて、データ分析および貴重な知見を提供しています。COVID-19の4つの回収パターン、すなわち「V」「L」「W」「U」の回収パターンとその影響について考察しています。
報告書の対象セグメント
ワークフロー
- アップストリーム
- ダウンストリーム
タイプ
- 圧力センサー
- 温度センサー
- 流量計・センサー
- pHセンサー
- 酸素センサ
- 導電率センサー
- その他
エンドユーザー
- CMO・CRO
- 自社製造メーカー
世界市場全体およびセグメントの収益予測に加え、5つの地域および22の主要国市場の収益予測も掲載しています:
北米
- アメリカ
- カナダ
欧州
- ドイツ
- 英国
- フランス
- イタリア
- スペイン
- その他の欧州
アジア太平洋地域
- 日本
- 中国
- インド
- オーストラリア
- 韓国
- その他のアジア太平洋地域
ラテンアメリカ
- ブラジル
- メキシコ
- その他のラテンアメリカ地域
MEA
- GCC
- 南アフリカ
- その他のMEA
シングルユースバイオプロセシング用プローブ&センサー市場の2023年から2033年にかけての主要企業のプロファイルと、これらの企業のこのセグメントに焦点を当てたいくつかの企業についても記載しています。
主要企業と市場成長の可能性
・ ABEC
・ Broadley-James Corporation
・ Avantor, Inc.
・ Dover Corporation
・ ESI Ultrapure
・ Emerson Electric Co.
・ Eppendorf AG
・ Equflow
・ Hamilton Company
・ HIGH PURITY NEW ENGLAND
・ Malema Engineering Corporation (Dover)
・ METTLER TOLEDO
・ Parker Hannifin Corporation
・ PreSens Precision Sensing GmbH
・ PendoTECH
・ Sartorius AG
・ SONOTEC GmbH
・ Thermo Fisher Scientific
シングルユースバイオプロセシング用プローブ&センサー市場の世界全体の収益、2023年から2033年までの金額ベースで、市場は2023年に28億1200万米ドルを突破すると、我々の仕事は計算されます。2033年まで収益が大きく伸びることが予測されます。当社の調査では、最も大きな可能性を秘めた組織を特定します。彼らの能力、進歩、商業的な展望を発見し、あなたが一歩先を行くのを支援します。
シングルユースバイオプロセシング用プローブ&センサー市場、2023年から2033年までのレポートはどのように役立つのでしょうか?
240ページ以上のレポートをまとめると、以下のような知識を得ることができます:
- シングルユースバイオプロセシング用プローブ&センサー市場の2023年~2033年までの収益予測 ワークフロー、タイプ、エンドユーザー別に、世界と地域レベルでそれぞれ予測 - 業界の展望を発見し、投資と収益に最も有利な場所を見つけることができます。
- 5つの地域と22の主要国市場の2033年までの収益予測 - シングルユースバイオプロセシング用プローブ&センサー市場、2023年から2033年の市場予測を北米、ヨーロッパ、アジア太平洋、ラテンアメリカ、MEAでご覧いただけます。また、米国、カナダ、メキシコ、ブラジル、ドイツ、フランス、英国、イタリア、スペイン、ロシア、中国、インド、日本、オーストラリアなど、著名な経済圏の市場も予測されています。
- 既存企業および市場参入を目指す企業の展望 - シングルユースバイオプロセシング用プローブ&センサー市場に関わる主要企業18社の企業プロファイルを含む、2023年から2033年までの市場予測。
独自の予測による定量・定性分析をご覧いただけます。私たちのレポートだけが持つ情報を入手し、貴重なビジネスインテリジェンスとして情報を得ることができます。
他にはない情報
私たちの新しいレポートがあれば、知識に遅れをとったり、チャンスを逃したりする可能性は低くなります。当社の調査・分析・意思決定がどのように役立つかをご覧ください。Visiongainの調査は、シングルユースバイオプロセシング用プローブ&センサー市場、2023年から2033年、市場をリードする企業のための商業分析を必要とするすべての人のためのものです。データ、トレンド、予測を見つけることができます。
ページTOPに戻る
目次
目次
1 レポートの概要
1.1 研究の目的
1.2 シングルユースバイオプロセシング用プローブ&センサーの市場紹介
1.3 本レポートが提供するもの
1.4 本レポートを読むべき理由
1.5 本分析レポートが回答する主な質問は以下の通り:
1.6 本レポートは誰のためのものなのか?
1.7 方法論
1.7.1 市場の定義
1.7.2 市場評価・予測手法
1.7.3 データの妥当性確認
1.7.3.1 一次調査
1.7.3.2 セカンダリーリサーチ
1.8 よくある質問(FAQ)
1.9 Visiongainの関連レポート
1.10 Visiongainについて
2 エグゼクティブサマリー
3 市場の概要
3.1 主要な調査結果
3.2 マーケットダイナミクス
3.2.1 市場促進要因
3.2.1.1 バイオ生産におけるシングルユース技術(SUT)の導入の増加
3.2.1.2 バイオプロセスモニタリングの向上に対する需要の高まり
3.2.1.3 COVID-19ワクチン製造のボトルネックを回避するためのSUBの適用
3.2.1.4 技術の高度化
3.2.2 市場抑制要因
3.2.2.1 シングルユースセンサーの使用に関する技術的課題
3.2.2.2 熱滅菌が産業の成長を抑制する可能性が高い
3.2.2.3 高コストが産業成長の妨げになる可能性が高い
3.2.2.4 厳しい規制が市場成長の妨げになると予測される
3.2.3 市場機会
3.2.3.1 プロセスの合理化により、市場関係者に有利な機会がもたらされる
3.2.3.2 インダストリー4.0が有益な成長展望を提供する
3.2.3.3 オンライン培養モニタリング用シングルユースおよびオートクレーブセンサー
3.3 COVID-19の影響度分析
3.4 ポーターのファイブフォース分析
3.4.1 バイヤーパワー
3.4.2 サプライヤーパワー
3.4.3 競争力のあるライバル企業
3.4.4 代替品の脅威
3.4.5 新規参入の脅威
3.5 PEST分析
3.5.1 政治的要因
3.5.2 経済的要因
3.5.3 社会的要因
3.5.4 技術的要因
4 シングルユースバイオプロセシング用プローブ&センサー市場分析:ワークフロー別
4.1 主要な調査結果
4.2 ワークフローセグメント市場魅力度指数
4.3 シングルユースバイオプロセシング用プローブ&センサーのワークフロー別市場規模推定と予測
4.4 アップストリーム
4.4.1 2023〜2033年の地域別市場予測(US$ Mn, AGR %)
4.4.2 地域別市場シェア、2023年・2033年 (%)
4.5 ダウンストリーム
4.5.1 2023~2033 年、地域別市場予測 (US$ Mn, AGR %)
4.5.2 地域別市場シェア、2023年・2033年(%)
5 シングルユースバイオプロセシング用プローブ&センサーの市場分析:タイプ別
5.1 主要な調査結果
5.2 タイプセグメント市場魅力度指数
5.3 シングルユースバイオプロセシング用プローブ&センサーのタイプ別市場規模推定と予測
5.4 圧力センサー
5.4.1 2023年~2033年の地域別市場予測(US$ Mn、AGR %)
5.4.2 地域別市場シェア、2023年・2033年 (%)
5.5 温度センサー
5.5.1 2023年~2033年の地域別市場予測(US$ Mn, AGR %)
5.5.2 地域別市場シェア、2023年・2033年 (%)
5.6 フローメーターとセンサー
5.6.1 2023年~2033年の地域別市場予測(US$ Mn, AGR %)
5.6.2 地域別市場シェア、2023年・2033年 (%)
5.7 pHセンサー
5.7.1 2023年~2033年の地域別市場予測(US$ Mn, AGR %)
5.7.2 地域別市場シェア、2023年・2033年 (%)
5.8 酸素センサー
5.8.1 2023年~2033年の地域別市場予測(US$ Mn, AGR %)
5.8.2 地域別市場シェア、2023年・2033年 (%)
5.9 導電率センサー
5.9.1 2023年~2033年の地域別市場予測(US$ Mn, AGR %)
5.9.2 地域別市場シェア、2023年・2033年 (%)
5.10 その他
5.10.1 2023年~2033年の地域別市場予測(US$ Mn, AGR %)
5.10.2 地域別市場シェア、2023年・2033年 (%)
6 シングルユースバイオプロセシング用プローブ&センサー市場分析:エンドユーザー別
6.1 主要な調査結果
6.2 エンドユーザーセグメント: 市場魅力度指数
6.3 シングルユースバイオプロセシング用プローブ&センサー市場エンドユーザー別市場規模推定と予測
6.4 CMO/CROs
6.4.1 2023年~2033年の地域別市場予測(US$ Mn, AGR %)
6.4.2 地域別市場シェア、2023年・2033年 (%)
6.5 インハウスメーカー
6.5.1 2023年~2033年の地域別市場予測(US$ Mn, AGR %)
6.5.2 地域別市場シェア、2023年・2033年 (%)
7 シングルユースバイオプロセシング用プローブ&センサー市場分析:地域別
7.1 主要な調査結果
7.2 地域別市場規模の推定と予測
8 北米のシングルユースバイオプロセシング用プローブ&センサー市場分析
8.1 主要な調査結果
8.2 北米シングルユースバイオプロセシング用プローブ&センサー市場魅力度指数
8.3 国別市場規模、2023年、2028年、2033年 (US$ Mn)
8.4 国別市場規模推定と予測、2023年〜2033年(US$ Mn)
8.5 市場規模の推定と予測:ワークフロー別、2023年〜2033年(US$ Mn)
8.6 市場規模の推定と予測:タイプ別、2023年~2033年(US$ Mn)
8.7 市場規模の推定と予測:エンドユーザー別、2023年~2033年(US$ Mn)
8.8 米国のシングルユースバイオプロセシング用プローブ&センサーの市場分析
8.9 カナダのシングルユースバイオプロセシング用プローブ&センサーの市場分析
9 欧州のシングルユースバイオプロセシング用プローブ&センサー市場分析
9.1 主要な調査結果
9.2 欧州シングルユースバイオプロセシング用プローブ&センサー市場魅力度指数
9.3 国別市場規模、2023年、2028年、2033年 (US$ Mn)
9.4 国別市場規模推定と予測、2023年〜2033年(US$ Mn)
9.5 市場規模の推定と予測:ワークフロー別、2023年〜2033年(US$ Mn)
9.6 市場規模の推定と予測:タイプ別、2023年~2033年(US$ Mn)
9.7 市場規模の推定と予測:エンドユーザー別、2023年~2033年(US$ Mn)
9.8 ドイツのシングルユースバイオプロセシング用プローブ&センサーの市場分析
9.9 イギリスのシングルユースバイオプロセシング用プローブ&センサーの市場分析
9.10 フランスのシングルユースバイオプロセシング用プローブ&センサーの市場分析
9.11 イタリアのシングルユースバイオプロセシング用プローブ&センサーの市場分析
9.12 スペインのシングルユースバイオプロセシング用プローブ&センサーの市場分析
9.13 ロシアのシングルユースバイオプロセシング用プローブ&センサー市場分析
9.14 その他の欧州のシングルユースバイオプロセシング用プローブ&センサーの市場分析
10 アジア太平洋地域のシングルユースバイオプロセシング用プローブ&センサー市場分析
10.1 主要な調査結果
10.2 アジア太平洋地域のシングルユースバイオプロセシングプローブ&センサー市場魅力度指数
10.3 国別市場規模、2023年、2028年、2033年(US$ Mn)
10.4 国別市場規模の推定と予測、2023年~2033年(US$ Mn)
10.5 市場規模の推定と予測:ワークフロー別、2023年~2033年(US$ Mn)
10.6 市場規模の推定と予測:タイプ別、2023年〜2033年(US$ Mn)
10.7 市場規模の推定と予測:エンドユーザー別、2023年~2033年(US$ Mn)
10.8 日本のシングルユースバイオプロセシング用プローブ&センサーの市場分析
10.9 中国のシングルユースバイオプロセシング用プローブ&センサーの市場分析
10.10 インドのシングルユースバイオプロセシング用プローブ&センサーの市場分析
10.11 オーストラリアのシングルユースバイオプロセシング用プローブ&センサーの市場分析
10.12 韓国のシングルユースバイオプロセシング用プローブ&センサーの市場分析
10.13 その他のアジア太平洋地域のシングルユースバイオプロセシング用プローブ&センサーの市場分析
11 ラテンアメリカのシングルユースバイオプロセシング用プローブ&センサー市場分析
11.1 主要な調査結果
11.2 ラテンアメリカのシングルユースバイオプロセシング用プローブ&センサー市場魅力度指数
11.3 国別市場規模、2023年、2028年、2033年 (US$ Mn)
11.4 国別市場規模推定と予測、2023年〜2033年(US$ Mn)
11.5 市場規模の推定と予測:ワークフロー別、2023年〜2033年(US$ Mn)
11.6 市場規模の推定と予測:タイプ別、2023年~2033年(US$ Mn)
11.7 市場規模の推定と予測:エンドユーザー別、2023年~2033年(US$ Mn)
11.8 ブラジルのシングルユースバイオプロセシング用プローブ&センサー市場分析
11.9 メキシコのシングルユースバイオプロセシング用プローブ&センサーの市場分析
11.10 アルゼンチンのシングルユースバイオプロセシング用プローブ&センサーの市場分析
11.11 その他のラテンアメリカ地域のシングルユースバイオプロセシング用プローブ&センサー市場分析
12 MEAのシングルユースバイオプロセシング用プローブ&センサー市場分析
12.1 主要な調査結果
12.2 MEAシングルユースバイオプロセシング用プローブ&センサー市場魅力度指数
12.3 国別市場規模、2023年、2028年、2033年(US$ Mn)
12.4 国別市場規模推定と予測、2023年〜2033年(US$ Mn)
12.5 市場規模の推定と予測:ワークフロー別、2023年〜2033年(US$ Mn)
12.6 市場規模の推定と予測:タイプ別、2023年~2033年(US$ Mn)
12.7 市場規模の推定と予測:エンドユーザー別、2023年~2033年(US$ Mn)
12.8 GCCのシングルユースバイオプロセシング用プローブ&センサーの市場分析
12.9 南アフリカのシングルユースバイオプロセシング用プローブ&センサーの市場分析
12.10 その他のMEA地域 シングルユースバイオプロセシング用プローブ&センサーの市場分析
13 会社概要
13.1 ABEC
13.1.1 企業スナップショット
13.1.2 会社概要
13.1.3 製品ベンチマーキング
13.2 Broadley-James Corporation
13.2.1 企業スナップショット
13.2.2 会社概要
13.2.3 製品ベンチマーク
13.2.4 戦略的な展望
13.3 Avantor
13.3.1 企業スナップショット
13.3.2 会社概要
13.3.3 財務分析
13.3.3.1 純収益、2017-2022年
13.3.3.2 売上総利益、2017年~2022年
13.3.4 製品ベンチマーキング
13.3.5 戦略的な展望
13.4 Dover Corporation
13.4.1 企業スナップショット
13.4.2 会社概要
13.4.3 財務分析
13.4.3.1 純収益、2017年〜2022年
13.4.3.2 売上総利益、2017年〜2022年
13.4.4 製品のベンチマーキング
13.4.5 戦略的な展望
13.5 ESI Ultrapure
13.5.1 企業スナップショット
13.5.2 会社概要
13.5.3 製品ベンチマーク
13.6 Emerson Electric Co
13.6.1 カンパニースナップショット
13.6.2 会社概要
13.6.3 財務分析
13.6.3.1 純収益、2017年〜2022年
13.6.3.2 売上総利益、2017年〜2022年
13.6.4 製品ベンチマーキング
13.7 Eppendorf AG
13.7.1 企業スナップショット
13.7.2 会社概要
13.7.3 製品ベンチマーキング
13.8 Equflow
13.8.1 企業スナップショット
13.8.2 会社概要
13.8.3 ベンチマーキング
13.9 Hamilton Company
13.9.1 企業スナップショット
13.9.2 会社概要
13.9.3 製品ベンチマーク
13.9.4 戦略的な展望
13.10 High Purity New England, Inc.
13.10.1 企業スナップショット
13.10.2 会社概要
13.10.3 製品のベンチマーキング
13.10.4 戦略的な展望
13.11 Malema Engineering Corporation (Dover)
13.11.1 企業スナップショット
13.11.2 会社概要
13.11.3 製品ベンチマーク
13.11.4 戦略的な展望
13.12 METTLER TOLEDO
13.12.1 企業スナップショット
13.12.2 会社概要
13.12.3 財務分析
13.12.3.1 純収益、2017-2022年
13.12.3.2 R&D費用、2017年~2022年
13.12.3.3 売上総利益、2017年~2022年
13.12.4 製品のベンチマーキング
13.13 Parker Hannifin Corporation
13.13.1 企業スナップショット
13.13.2 会社概要
13.13.3 財務分析
13.13.3.1 純収益、2017年〜2022年
13.13.3.2 売上総利益、2017年〜2022年
13.13.4 製品ベンチマーキング
13.14 PreSens Precision Sensing GmbH
13.14.1 企業スナップショット
13.14.2 会社概要
13.14.3 製品ベンチマーキング
13.15 PendoTECH LLC
13.15.1 企業スナップショット
13.15.2 会社概要
13.15.3 製品ベンチマーク
13.16 Sartorius AG
13.16.1 企業スナップショット
13.16.2 会社概要
13.16.3 財務分析
13.16.3.1 純収益、2017-2021年
13.16.3.2 R&D費用、2017年〜2021年
13.16.3.3 売上総利益、2017年~2021年
13.16.4 製品のベンチマーキング
13.16.5 戦略的な展望
13.17 SONOTEC GmbH
13.17.1 企業スナップショット
13.17.2 会社概要
13.17.3 製品ベンチマーク
13.18 Thermo Fisher Scientific
13.18.1 企業スナップショット
13.18.2 会社概要
13.18.3 財務分析
13.18.3.1 純収益、2017-2022年
13.18.3.2 R&D費、2017年〜2022年
13.18.3.3 売上総利益、2017年~2022年
13.18.4 製品ベンチマーキング
14 結論と提言
14.1 Visiongainからの結びの言葉
14.2 市場関係者への提言
ページTOPに戻る
図表リスト
表の一覧
Table 1 Single-use Bioprocessing Probes & Sensors Market Snapshot, 2023 & 2033 (US$ Million, CAGR %)
Table 2 Single-use Bioprocessing Probes & Sensors Market Forecast by Region, 2023-2033 (US$ Million, AGR%, CAGR%): "V" Shaped Recovery
Table 3 Single-use Bioprocessing Probes & Sensors Market Forecast by Region, 2023-2033 (US$ Million, AGR%, CAGR%): "U" Shaped Recovery
Table 4 Single-use Bioprocessing Probes & Sensors Market Forecast by Region, 2023-2033 (US$ Million, AGR%, CAGR%): "W" Shaped Recovery
Table 5 Single-use Bioprocessing Probes & Sensors Market Forecast by Region, 2023-2033 (US$ Million, AGR%, CAGR%): "L" Shaped Recovery
Table 6 Single-use Bioprocessing Probes & Sensors Market Forecast by Workflow, 2023-2033 (US$ Million, AGR%, CAGR%)
Table 7 Upstream Segment Market Forecast by Region, 2023-2033 (US$ Million, AGR%, CAGR%)
Table 8 Downstream Segment Market Forecast by Region, 2023-2033 (US$ Million, AGR%, CAGR%)
Table 9 Single-use Bioprocessing Probes & Sensors Market Forecast by Type, 2023-2033 (US$ Million, AGR%, CAGR%)
Table 10 Pressure Sensors Segment Market Forecast by Region, 2023-2033 (US$ Million, AGR%, CAGR%)
Table 11 Temperature Sensors Segment Market Forecast by Region, 2023-2033 (US$ Million, AGR%, CAGR%)
Table 12 Flow Meters and Sensors Segment Market Forecast by Region, 2023-2033 (US$ Million, AGR%, CAGR%)
Table 13 pH Sensors Segment Market Forecast by Region, 2023-2033 (US$ Million, AGR%, CAGR%)
Table 14 Oxygen Sensors Segment Market Forecast by Region, 2023-2033 (US$ Million, AGR%, CAGR%)
Table 15 Conductivity Sensors Segment Market Forecast by Region, 2023-2033 (US$ Million, AGR%, CAGR%)
Table 16 Others Segment Market Forecast by Region, 2023-2033 (US$ Million, AGR%, CAGR%)
Table 17 CMOs/CROs Segment Market Forecast by Region, 2023-2033 (US$ Million, AGR%, CAGR%)
Table 18 In-house Manufacturers Segment Market Forecast by Region, 2023-2033 (US$ Million, AGR%, CAGR%)
Table 19 Single-use Bioprocessing Probes & Sensors Market Forecast by Region, 2023-2033 (US$ Million, AGR%, CAGR%)
Table 20 North America Single-use Bioprocessing Probes & Sensors Market Forecast by Country, 2023-2033 (US$ Million, AGR%, CAGR%)
Table 21 North America Single-use Bioprocessing Probes & Sensors Market Forecast by Workflow, 2023-2033 (US$ Million, AGR%, CAGR%)
Table 22 North America Single-use Bioprocessing Probes & Sensors Market Forecast by Type, 2023-2033 (US$ Million, AGR%, CAGR%)
Table 23 North America Single-use Bioprocessing Probes & Sensors Market Forecast by End-use, 2023-2033 (US$ Million, AGR%, CAGR%)
Table 24 U.S. Single-use Bioprocessing Probes & Sensors Market Forecast, 2023-2033 (US$ Million, AGR%, CAGR%)
Table 25 Canada Single-use Bioprocessing Probes & Sensors Market Forecast, 2023-2033 (US$ Million, AGR%, CAGR%)
Table 26 Europe Single-use Bioprocessing Probes & Sensors Market Forecast by Country, 2023-2033 (US$ Million, AGR%, CAGR%)
Table 27 Europe Single-use Bioprocessing Probes & Sensors Market Forecast by Workflow, 2023-2033 (US$ Million, AGR%, CAGR%)
Table 28 Europe Single-use Bioprocessing Probes & Sensors Market Forecast by Type, 2023-2033 (US$ Million, AGR%, CAGR%)
Table 29 Europe Single-use Bioprocessing Probes & Sensors Market Forecast by End-use, 2023-2033 (US$ Million, AGR%, CAGR%)
Table 30 Germany Single-use Bioprocessing Probes & Sensors Market Forecast, 2023-2033 (US$ Million, AGR%, CAGR%)
Table 31 UK Single-use Bioprocessing Probes & Sensors Market Forecast, 2023-2033 (US$ Million, AGR%, CAGR%)
Table 32 France Single-use Bioprocessing Probes & Sensors Market Forecast, 2023-2033 (US$ Million, AGR%, CAGR%)
Table 33 Italy Single-use Bioprocessing Probes & Sensors Market Forecast, 2023-2033 (US$ Million, AGR%, CAGR%)
Table 34 Spain Single-use Bioprocessing Probes & Sensors Market Forecast, 2023-2033 (US$ Million, AGR%, CAGR%)
Table 35 Russia Single-use Bioprocessing Probes & Sensors Market Forecast, 2023-2033 (US$ Million, AGR%, CAGR%)
Table 36 Rest of Europe Single-use Bioprocessing Probes & Sensors Market Forecast, 2023-2033 (US$ Million, AGR%, CAGR%)
Table 37 Asia Pacific Single-use Bioprocessing Probes & Sensors Market Forecast by Country, 2023-2033 (US$ Million, AGR%, CAGR%)
Table 38 Asia Pacific Single-use Bioprocessing Probes & Sensors Market Forecast by Workflow, 2023-2033 (US$ Million, AGR%, CAGR%)
Table 39 Asia Pacific Single-use Bioprocessing Probes & Sensors Market Forecast by Type, 2023-2033 (US$ Million, AGR%, CAGR%)
Table 40 Asia Pacific Single-use Bioprocessing Probes & Sensors Market Forecast by End-use, 2023-2033 (US$ Million, AGR%, CAGR%)
Table 41 Japan Single-use Bioprocessing Probes & Sensors Market Forecast, 2023-2033 (US$ Million, AGR%, CAGR%)
Table 42 China Single-use Bioprocessing Probes & Sensors Market Forecast, 2023-2033 (US$ Million, AGR%, CAGR%)
Table 43 India Single-use Bioprocessing Probes & Sensors Market Forecast, 2023-2033 (US$ Million, AGR%, CAGR%)
Table 44 Australia Single-use Bioprocessing Probes & Sensors Market Forecast, 2023-2033 (US$ Million, AGR%, CAGR%)
Table 45 South Korea Single-use Bioprocessing Probes & Sensors Market Forecast, 2023-2033 (US$ Million, AGR%, CAGR%)
Table 46 Rest of Asia Pacific Single-use Bioprocessing Probes & Sensors Market Forecast, 2023-2033 (US$ Million, AGR%, CAGR%)
Table 47 Latin America Single-use Bioprocessing Probes & Sensors Market Forecast by Country, 2023-2033 (US$ Million, AGR%, CAGR%)
Table 48 Latin America Single-use Bioprocessing Probes & Sensors Market Forecast by Workflow, 2023-2033 (US$ Million, AGR%, CAGR%)
Table 49 Latin America Single-use Bioprocessing Probes & Sensors Market Forecast by Type, 2023-2033 (US$ Million, AGR%, CAGR%)
Table 50 Latin America Single-use Bioprocessing Probes & Sensors Market Forecast by End-use, 2023-2033 (US$ Million, AGR%, CAGR%)
Table 51 Brazil Single-use Bioprocessing Probes & Sensors Market Forecast, 2023-2033 (US$ Million, AGR%, CAGR%)
Table 52 Mexico Single-use Bioprocessing Probes & Sensors Market Forecast, 2023-2033 (US$ Million, AGR%, CAGR%)
Table 53 Argentina Single-use Bioprocessing Probes & Sensors Market Forecast, 2023-2033 (US$ Million, AGR%, CAGR%)
Table 54 Rest of Latin America Single-use Bioprocessing Probes & Sensors Market Forecast, 2023-2033 (US$ Million, AGR%, CAGR%)
Table 55 MEA Single-use Bioprocessing Probes & Sensors Market Forecast by Country, 2023-2033 (US$ Million, AGR%, CAGR%)
Table 56 MEA Single-use Bioprocessing Probes & Sensors Market Forecast by Workflow, 2023-2033 (US$ Million, AGR%, CAGR%)
Table 57 MEA Single-use Bioprocessing Probes & Sensors Market Forecast by Type, 2023-2033 (US$ Million, AGR%, CAGR%)
Table 58 MEA Single-use Bioprocessing Probes & Sensors Market Forecast by End-use, 2023-2033 (US$ Million, AGR%, CAGR%)
Table 59 GCC Single-use Bioprocessing Probes & Sensors Market Forecast, 2023-2033 (US$ Million, AGR%, CAGR%)
Table 60 South Africa Single-use Bioprocessing Probes & Sensors Market Forecast, 2023-2033 (US$ Million, AGR%, CAGR%)
Table 61 Rest of MEA Single-use Bioprocessing Probes & Sensors Market Forecast, 2023-2033 (US$ Million, AGR%, CAGR%)
Table 62 ABEC: Key Details, (CEO, HQ, Revenue, Founded, No. of Employees, Company Type, Website, Business Segment)
Table 63 ABEC: Product Benchmarking
Table 64 Broadley-James Corporation: Key Details, (CEO, HQ, Revenue, Founded, No. of Employees, Company Type, Website, Business Segment)
Table 65 Broadley-James Corporation: Product Benchmarking
Table 66 Broadley-James Corporation: Strategic Outlook
Table 67 Avantor: Key Details, (CEO, HQ, Revenue, Founded, No. of Employees, Company Type, Website, Business Segment)
Table 68 Avantor: Product Benchmarking
Table 69 Avantor: Strategic Outlook
Table 70 Dover Corporation: Key Details, (CEO, HQ, Revenue, Founded, No. of Employees, Company Type, Website, Business Segment)
Table 71 Dover Corporation: Product Benchmarking
Table 72 Dover Corporation: Strategic Outlook
Table 73 ESI Ultrapure: Key Details, (CEO, HQ, Revenue, Founded, No. of Employees, Company Type, Website, Business Segment)
Table 74 ESI Ultrapure: Product Benchmarking
Table 75 Emerson Electric Co: Key Details, (CEO, HQ, Revenue, Founded, No. of Employees, Company Type, Website, Business Segment)
Table 76 Emerson Electric Co: Product Benchmarking
Table 77 Eppendorf AG: Key Details, (CEO, HQ, Revenue, Founded, No. of Employees, Company Type, Website, Business Segment)
Table 78 Eppendorf AG: Product Benchmarking
Table 79 Equflow: Key Details, (CEO, HQ, Revenue, Founded, No. of Employees, Company Type, Website, Business Segment)
Table 80 Equflow: Product Benchmarking
Table 81 Hamilton Company: Key Details, (CEO, HQ, Revenue, Founded, No. of Employees, Company Type, Website, Business Segment)
Table 82 Hamilton Company: Product Benchmarking
Table 83 Hamilton Company: Strategic Outlook
Table 84 High Purity New England, Inc.: Key Details, (CEO, HQ, Revenue, Founded, No. of Employees, Company Type, Website, Business Segment)
Table 85 High Purity New England, Inc.: Product Benchmarking
Table 86 High Purity New England, Inc.: Strategic Outlook
Table 87 Malema Engineering Corporation: Key Details, (CEO, HQ, Revenue, Founded, No. of Employees, Company Type, Website, Business Segment)
Table 88 Malema Engineering Corporation: Product Benchmarking
Table 89 Malema Engineering Corporation: Strategic Outlook
Table 90 METTLER TOLEDO: Key Details, (CEO, HQ, Revenue, Founded, No. of Employees, Company Type, Website, Business Segment)
Table 91 METTLER TOLEDO: Product Benchmarking
Table 92 Parker Hannifin Corporation: Key Details, (CEO, HQ, Revenue, Founded, No. of Employees, Company Type, Website, Business Segment)
Table 93 Parker Hannifin Corporation: Product Benchmarking
Table 94 PreSens Precision Sensing GmbH: Key Details, (CEO, HQ, Revenue, Founded, No. of Employees, Company Type, Website, Business Segment)
Table 95 PreSens Precision Sensing GmbH: Product Benchmarking
Table 96 PendoTECH LLC: Key Details, (CEO, HQ, Revenue, Founded, No. of Employees, Company Type, Website, Business Segment)
Table 97 PendoTECH LLC: Product Benchmarking
Table 98 Sartorius AG: Key Details, (CEO, HQ, Revenue, Founded, No. of Employees, Company Type, Website, Business Segment)
Table 99 Sartorius AG: Product Benchmarking
Table 100 Sartorius AG: Strategic Outlook
Table 101 SONOTEC GmbH: Key Details, (CEO, HQ, Revenue, Founded, No. of Employees, Company Type, Website, Business Segment)
Table 102 SONOTEC GmbH: Product Benchmarking
Table 103 Thermo Fisher Scientific: Key Details, (CEO, HQ, Revenue, Founded, No. of Employees, Company Type, Website, Business Segment)
Table 104 Thermo Fisher Scientific: Product Benchmarking
図の一覧
Figure 1 Single-use Bioprocessing Probes & Sensors Market Segmentation
Figure 2 Single-use Bioprocessing Probes & Sensors Market by Workflow: Market Attractiveness Index
Figure 3 Single-use Bioprocessing Probes & Sensors Market by Type: Market Attractiveness Index
Figure 4 Single-use Bioprocessing Probes & Sensors Market by End-users: Market Attractiveness Index
Figure 5 Single-use Bioprocessing Probes & Sensors Market Attractiveness Index by Region
Figure 6 Single-use Bioprocessing Probes & Sensors Market: Market Dynamics
Figure 7 Single-use Bioprocessing Probes & Sensors Market by Region, 2023-2033 (US$ Mn, AGR %): “V” Shaped Recovery
Figure 8 Single-use Bioprocessing Probes & Sensors Market by Region, 2023-2033 (US$ Mn, AGR %): “U” Shaped Recovery
Figure 9 Single-use Bioprocessing Probes & Sensors Market by Region, 2023-2033 (US$ Mn, AGR %): “W” Shaped Recovery
Figure 10 Single-use Bioprocessing Probes & Sensors Market by Region, 2023-2033 (US$ Mn, AGR %): “L” Shaped Recovery
Figure 11 Porter’s Analysis
Figure 12 PEST Analysis
Figure 13 Single-use Bioprocessing Probes & Sensors Market Attractiveness Index by Workflow
Figure 14 Single-use Bioprocessing Probes & Sensors Market Forecast by Workflow, 2023-2033 (US$ Million, AGR %)
Figure 15 Single-use Bioprocessing Probes & Sensors Market Share Forecast by Workflow, 2023, 2028, 2033 (%)
Figure 16 Upstream Segment Market Forecast by Region, 2023-2033 (US$ Million, AGR %)
Figure 17 Upstream Segment Market Share Forecast by Region, 2023 & 2033 (%)
Figure 18 Downstream Segment Market Forecast by Region, 2023-2033 (US$ Million, AGR %)
Figure 19 Downstream Segment Market Share Forecast by Region, 2023 & 2033 (%)
Figure 20 Single-use Bioprocessing Probes & Sensors Market Attractiveness Index by Workflow
Figure 21 Single-use Bioprocessing Probes & Sensors Market Forecast by Type, 2023-2033 (US$ Million, AGR %)
Figure 22 Single-use Bioprocessing Probes & Sensors Market Share Forecast by Type, 2023, 2028, 2033 (%)
Figure 23 Pressure Sensors Segment Market Forecast by Region, 2023-2033 (US$ Million, AGR %)
Figure 24 Pressure Sensors Segment Market Share Forecast by Region, 2023 & 2033 (%)
Figure 25 Temperature Sensors Segment Market Forecast by Region, 2023-2033 (US$ Million, AGR %)
Figure 26 Temperature Sensors Segment Market Share Forecast by Region, 2023 & 2033 (%)
Figure 27 Flow Meters and Sensors Segment Market Forecast by Region, 2023-2033 (US$ Million, AGR %)
Figure 28 Flow Meters and Sensors Segment Market Share Forecast by Region, 2023 & 2033 (%)
Figure 29 pH Sensors Segment Market Forecast by Region, 2023-2033 (US$ Million, AGR %)
Figure 30 pH Sensors Segment Market Share Forecast by Region, 2023 & 2033 (%)
Figure 31 Oxygen Sensors Segment Market Forecast by Region, 2023-2033 (US$ Million, AGR %)
Figure 32 Oxygen Sensors Segment Market Share Forecast by Region, 2023 & 2033 (%)
Figure 33 Conductivity Sensors Segment Market Forecast by Region, 2023-2033 (US$ Million, AGR %)
Figure 34 Conductivity Sensors Segment Market Share Forecast by Region, 2023 & 2033 (%)
Figure 35 Others Segment Market Forecast by Region, 2023-2033 (US$ Million, AGR %)
Figure 36 Others Segment Market Share Forecast by Region, 2023 & 2033 (%)
Figure 37 Single-use Bioprocessing Probes & Sensors Market Attractiveness Index by End-users
Figure 38 Single-use Bioprocessing Probes & Sensors Market Forecast by End-users, 2023-2033 (US$ Million, AGR %)
Figure 39 Single-use Bioprocessing Probes & Sensors Market Share Forecast by End-users, 2023, 2028, 2033 (%)
Figure 40 CMOs/CROs Segment Market Forecast by Region, 2023-2033 (US$ Million, AGR %)
Figure 41 CMOs/CROs Segment Market Share Forecast by Region, 2023 & 2033 (%)
Figure 42 In-house Manufacturers Segment Market Forecast by Region, 2023-2033 (US$ Million, AGR %)
Figure 43 In-house Manufacturers Segment Market Share Forecast by Region, 2023 & 2033 (%)
Figure 44 Single-use Bioprocessing Probes & Sensors Market Forecast by Region 2023, 2028, 2033 (Revenue, CAGR%)
Figure 45 Single-use Bioprocessing Probes & Sensors Market Share Forecast by Region 2023, 2028, 2033 (%)
Figure 46 Single-use Bioprocessing Probes & Sensors Market by Region, 2023-2033 (US$ Mn)
Figure 47 North America Single-use Bioprocessing Probes & Sensors Market Attractiveness Index
Figure 48 North America Single-use Bioprocessing Probes & Sensors Market by Region, 2023, 2028 & 2033 (US$ Million)
Figure 49 North America Single-use Bioprocessing Probes & Sensors Market Forecast by Country, 2023-2033 (US$ Million)
Figure 50 North America Single-use Bioprocessing Probes & Sensors Market Share Forecast by Country, 2023 & 2033 (%)
Figure 51 North America Single-use Bioprocessing Probes & Sensors Market Forecast by Workflow, 2023-2033 (US$ Million, AGR %)
Figure 52 North America Single-use Bioprocessing Probes & Sensors Market Share Forecast by Workflow, 2023 & 2033 (%)
Figure 53 North America Single-use Bioprocessing Probes & Sensors Market Forecast by Type, 2023-2033 (US$ Million, AGR %)
Figure 54 North America Single-use Bioprocessing Probes & Sensors Market Share Forecast by Type, 2023 & 2033 (%)
Figure 55 North America Single-use Bioprocessing Probes & Sensors Market Forecast by End-users, 2023-2033 (US$ Million, AGR %)
Figure 56 North America Single-use Bioprocessing Probes & Sensors Market Share Forecast by End-users, 2023 & 2033 (%)
Figure 57 U.S. Single-use Bioprocessing Probes & Sensors Market Forecast, 2023-2033 (US$ Million, AGR %)
Figure 58 Canada Single-use Bioprocessing Probes & Sensors Market Forecast, 2023-2033 (US$ Million, AGR %)
Figure 59 Europe Single-use Bioprocessing Probes & Sensors Market Attractiveness Index
Figure 60 Europe Single-use Bioprocessing Probes & Sensors Market by Region, 2023, 2028 & 2033 (US$ Million)
Figure 61 Europe Single-use Bioprocessing Probes & Sensors Market Forecast by Country, 2023-2033 (US$ Million)
Figure 62 Europe Single-use Bioprocessing Probes & Sensors Market Share Forecast by Country, 2023 & 2033 (%)
Figure 63 Europe Single-use Bioprocessing Probes & Sensors Market Forecast by Workflow, 2023-2033 (US$ Million, AGR %)
Figure 64 Europe Single-use Bioprocessing Probes & Sensors Market Share Forecast by Workflow, 2023 & 2033 (%)
Figure 65 Europe Single-use Bioprocessing Probes & Sensors Market Forecast by Type, 2023-2033 (US$ Million, AGR %)
Figure 66 Europe Single-use Bioprocessing Probes & Sensors Market Share Forecast by Type, 2023 & 2033 (%)
Figure 67 Europe Single-use Bioprocessing Probes & Sensors Market Forecast by End-users, 2023-2033 (US$ Million, AGR %)
Figure 68 Europe Single-use Bioprocessing Probes & Sensors Market Share Forecast by End-users, 2023 & 2033 (%)
Figure 69 Germany Single-use Bioprocessing Probes & Sensors Market Forecast, 2023-2033 (US$ Million, AGR %)
Figure 70 UK Single-use Bioprocessing Probes & Sensors Market Forecast, 2023-2033 (US$ Million, AGR %)
Figure 71 France Single-use Bioprocessing Probes & Sensors Market Forecast, 2023-2033 (US$ Million, AGR %)
Figure 72 Italy Single-use Bioprocessing Probes & Sensors Market Forecast, 2023-2033 (US$ Million, AGR %)
Figure 73 Spain Single-use Bioprocessing Probes & Sensors Market Forecast, 2023-2033 (US$ Million, AGR %)
Figure 74 Russia Single-use Bioprocessing Probes & Sensors Market Forecast, 2023-2033 (US$ Million, AGR %)
Figure 75 Rest of Europe Single-use Bioprocessing Probes & Sensors Market Forecast, 2023-2033 (US$ Million, AGR %)
Figure 76 Asia Pacific Single-use Bioprocessing Probes & Sensors Market Attractiveness Index
Figure 77 Asia Pacific Single-use Bioprocessing Probes & Sensors Market by Region, 2023, 2028 & 2033 (US$ Million)
Figure 78 Asia Pacific Single-use Bioprocessing Probes & Sensors Market Forecast by Country, 2023-2033 (US$ Million)
Figure 79 Asia Pacific Single-use Bioprocessing Probes & Sensors Market Share Forecast by Country, 2023 & 2033 (%)
Figure 80 Asia Pacific Single-use Bioprocessing Probes & Sensors Market Forecast by Workflow, 2023-2033 (US$ Million, AGR %)
Figure 81 Asia Pacific Single-use Bioprocessing Probes & Sensors Market Share Forecast by Workflow, 2023 & 2033 (%)
Figure 82 Asia Pacific Single-use Bioprocessing Probes & Sensors Market Forecast by Type, 2023-2033 (US$ Million, AGR %)
Figure 83 Asia Pacific Single-use Bioprocessing Probes & Sensors Market Share Forecast by Type, 2023 & 2033 (%)
Figure 84 Asia Pacific Single-use Bioprocessing Probes & Sensors Market Forecast by End-users, 2023-2033 (US$ Million, AGR %)
Figure 85 Asia Pacific Single-use Bioprocessing Probes & Sensors Market Share Forecast by End-users, 2023 & 2033 (%)
Figure 86 Japan Single-use Bioprocessing Probes & Sensors Market Forecast, 2023-2033 (US$ Million, AGR %)
Figure 87 China Single-use Bioprocessing Probes & Sensors Market Forecast, 2023-2033 (US$ Million, AGR %)
Figure 88 India Single-use Bioprocessing Probes & Sensors Market Forecast, 2023-2033 (US$ Million, AGR %)
Figure 89 Australia Single-use Bioprocessing Probes & Sensors Market Forecast, 2023-2033 (US$ Million, AGR %)
Figure 90 South Korea Single-use Bioprocessing Probes & Sensors Market Forecast, 2023-2033 (US$ Million, AGR %)
Figure 91 Rest of Asia Pacific Single-use Bioprocessing Probes & Sensors Market Forecast, 2023-2033 (US$ Million, AGR %)
Figure 92 Latin America Single-use Bioprocessing Probes & Sensors Market Attractiveness Index
Figure 93 Latin America Single-use Bioprocessing Probes & Sensors Market by Region, 2023, 2028 & 2033 (US$ Million)
Figure 94 Latin America Single-use Bioprocessing Probes & Sensors Market Forecast by Country, 2023-2033 (US$ Million)
Figure 95 Latin America Single-use Bioprocessing Probes & Sensors Market Share Forecast by Country, 2023 & 2033 (%)
Figure 96 Latin America Single-use Bioprocessing Probes & Sensors Market Forecast by Workflow, 2023-2033 (US$ Million, AGR %)
Figure 97 Latin America Single-use Bioprocessing Probes & Sensors Market Share Forecast by Workflow, 2023 & 2033 (%)
Figure 98 Latin America Single-use Bioprocessing Probes & Sensors Market Forecast by Type, 2023-2033 (US$ Million, AGR %)
Figure 99 Latin America Single-use Bioprocessing Probes & Sensors Market Share Forecast by Type, 2023 & 2033 (%)
Figure 100 Latin America Single-use Bioprocessing Probes & Sensors Market Forecast by End-users, 2023-2033 (US$ Million, AGR %)
Figure 101 Latin America Single-use Bioprocessing Probes & Sensors Market Share Forecast by End-users, 2023 & 2033 (%)
Figure 102 Brazil Single-use Bioprocessing Probes & Sensors Market Forecast, 2023-2033 (US$ Million, AGR %)
Figure 103 Mexico Single-use Bioprocessing Probes & Sensors Market Forecast, 2023-2033 (US$ Million, AGR %)
Figure 104 Argentina Single-use Bioprocessing Probes & Sensors Market Forecast, 2023-2033 (US$ Million, AGR %)
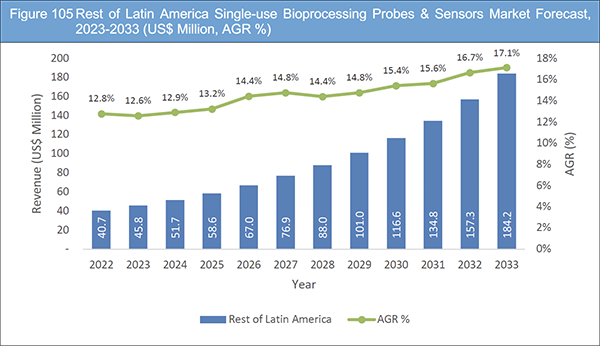
Figure 105 Rest of Latin America Single-use Bioprocessing Probes & Sensors Market Forecast, 2023-2033 (US$ Million, AGR %)
Figure 106 MEA Single-use Bioprocessing Probes & Sensors Market Attractiveness Index
Figure 107 MEA Single-use Bioprocessing Probes & Sensors Market by Region, 2023, 2028 & 2033 (US$ Million)
Figure 108 MEA Single-use Bioprocessing Probes & Sensors Market Forecast by Country, 2023-2033 (US$ Million)
Figure 109 MEA Single-use Bioprocessing Probes & Sensors Market Share Forecast by Country, 2023 & 2033 (%)
Figure 110 MEA Single-use Bioprocessing Probes & Sensors Market Forecast by Workflow, 2023-2033 (US$ Million, AGR %)
Figure 111 MEA Single-use Bioprocessing Probes & Sensors Market Share Forecast by Workflow, 2023 & 2033 (%)
Figure 112 MEA Single-use Bioprocessing Probes & Sensors Market Forecast by Type, 2023-2033 (US$ Million, AGR %)
Figure 113 MEA Single-use Bioprocessing Probes & Sensors Market Share Forecast by Type, 2023 & 2033 (%)
Figure 114 MEA Single-use Bioprocessing Probes & Sensors Market Forecast by End-users, 2023-2033 (US$ Million, AGR %)
Figure 115 MEA Single-use Bioprocessing Probes & Sensors Market Share Forecast by End-users, 2023 & 2033 (%)
Figure 116 GCC Single-use Bioprocessing Probes & Sensors Market Forecast, 2023-2033 (US$ Million, AGR %)
Figure 117 South Africa Single-use Bioprocessing Probes & Sensors Market Forecast, 2023-2033 (US$ Million, AGR %)
Figure 118 Rest of MEA Single-use Bioprocessing Probes & Sensors Market Forecast, 2023-2033 (US$ Million, AGR %)
Figure 119 Avantor: Net Revenue, 2017-2022 (US$ Million, AGR%)
Figure 120 Avantor: Gross Profit, 2017-2022 (US$ Million, AGR%)
Figure 121 Dover Corporation: Net Revenue, 2017-2022 (US$ Million, AGR%)
Figure 122 Dover Corporation: Gross Profit, 2017-2022 (US$ Million, AGR%)
Figure 123 Emerson Electric Co: Net Revenue, 2017-2022 (US$ Million, AGR%)
Figure 124 Emerson Electric Co: Gross Profit, 2017-2022 (US$ Million, AGR%)
Figure 125 METTLER TOLEDO: Net Revenue, 2017-2022 (US$ Million, AGR%)
Figure 126 METTLER TOLEDO: R&D Expenses, 2017-2022 (US$ Million, AGR%)
Figure 127 METTLER TOLEDO: Gross Profit, 2017-2022 (US$ Million, AGR%)
Figure 128 Parker Hannifin Corporation: Net Revenue, 2017-2022 (US$ Million, AGR%)
Figure 129 Parker Hannifin Corporation: Gross Profit, 2017-2022 (US$ Million, AGR%)
Figure 130 Sartorius AG: Net Revenue, 2017-2021 (US$ Million, AGR%)
Figure 131 Sartorius AG: R&D Expenses, 2017-2021 (US$ Million, AGR%)
Figure 132 Sartorius AG: Gross Profit, 2017-2021 (US$ Million, AGR%)
Figure 133 Thermo Fisher Scientific: Net Revenue, 2017-2022 (US$ Million, AGR%)
Figure 134 Thermo Fisher Scientific: R&D Expenses, 2017-2022 (US$ Million, AGR%)
Figure 135 Thermo Fisher Scientific: Gross Profit, 2017-2022 (US$ Million, AGR%)
ページTOPに戻る
Summary
Report Details
The Single-use Bioprocessing Probes & Sensors Market Report 2023-2033: This report will prove invaluable to leading firms striving for new revenue pockets if they wish to better understand the industry and its underlying dynamics. It will be useful for companies that would like to expand into different industries or to expand their existing operations in a new region.
Advancement in Technology Projected to Spur Industry Growth
Advancements in artificial intelligence (AI) and nanotechnology are spurring innovation and enhancing bioprocessing efficiency, which is having a significant effect on the single-use bioprocessing probes and sensors industry. AI is being implemented to develop sophisticated data analytics and machine learning algorithms that can assist manufacturers in optimising processes and enhancing product quality. For instance, AI can be used to analyse data from sensors and devices in real-time, providing insights into process performance, enabling quicker and more accurate decision making.
Furthermore, nanotechnology is being implemented to develop new materials for single use in bioprocessing. For example, nanomaterials can be utilised to enhance the mechanical strength, flexibility, and durability of single-use containers, bioreactors, and other components. This can increase product quality and decrease the likelihood of contamination. The development of 3D printing technology is another example of how technology is impacting the industry of single-use bioprocessing. Rapid prototyping and production of custom components, such as sensors and instruments that are tailored to specific manufacturing processes and applications are made possible by 3D printing. This can increase the efficacy of the process and reduce costs.
What Questions Should You Ask before Buying a Market Research Report?
• How is the single-use bioprocessing probes & sensors market evolving?
• What is driving and restraining the single-use bioprocessing probes & sensors market?
• How will each single-use bioprocessing probes & sensors submarket segment grow over the forecast period and how much revenue will these submarkets account for in 2033?
• How will the market shares for each single-use bioprocessing probes & sensors submarket develop from 2023 to 2033?
• What will be the main driver for the overall market from 2023 to 2033?
• Will leading single-use bioprocessing probes & sensors markets broadly follow the macroeconomic dynamics, or will individual national markets outperform others?
• How will the market shares of the national markets change by 2033 and which geographical region will lead the market in 2033?
• Who are the leading players and what are their prospects over the forecast period?
• What are the single-use bioprocessing probes & sensors projects for these leading companies?
• How will the industry evolve during the period between 2023 and 2033? What are the implications of
Single-use bioprocessing probes & sensors projects taking place now and over the next 10 years?
• Is there a greater need for product commercialisation to further scale the single-use bioprocessing probes & sensors market?
• Where is the single-use bioprocessing probes & sensors market heading and how can you ensure you are at the forefront of the market?
• What are the best investment options for new product and service lines?
• What are the key prospects for moving companies into a new growth path and C-suite?
You need to discover how this will impact the single-use bioprocessing probes & sensors market today, and over the next 10 years:
• Our 246-page report provides 104 tables and 135 charts/graphs exclusively to you.
• The report highlights key lucrative areas in the industry so you can target them – NOW.
• It contains in-depth analysis of global, regional and national sales and growth.
• It highlights for you the key successful trends, changes and revenue projections made by your competitors.
This report tells you TODAY how the single-use bioprocessing probes & sensors market will develop in the next 10 years, and in line with the variations in COVID-19 economic recession and bounce. This market is more critical now than at any point over the last 10 years.
Forecasts to 2033 and other analyses reveal commercial prospects
• In addition to revenue forecasting to 2033, our new study provides you with recent results, growth rates, and market shares.
• You will find original analyses, with business outlooks and developments.
• Discover qualitative analyses (including market dynamics, drivers, opportunities, and restraints), Porter’s Five Forces Analysis, PEST Analysis and recent developments.
This report includes data analysis and invaluable insight into how COVID-19 will affect the industry and your company. Four COVID-19 recovery patterns and their impact, namely, “V”, “L”, “W” and “U” are discussed in this report.
Segments Covered in the Report
Workflow
• Upstream
• Downstream
Type
• Pressure Sensors
• Temperature Sensors
• Flow Meters and Sensors
• pH Sensors
• Oxygen Sensors
• Conductivity Sensors
• Others
End-users
• CMOs/CROs
• In-house Manufacturers
In addition to the revenue predictions for the overall world market and segments, you will also find revenue forecasts for five regional and 22 leading national markets:
North America
• U.S.
• Canada
Europe
• Germany
• UK
• France
• Italy
• Spain
• Rest of Europe
Asia Pacific
• Japan
• China
• India
• Australia
• South Korea
• Rest of Asia Pacific
Latin America
• Brazil
• Mexico
• Rest of Latin America
MEA
• GCC
• South Africa
• Rest of MEA
The report also includes profiles and for some of the leading companies in the Single-use Bioprocessing Probes & Sensors Market, 2023 to 2033, with a focus on this segment of these companies’ operations.
Leading companies and the potential for market growth
• ABEC
• Broadley-James Corporation
• Avantor, Inc.
• Dover Corporation
• ESI Ultrapure
• Emerson Electric Co.
• Eppendorf AG
• Equflow
• Hamilton Company
• HIGH PURITY NEW ENGLAND
• Malema Engineering Corporation (Dover)
• METTLER TOLEDO
• Parker Hannifin Corporation
• PreSens Precision Sensing GmbH
• PendoTECH
• Sartorius AG
• SONOTEC GmbH
• Thermo Fisher Scientific
Overall world revenue for Single-use Bioprocessing Probes & Sensors Market, 2023 to 2033 in terms of value the market will surpass US$2,812.0 million in 2023, our work calculates. We predict strong revenue growth through to 2033. Our work identifies which organizations hold the greatest potential. Discover their capabilities, progress, and commercial prospects, helping you stay ahead.
How will the Single-use Bioprocessing Probes & Sensors Market, 2023 to 2033 report help you?
In summary, our 240+ page report provides you with the following knowledge:
• Revenue forecasts to 2033 for Single-use Bioprocessing Probes & Sensors Market, 2023 to 2033 Market, with forecasts for workflow, type, and end-users, each forecast at a global and regional level – discover the industry’s prospects, finding the most lucrative places for investments and revenues.
• Revenue forecasts to 2033 for five regional and 22 key national markets – See forecasts for the Single-use Bioprocessing Probes & Sensors Market, 2023 to 2033 market in North America, Europe, Asia-Pacific, Latin America, and MEA. Also forecasted is the market in the US, Canada, Mexico, Brazil, Germany, France, UK, Italy, Spain, Russia, China, India, Japan, and Australia among other prominent economies.
• Prospects for established firms and those seeking to enter the market – including company profiles for 18 of the major companies involved in the Single-use Bioprocessing Probes & Sensors Market, 2023 to 2033.
Find quantitative and qualitative analyses with independent predictions. Receive information that only our report contains, staying informed with invaluable business intelligence.
Information found nowhere else
With our new report, you are less likely to fall behind in knowledge or miss out on opportunities. See how our work could benefit your research, analyses, and decisions. Visiongain’s study is for everybody needing commercial analyses for the Single-use Bioprocessing Probes & Sensors Market, 2023 to 2033, market-leading companies. You will find data, trends and predictions.
ページTOPに戻る
Table of Contents
Table of Contents
1 Report Overview
1.1 Objectives of the Study
1.2 Introduction to Single-use Bioprocessing Probes & Sensors Market
1.3 What This Report Delivers
1.4 Why You Should Read This Report
1.5 Key Questions Answered by This Analytical Report Include:
1.6 Who is This Report For?
1.7 Methodology
1.7.1 Market Definitions
1.7.2 Market Evaluation & Forecasting Methodology
1.7.3 Data Validation
1.7.3.1 Primary Research
1.7.3.2 Secondary Research
1.8 Frequently Asked Questions (FAQs)
1.9 Associated Visiongain Reports
1.10 About Visiongain
2 Executive Summary
3 Market Overview
3.1 Key Findings
3.2 Market Dynamics
3.2.1 Market Driving Factors
3.2.1.1 Increasing Implementation of Single-use Technology (SUT) for Bioproduction
3.2.1.2 Rising Demand for Improved Bioprocess Monitoring
3.2.1.3 Application of SUB in Circumventing Bottlenecks of COVID-19 Vaccine Manufacturing
3.2.1.4 Advancement in Technology
3.2.2 Market Restraining Factors
3.2.2.1 Technical Challenges Related to Use of Single-use Sensors
3.2.2.2 Heat Sterilisation Likely to Restrain Industry Growth
3.2.2.3 High Cost Likely to Hamper Industry Growth
3.2.2.4 Stringent Regulatory Scenarios Anticipated to Challenge Market Growth
3.2.3 Market Opportunities
3.2.3.1 Streamline Processing to Offer Lucrative Opportunities for Market Players
3.2.3.2 Industry 4.0 to Offer Lucrative Growth Prospects
3.2.3.3 Single-use and Autoclave Sensors for Online Culture Monitoring
3.3 COVID-19 Impact Analysis
3.4 Porter’s Five Forces Analysis
3.4.1 Buyer Power
3.4.2 Supplier Power
3.4.3 Competitive Rivalry
3.4.4 Threat of Substitute
3.4.5 Threat of New Entrants
3.5 PEST Analysis
3.5.1 Political Factors
3.5.2 Economic Factors
3.5.3 Social Factors
3.5.4 Technological Factors
4 Single-use Bioprocessing Probes & Sensors Market Analysis by Workflow
4.1 Key Findings
4.2 Workflow Segment: Market Attractiveness Index
4.3 Single-use Bioprocessing Probes & Sensors Market Size Estimation and Forecast by Workflow
4.4 Upstream
4.4.1 Market Forecast by Region, 2023-2033 (US$ Mn, AGR %)
4.4.2 Market Share by Region, 2023 & 2033 (%)
4.5 Downstream
4.5.1 Market Forecast by Region, 2023-2033 (US$ Mn, AGR %)
4.5.2 Market Share by Region, 2023 & 2033 (%)
5 Single-use Bioprocessing Probes & Sensors Market Analysis by Type
5.1 Key Findings
5.2 Type Segment: Market Attractiveness Index
5.3 Single-use Bioprocessing Probes & Sensors Market Size Estimation and Forecast by Type
5.4 Pressure Sensors
5.4.1 Market Forecast by Region, 2023-2033 (US$ Mn, AGR %)
5.4.2 Market Share by Region, 2023 & 2033 (%)
5.5 Temperature Sensors
5.5.1 Market Forecast by Region, 2023-2033 (US$ Mn, AGR %)
5.5.2 Market Share by Region, 2023 & 2033 (%)
5.6 Flow Meters and Sensors
5.6.1 Market Forecast by Region, 2023-2033 (US$ Mn, AGR %)
5.6.2 Market Share by Region, 2023 & 2033 (%)
5.7 pH Sensors
5.7.1 Market Forecast by Region, 2023-2033 (US$ Mn, AGR %)
5.7.2 Market Share by Region, 2023 & 2033 (%)
5.8 Oxygen Sensors
5.8.1 Market Forecast by Region, 2023-2033 (US$ Mn, AGR %)
5.8.2 Market Share by Region, 2023 & 2033 (%)
5.9 Conductivity Sensors
5.9.1 Market Forecast by Region, 2023-2033 (US$ Mn, AGR %)
5.9.2 Market Share by Region, 2023 & 2033 (%)
5.10 Others
5.10.1 Market Forecast by Region, 2023-2033 (US$ Mn, AGR %)
5.10.2 Market Share by Region, 2023 & 2033 (%)
6 Single-use Bioprocessing Probes & Sensors Market Analysis by End-users
6.1 Key Findings
6.2 End-users Segment: Market Attractiveness Index
6.3 Single-use Bioprocessing Probes & Sensors Market Size Estimation and Forecast by End-users
6.4 CMOs/CROs
6.4.1 Market Forecast by Region, 2023-2033 (US$ Mn, AGR %)
6.4.2 Market Share by Region, 2023 & 2033 (%)
6.5 In-house Manufacturers
6.5.1 Market Forecast by Region, 2023-2033 (US$ Mn, AGR %)
6.5.2 Market Share by Region, 2023 & 2033 (%)
7 Single-use Bioprocessing Probes & Sensors Market Analysis by Region
7.1 Key Findings
7.2 Regional Market Size Estimation and Forecast
8 North America Single-use Bioprocessing Probes & Sensors Market Analysis
8.1 Key Findings
8.2 North America Single-use Bioprocessing Probes & Sensors Market Attractiveness Index
8.3 Market Size by Country, 2023, 2028 & 2033 (US$ Mn)
8.4 Market Size Estimation and Forecast by Country, 2023-2033 (US$ Mn)
8.5 Market Size Estimation and Forecast by Workflow, 2023-2033 (US$ Mn)
8.6 Market Size Estimation and Forecast by Type, 2023-2033 (US$ Mn)
8.7 Market Size Estimation and Forecast by End-users, 2023-2033 (US$ Mn)
8.8 U.S. Single-use Bioprocessing Probes & Sensors Market Analysis
8.9 Canada Single-use Bioprocessing Probes & Sensors Market Analysis
9 Europe Single-use Bioprocessing Probes & Sensors Market Analysis
9.1 Key Findings
9.2 Europe Single-use Bioprocessing Probes & Sensors Market Attractiveness Index
9.3 Market Size by Country, 2023, 2028 & 2033 (US$ Mn)
9.4 Market Size Estimation and Forecast by Country, 2023-2033 (US$ Mn)
9.5 Market Size Estimation and Forecast by Workflow, 2023-2033 (US$ Mn)
9.6 Market Size Estimation and Forecast by Type, 2023-2033 (US$ Mn)
9.7 Market Size Estimation and Forecast by End-users, 2023-2033 (US$ Mn)
9.8 Germany Single-use Bioprocessing Probes & Sensors Market Analysis
9.9 UK Single-use Bioprocessing Probes & Sensors Market Analysis
9.10 France Single-use Bioprocessing Probes & Sensors Market Analysis
9.11 Italy Single-use Bioprocessing Probes & Sensors Market Analysis
9.12 Spain Single-use Bioprocessing Probes & Sensors Market Analysis
9.13 Russia Single-use Bioprocessing Probes & Sensors Market Analysis
9.14 Rest of Europe Single-use Bioprocessing Probes & Sensors Market Analysis
10 Asia Pacific Single-use Bioprocessing Probes & Sensors Market Analysis
10.1 Key Findings
10.2 Asia Pacific Single-use Bioprocessing Probes & Sensors Market Attractiveness Index
10.3 Market Size by Country, 2023, 2028 & 2033 (US$ Mn)
10.4 Market Size Estimation and Forecast by Country, 2023-2033 (US$ Mn)
10.5 Market Size Estimation and Forecast by Workflow, 2023-2033 (US$ Mn)
10.6 Market Size Estimation and Forecast by Type, 2023-2033 (US$ Mn)
10.7 Market Size Estimation and Forecast by End-users, 2023-2033 (US$ Mn)
10.8 Japan Single-use Bioprocessing Probes & Sensors Market Analysis
10.9 China Single-use Bioprocessing Probes & Sensors Market Analysis
10.10 India Single-use Bioprocessing Probes & Sensors Market Analysis
10.11 Australia Single-use Bioprocessing Probes & Sensors Market Analysis
10.12 South Korea Single-use Bioprocessing Probes & Sensors Market Analysis
10.13 Rest of Asia Pacific Single-use Bioprocessing Probes & Sensors Market Analysis
11 Latin America Single-use Bioprocessing Probes & Sensors Market Analysis
11.1 Key Findings
11.2 Latin America Single-use Bioprocessing Probes & Sensors Market Attractiveness Index
11.3 Market Size by Country, 2023, 2028 & 2033 (US$ Mn)
11.4 Market Size Estimation and Forecast by Country, 2023-2033 (US$ Mn)
11.5 Market Size Estimation and Forecast by Workflow, 2023-2033 (US$ Mn)
11.6 Market Size Estimation and Forecast by Type, 2023-2033 (US$ Mn)
11.7 Market Size Estimation and Forecast by End-users, 2023-2033 (US$ Mn)
11.8 Brazil Single-use Bioprocessing Probes & Sensors Market Analysis
11.9 Mexico Single-use Bioprocessing Probes & Sensors Market Analysis
11.10 Argentina Single-use Bioprocessing Probes & Sensors Market Analysis
11.11 Rest of Latin America Single-use Bioprocessing Probes & Sensors Market Analysis
12 MEA Single-use Bioprocessing Probes & Sensors Market Analysis
12.1 Key Findings
12.2 MEA Single-use Bioprocessing Probes & Sensors Market Attractiveness Index
12.3 Market Size by Country, 2023, 2028 & 2033 (US$ Mn)
12.4 Market Size Estimation and Forecast by Country, 2023-2033 (US$ Mn)
12.5 Market Size Estimation and Forecast by Workflow, 2023-2033 (US$ Mn)
12.6 Market Size Estimation and Forecast by Type, 2023-2033 (US$ Mn)
12.7 Market Size Estimation and Forecast by End-users, 2023-2033 (US$ Mn)
12.8 GCC Single-use Bioprocessing Probes & Sensors Market Analysis
12.9 South Africa Single-use Bioprocessing Probes & Sensors Market Analysis
12.10 Rest of MEA Single-use Bioprocessing Probes & Sensors Market Analysis
13 Company Profiles
13.1 ABEC
13.1.1 Company Snapshot
13.1.2 Company Overview
13.1.3 Product Benchmarking
13.2 Broadley-James Corporation
13.2.1 Company Snapshot
13.2.2 Company Overview
13.2.3 Product Benchmarking
13.2.4 Strategic Outlook
13.3 Avantor
13.3.1 Company Snapshot
13.3.2 Company Overview
13.3.3 Financial Analysis
13.3.3.1 Net Revenue, 2017-2022
13.3.3.2 Gross Profit, 2017-2022
13.3.4 Product Benchmarking
13.3.5 Strategic Outlook
13.4 Dover Corporation
13.4.1 Company Snapshot
13.4.2 Company Overview
13.4.3 Financial Analysis
13.4.3.1 Net Revenue, 2017-2022
13.4.3.2 Gross Profit, 2017-2022
13.4.4 Product Benchmarking
13.4.5 Strategic Outlook
13.5 ESI Ultrapure
13.5.1 Company Snapshot
13.5.2 Company Overview
13.5.3 Product Benchmarking
13.6 Emerson Electric Co
13.6.1 Company Snapshot
13.6.2 Company Overview
13.6.3 Financial Analysis
13.6.3.1 Net Revenue, 2017-2022
13.6.3.2 Gross Profit, 2017-2022
13.6.4 Product Benchmarking
13.7 Eppendorf AG
13.7.1 Company Snapshot
13.7.2 Company Overview
13.7.3 Product Benchmarking
13.8 Equflow
13.8.1 Company Snapshot
13.8.2 Company Overview
13.8.3 Product Benchmarking
13.9 Hamilton Company
13.9.1 Company Snapshot
13.9.2 Company Overview
13.9.3 Product Benchmarking
13.9.4 Strategic Outlook
13.10 High Purity New England, Inc.
13.10.1 Company Snapshot
13.10.2 Company Overview
13.10.3 Product Benchmarking
13.10.4 Strategic Outlook
13.11 Malema Engineering Corporation (Dover)
13.11.1 Company Snapshot
13.11.2 Company Overview
13.11.3 Product Benchmarking
13.11.4 Strategic Outlook
13.12 METTLER TOLEDO
13.12.1 Company Snapshot
13.12.2 Company Overview
13.12.3 Financial Analysis
13.12.3.1 Net Revenue, 2017-2022
13.12.3.2 R&D Expenses, 2017-2022
13.12.3.3 Gross Profit, 2017-2022
13.12.4 Product Benchmarking
13.13 Parker Hannifin Corporation
13.13.1 Company Snapshot
13.13.2 Company Overview
13.13.3 Financial Analysis
13.13.3.1 Net Revenue, 2017-2022
13.13.3.2 Gross Profit, 2017-2022
13.13.4 Product Benchmarking
13.14 PreSens Precision Sensing GmbH
13.14.1 Company Snapshot
13.14.2 Company Overview
13.14.3 Product Benchmarking
13.15 PendoTECH LLC
13.15.1 Company Snapshot
13.15.2 Company Overview
13.15.3 Product Benchmarking
13.16 Sartorius AG
13.16.1 Company Snapshot
13.16.2 Company Overview
13.16.3 Financial Analysis
13.16.3.1 Net Revenue, 2017-2021
13.16.3.2 R&D Expenses, 2017-2021
13.16.3.3 Gross Profit, 2017-2021
13.16.4 Product Benchmarking
13.16.5 Strategic Outlook
13.17 SONOTEC GmbH
13.17.1 Company Snapshot
13.17.2 Company Overview
13.17.3 Product Benchmarking
13.18 Thermo Fisher Scientific
13.18.1 Company Snapshot
13.18.2 Company Overview
13.18.3 Financial Analysis
13.18.3.1 Net Revenue, 2017-2022
13.18.3.2 R&D Expenses, 2017-2022
13.18.3.3 Gross Profit, 2017-2022
13.18.4 Product Benchmarking
14 Conclusion and Recommendations
14.1 Concluding Remarks from Visiongain
14.2 Recommendations for Market Players
ページTOPに戻る
List of Tables/Graphs
List of Tables
Table 1 Single-use Bioprocessing Probes & Sensors Market Snapshot, 2023 & 2033 (US$ Million, CAGR %)
Table 2 Single-use Bioprocessing Probes & Sensors Market Forecast by Region, 2023-2033 (US$ Million, AGR%, CAGR%): "V" Shaped Recovery
Table 3 Single-use Bioprocessing Probes & Sensors Market Forecast by Region, 2023-2033 (US$ Million, AGR%, CAGR%): "U" Shaped Recovery
Table 4 Single-use Bioprocessing Probes & Sensors Market Forecast by Region, 2023-2033 (US$ Million, AGR%, CAGR%): "W" Shaped Recovery
Table 5 Single-use Bioprocessing Probes & Sensors Market Forecast by Region, 2023-2033 (US$ Million, AGR%, CAGR%): "L" Shaped Recovery
Table 6 Single-use Bioprocessing Probes & Sensors Market Forecast by Workflow, 2023-2033 (US$ Million, AGR%, CAGR%)
Table 7 Upstream Segment Market Forecast by Region, 2023-2033 (US$ Million, AGR%, CAGR%)
Table 8 Downstream Segment Market Forecast by Region, 2023-2033 (US$ Million, AGR%, CAGR%)
Table 9 Single-use Bioprocessing Probes & Sensors Market Forecast by Type, 2023-2033 (US$ Million, AGR%, CAGR%)
Table 10 Pressure Sensors Segment Market Forecast by Region, 2023-2033 (US$ Million, AGR%, CAGR%)
Table 11 Temperature Sensors Segment Market Forecast by Region, 2023-2033 (US$ Million, AGR%, CAGR%)
Table 12 Flow Meters and Sensors Segment Market Forecast by Region, 2023-2033 (US$ Million, AGR%, CAGR%)
Table 13 pH Sensors Segment Market Forecast by Region, 2023-2033 (US$ Million, AGR%, CAGR%)
Table 14 Oxygen Sensors Segment Market Forecast by Region, 2023-2033 (US$ Million, AGR%, CAGR%)
Table 15 Conductivity Sensors Segment Market Forecast by Region, 2023-2033 (US$ Million, AGR%, CAGR%)
Table 16 Others Segment Market Forecast by Region, 2023-2033 (US$ Million, AGR%, CAGR%)
Table 17 CMOs/CROs Segment Market Forecast by Region, 2023-2033 (US$ Million, AGR%, CAGR%)
Table 18 In-house Manufacturers Segment Market Forecast by Region, 2023-2033 (US$ Million, AGR%, CAGR%)
Table 19 Single-use Bioprocessing Probes & Sensors Market Forecast by Region, 2023-2033 (US$ Million, AGR%, CAGR%)
Table 20 North America Single-use Bioprocessing Probes & Sensors Market Forecast by Country, 2023-2033 (US$ Million, AGR%, CAGR%)
Table 21 North America Single-use Bioprocessing Probes & Sensors Market Forecast by Workflow, 2023-2033 (US$ Million, AGR%, CAGR%)
Table 22 North America Single-use Bioprocessing Probes & Sensors Market Forecast by Type, 2023-2033 (US$ Million, AGR%, CAGR%)
Table 23 North America Single-use Bioprocessing Probes & Sensors Market Forecast by End-use, 2023-2033 (US$ Million, AGR%, CAGR%)
Table 24 U.S. Single-use Bioprocessing Probes & Sensors Market Forecast, 2023-2033 (US$ Million, AGR%, CAGR%)
Table 25 Canada Single-use Bioprocessing Probes & Sensors Market Forecast, 2023-2033 (US$ Million, AGR%, CAGR%)
Table 26 Europe Single-use Bioprocessing Probes & Sensors Market Forecast by Country, 2023-2033 (US$ Million, AGR%, CAGR%)
Table 27 Europe Single-use Bioprocessing Probes & Sensors Market Forecast by Workflow, 2023-2033 (US$ Million, AGR%, CAGR%)
Table 28 Europe Single-use Bioprocessing Probes & Sensors Market Forecast by Type, 2023-2033 (US$ Million, AGR%, CAGR%)
Table 29 Europe Single-use Bioprocessing Probes & Sensors Market Forecast by End-use, 2023-2033 (US$ Million, AGR%, CAGR%)
Table 30 Germany Single-use Bioprocessing Probes & Sensors Market Forecast, 2023-2033 (US$ Million, AGR%, CAGR%)
Table 31 UK Single-use Bioprocessing Probes & Sensors Market Forecast, 2023-2033 (US$ Million, AGR%, CAGR%)
Table 32 France Single-use Bioprocessing Probes & Sensors Market Forecast, 2023-2033 (US$ Million, AGR%, CAGR%)
Table 33 Italy Single-use Bioprocessing Probes & Sensors Market Forecast, 2023-2033 (US$ Million, AGR%, CAGR%)
Table 34 Spain Single-use Bioprocessing Probes & Sensors Market Forecast, 2023-2033 (US$ Million, AGR%, CAGR%)
Table 35 Russia Single-use Bioprocessing Probes & Sensors Market Forecast, 2023-2033 (US$ Million, AGR%, CAGR%)
Table 36 Rest of Europe Single-use Bioprocessing Probes & Sensors Market Forecast, 2023-2033 (US$ Million, AGR%, CAGR%)
Table 37 Asia Pacific Single-use Bioprocessing Probes & Sensors Market Forecast by Country, 2023-2033 (US$ Million, AGR%, CAGR%)
Table 38 Asia Pacific Single-use Bioprocessing Probes & Sensors Market Forecast by Workflow, 2023-2033 (US$ Million, AGR%, CAGR%)
Table 39 Asia Pacific Single-use Bioprocessing Probes & Sensors Market Forecast by Type, 2023-2033 (US$ Million, AGR%, CAGR%)
Table 40 Asia Pacific Single-use Bioprocessing Probes & Sensors Market Forecast by End-use, 2023-2033 (US$ Million, AGR%, CAGR%)
Table 41 Japan Single-use Bioprocessing Probes & Sensors Market Forecast, 2023-2033 (US$ Million, AGR%, CAGR%)
Table 42 China Single-use Bioprocessing Probes & Sensors Market Forecast, 2023-2033 (US$ Million, AGR%, CAGR%)
Table 43 India Single-use Bioprocessing Probes & Sensors Market Forecast, 2023-2033 (US$ Million, AGR%, CAGR%)
Table 44 Australia Single-use Bioprocessing Probes & Sensors Market Forecast, 2023-2033 (US$ Million, AGR%, CAGR%)
Table 45 South Korea Single-use Bioprocessing Probes & Sensors Market Forecast, 2023-2033 (US$ Million, AGR%, CAGR%)
Table 46 Rest of Asia Pacific Single-use Bioprocessing Probes & Sensors Market Forecast, 2023-2033 (US$ Million, AGR%, CAGR%)
Table 47 Latin America Single-use Bioprocessing Probes & Sensors Market Forecast by Country, 2023-2033 (US$ Million, AGR%, CAGR%)
Table 48 Latin America Single-use Bioprocessing Probes & Sensors Market Forecast by Workflow, 2023-2033 (US$ Million, AGR%, CAGR%)
Table 49 Latin America Single-use Bioprocessing Probes & Sensors Market Forecast by Type, 2023-2033 (US$ Million, AGR%, CAGR%)
Table 50 Latin America Single-use Bioprocessing Probes & Sensors Market Forecast by End-use, 2023-2033 (US$ Million, AGR%, CAGR%)
Table 51 Brazil Single-use Bioprocessing Probes & Sensors Market Forecast, 2023-2033 (US$ Million, AGR%, CAGR%)
Table 52 Mexico Single-use Bioprocessing Probes & Sensors Market Forecast, 2023-2033 (US$ Million, AGR%, CAGR%)
Table 53 Argentina Single-use Bioprocessing Probes & Sensors Market Forecast, 2023-2033 (US$ Million, AGR%, CAGR%)
Table 54 Rest of Latin America Single-use Bioprocessing Probes & Sensors Market Forecast, 2023-2033 (US$ Million, AGR%, CAGR%)
Table 55 MEA Single-use Bioprocessing Probes & Sensors Market Forecast by Country, 2023-2033 (US$ Million, AGR%, CAGR%)
Table 56 MEA Single-use Bioprocessing Probes & Sensors Market Forecast by Workflow, 2023-2033 (US$ Million, AGR%, CAGR%)
Table 57 MEA Single-use Bioprocessing Probes & Sensors Market Forecast by Type, 2023-2033 (US$ Million, AGR%, CAGR%)
Table 58 MEA Single-use Bioprocessing Probes & Sensors Market Forecast by End-use, 2023-2033 (US$ Million, AGR%, CAGR%)
Table 59 GCC Single-use Bioprocessing Probes & Sensors Market Forecast, 2023-2033 (US$ Million, AGR%, CAGR%)
Table 60 South Africa Single-use Bioprocessing Probes & Sensors Market Forecast, 2023-2033 (US$ Million, AGR%, CAGR%)
Table 61 Rest of MEA Single-use Bioprocessing Probes & Sensors Market Forecast, 2023-2033 (US$ Million, AGR%, CAGR%)
Table 62 ABEC: Key Details, (CEO, HQ, Revenue, Founded, No. of Employees, Company Type, Website, Business Segment)
Table 63 ABEC: Product Benchmarking
Table 64 Broadley-James Corporation: Key Details, (CEO, HQ, Revenue, Founded, No. of Employees, Company Type, Website, Business Segment)
Table 65 Broadley-James Corporation: Product Benchmarking
Table 66 Broadley-James Corporation: Strategic Outlook
Table 67 Avantor: Key Details, (CEO, HQ, Revenue, Founded, No. of Employees, Company Type, Website, Business Segment)
Table 68 Avantor: Product Benchmarking
Table 69 Avantor: Strategic Outlook
Table 70 Dover Corporation: Key Details, (CEO, HQ, Revenue, Founded, No. of Employees, Company Type, Website, Business Segment)
Table 71 Dover Corporation: Product Benchmarking
Table 72 Dover Corporation: Strategic Outlook
Table 73 ESI Ultrapure: Key Details, (CEO, HQ, Revenue, Founded, No. of Employees, Company Type, Website, Business Segment)
Table 74 ESI Ultrapure: Product Benchmarking
Table 75 Emerson Electric Co: Key Details, (CEO, HQ, Revenue, Founded, No. of Employees, Company Type, Website, Business Segment)
Table 76 Emerson Electric Co: Product Benchmarking
Table 77 Eppendorf AG: Key Details, (CEO, HQ, Revenue, Founded, No. of Employees, Company Type, Website, Business Segment)
Table 78 Eppendorf AG: Product Benchmarking
Table 79 Equflow: Key Details, (CEO, HQ, Revenue, Founded, No. of Employees, Company Type, Website, Business Segment)
Table 80 Equflow: Product Benchmarking
Table 81 Hamilton Company: Key Details, (CEO, HQ, Revenue, Founded, No. of Employees, Company Type, Website, Business Segment)
Table 82 Hamilton Company: Product Benchmarking
Table 83 Hamilton Company: Strategic Outlook
Table 84 High Purity New England, Inc.: Key Details, (CEO, HQ, Revenue, Founded, No. of Employees, Company Type, Website, Business Segment)
Table 85 High Purity New England, Inc.: Product Benchmarking
Table 86 High Purity New England, Inc.: Strategic Outlook
Table 87 Malema Engineering Corporation: Key Details, (CEO, HQ, Revenue, Founded, No. of Employees, Company Type, Website, Business Segment)
Table 88 Malema Engineering Corporation: Product Benchmarking
Table 89 Malema Engineering Corporation: Strategic Outlook
Table 90 METTLER TOLEDO: Key Details, (CEO, HQ, Revenue, Founded, No. of Employees, Company Type, Website, Business Segment)
Table 91 METTLER TOLEDO: Product Benchmarking
Table 92 Parker Hannifin Corporation: Key Details, (CEO, HQ, Revenue, Founded, No. of Employees, Company Type, Website, Business Segment)
Table 93 Parker Hannifin Corporation: Product Benchmarking
Table 94 PreSens Precision Sensing GmbH: Key Details, (CEO, HQ, Revenue, Founded, No. of Employees, Company Type, Website, Business Segment)
Table 95 PreSens Precision Sensing GmbH: Product Benchmarking
Table 96 PendoTECH LLC: Key Details, (CEO, HQ, Revenue, Founded, No. of Employees, Company Type, Website, Business Segment)
Table 97 PendoTECH LLC: Product Benchmarking
Table 98 Sartorius AG: Key Details, (CEO, HQ, Revenue, Founded, No. of Employees, Company Type, Website, Business Segment)
Table 99 Sartorius AG: Product Benchmarking
Table 100 Sartorius AG: Strategic Outlook
Table 101 SONOTEC GmbH: Key Details, (CEO, HQ, Revenue, Founded, No. of Employees, Company Type, Website, Business Segment)
Table 102 SONOTEC GmbH: Product Benchmarking
Table 103 Thermo Fisher Scientific: Key Details, (CEO, HQ, Revenue, Founded, No. of Employees, Company Type, Website, Business Segment)
Table 104 Thermo Fisher Scientific: Product Benchmarking
List of Figures
Figure 1 Single-use Bioprocessing Probes & Sensors Market Segmentation
Figure 2 Single-use Bioprocessing Probes & Sensors Market by Workflow: Market Attractiveness Index
Figure 3 Single-use Bioprocessing Probes & Sensors Market by Type: Market Attractiveness Index
Figure 4 Single-use Bioprocessing Probes & Sensors Market by End-users: Market Attractiveness Index
Figure 5 Single-use Bioprocessing Probes & Sensors Market Attractiveness Index by Region
Figure 6 Single-use Bioprocessing Probes & Sensors Market: Market Dynamics
Figure 7 Single-use Bioprocessing Probes & Sensors Market by Region, 2023-2033 (US$ Mn, AGR %): “V” Shaped Recovery
Figure 8 Single-use Bioprocessing Probes & Sensors Market by Region, 2023-2033 (US$ Mn, AGR %): “U” Shaped Recovery
Figure 9 Single-use Bioprocessing Probes & Sensors Market by Region, 2023-2033 (US$ Mn, AGR %): “W” Shaped Recovery
Figure 10 Single-use Bioprocessing Probes & Sensors Market by Region, 2023-2033 (US$ Mn, AGR %): “L” Shaped Recovery
Figure 11 Porter’s Analysis
Figure 12 PEST Analysis
Figure 13 Single-use Bioprocessing Probes & Sensors Market Attractiveness Index by Workflow
Figure 14 Single-use Bioprocessing Probes & Sensors Market Forecast by Workflow, 2023-2033 (US$ Million, AGR %)
Figure 15 Single-use Bioprocessing Probes & Sensors Market Share Forecast by Workflow, 2023, 2028, 2033 (%)
Figure 16 Upstream Segment Market Forecast by Region, 2023-2033 (US$ Million, AGR %)
Figure 17 Upstream Segment Market Share Forecast by Region, 2023 & 2033 (%)
Figure 18 Downstream Segment Market Forecast by Region, 2023-2033 (US$ Million, AGR %)
Figure 19 Downstream Segment Market Share Forecast by Region, 2023 & 2033 (%)
Figure 20 Single-use Bioprocessing Probes & Sensors Market Attractiveness Index by Workflow
Figure 21 Single-use Bioprocessing Probes & Sensors Market Forecast by Type, 2023-2033 (US$ Million, AGR %)
Figure 22 Single-use Bioprocessing Probes & Sensors Market Share Forecast by Type, 2023, 2028, 2033 (%)
Figure 23 Pressure Sensors Segment Market Forecast by Region, 2023-2033 (US$ Million, AGR %)
Figure 24 Pressure Sensors Segment Market Share Forecast by Region, 2023 & 2033 (%)
Figure 25 Temperature Sensors Segment Market Forecast by Region, 2023-2033 (US$ Million, AGR %)
Figure 26 Temperature Sensors Segment Market Share Forecast by Region, 2023 & 2033 (%)
Figure 27 Flow Meters and Sensors Segment Market Forecast by Region, 2023-2033 (US$ Million, AGR %)
Figure 28 Flow Meters and Sensors Segment Market Share Forecast by Region, 2023 & 2033 (%)
Figure 29 pH Sensors Segment Market Forecast by Region, 2023-2033 (US$ Million, AGR %)
Figure 30 pH Sensors Segment Market Share Forecast by Region, 2023 & 2033 (%)
Figure 31 Oxygen Sensors Segment Market Forecast by Region, 2023-2033 (US$ Million, AGR %)
Figure 32 Oxygen Sensors Segment Market Share Forecast by Region, 2023 & 2033 (%)
Figure 33 Conductivity Sensors Segment Market Forecast by Region, 2023-2033 (US$ Million, AGR %)
Figure 34 Conductivity Sensors Segment Market Share Forecast by Region, 2023 & 2033 (%)
Figure 35 Others Segment Market Forecast by Region, 2023-2033 (US$ Million, AGR %)
Figure 36 Others Segment Market Share Forecast by Region, 2023 & 2033 (%)
Figure 37 Single-use Bioprocessing Probes & Sensors Market Attractiveness Index by End-users
Figure 38 Single-use Bioprocessing Probes & Sensors Market Forecast by End-users, 2023-2033 (US$ Million, AGR %)
Figure 39 Single-use Bioprocessing Probes & Sensors Market Share Forecast by End-users, 2023, 2028, 2033 (%)
Figure 40 CMOs/CROs Segment Market Forecast by Region, 2023-2033 (US$ Million, AGR %)
Figure 41 CMOs/CROs Segment Market Share Forecast by Region, 2023 & 2033 (%)
Figure 42 In-house Manufacturers Segment Market Forecast by Region, 2023-2033 (US$ Million, AGR %)
Figure 43 In-house Manufacturers Segment Market Share Forecast by Region, 2023 & 2033 (%)
Figure 44 Single-use Bioprocessing Probes & Sensors Market Forecast by Region 2023, 2028, 2033 (Revenue, CAGR%)
Figure 45 Single-use Bioprocessing Probes & Sensors Market Share Forecast by Region 2023, 2028, 2033 (%)
Figure 46 Single-use Bioprocessing Probes & Sensors Market by Region, 2023-2033 (US$ Mn)
Figure 47 North America Single-use Bioprocessing Probes & Sensors Market Attractiveness Index
Figure 48 North America Single-use Bioprocessing Probes & Sensors Market by Region, 2023, 2028 & 2033 (US$ Million)
Figure 49 North America Single-use Bioprocessing Probes & Sensors Market Forecast by Country, 2023-2033 (US$ Million)
Figure 50 North America Single-use Bioprocessing Probes & Sensors Market Share Forecast by Country, 2023 & 2033 (%)
Figure 51 North America Single-use Bioprocessing Probes & Sensors Market Forecast by Workflow, 2023-2033 (US$ Million, AGR %)
Figure 52 North America Single-use Bioprocessing Probes & Sensors Market Share Forecast by Workflow, 2023 & 2033 (%)
Figure 53 North America Single-use Bioprocessing Probes & Sensors Market Forecast by Type, 2023-2033 (US$ Million, AGR %)
Figure 54 North America Single-use Bioprocessing Probes & Sensors Market Share Forecast by Type, 2023 & 2033 (%)
Figure 55 North America Single-use Bioprocessing Probes & Sensors Market Forecast by End-users, 2023-2033 (US$ Million, AGR %)
Figure 56 North America Single-use Bioprocessing Probes & Sensors Market Share Forecast by End-users, 2023 & 2033 (%)
Figure 57 U.S. Single-use Bioprocessing Probes & Sensors Market Forecast, 2023-2033 (US$ Million, AGR %)
Figure 58 Canada Single-use Bioprocessing Probes & Sensors Market Forecast, 2023-2033 (US$ Million, AGR %)
Figure 59 Europe Single-use Bioprocessing Probes & Sensors Market Attractiveness Index
Figure 60 Europe Single-use Bioprocessing Probes & Sensors Market by Region, 2023, 2028 & 2033 (US$ Million)
Figure 61 Europe Single-use Bioprocessing Probes & Sensors Market Forecast by Country, 2023-2033 (US$ Million)
Figure 62 Europe Single-use Bioprocessing Probes & Sensors Market Share Forecast by Country, 2023 & 2033 (%)
Figure 63 Europe Single-use Bioprocessing Probes & Sensors Market Forecast by Workflow, 2023-2033 (US$ Million, AGR %)
Figure 64 Europe Single-use Bioprocessing Probes & Sensors Market Share Forecast by Workflow, 2023 & 2033 (%)
Figure 65 Europe Single-use Bioprocessing Probes & Sensors Market Forecast by Type, 2023-2033 (US$ Million, AGR %)
Figure 66 Europe Single-use Bioprocessing Probes & Sensors Market Share Forecast by Type, 2023 & 2033 (%)
Figure 67 Europe Single-use Bioprocessing Probes & Sensors Market Forecast by End-users, 2023-2033 (US$ Million, AGR %)
Figure 68 Europe Single-use Bioprocessing Probes & Sensors Market Share Forecast by End-users, 2023 & 2033 (%)
Figure 69 Germany Single-use Bioprocessing Probes & Sensors Market Forecast, 2023-2033 (US$ Million, AGR %)
Figure 70 UK Single-use Bioprocessing Probes & Sensors Market Forecast, 2023-2033 (US$ Million, AGR %)
Figure 71 France Single-use Bioprocessing Probes & Sensors Market Forecast, 2023-2033 (US$ Million, AGR %)
Figure 72 Italy Single-use Bioprocessing Probes & Sensors Market Forecast, 2023-2033 (US$ Million, AGR %)
Figure 73 Spain Single-use Bioprocessing Probes & Sensors Market Forecast, 2023-2033 (US$ Million, AGR %)
Figure 74 Russia Single-use Bioprocessing Probes & Sensors Market Forecast, 2023-2033 (US$ Million, AGR %)
Figure 75 Rest of Europe Single-use Bioprocessing Probes & Sensors Market Forecast, 2023-2033 (US$ Million, AGR %)
Figure 76 Asia Pacific Single-use Bioprocessing Probes & Sensors Market Attractiveness Index
Figure 77 Asia Pacific Single-use Bioprocessing Probes & Sensors Market by Region, 2023, 2028 & 2033 (US$ Million)
Figure 78 Asia Pacific Single-use Bioprocessing Probes & Sensors Market Forecast by Country, 2023-2033 (US$ Million)
Figure 79 Asia Pacific Single-use Bioprocessing Probes & Sensors Market Share Forecast by Country, 2023 & 2033 (%)
Figure 80 Asia Pacific Single-use Bioprocessing Probes & Sensors Market Forecast by Workflow, 2023-2033 (US$ Million, AGR %)
Figure 81 Asia Pacific Single-use Bioprocessing Probes & Sensors Market Share Forecast by Workflow, 2023 & 2033 (%)
Figure 82 Asia Pacific Single-use Bioprocessing Probes & Sensors Market Forecast by Type, 2023-2033 (US$ Million, AGR %)
Figure 83 Asia Pacific Single-use Bioprocessing Probes & Sensors Market Share Forecast by Type, 2023 & 2033 (%)
Figure 84 Asia Pacific Single-use Bioprocessing Probes & Sensors Market Forecast by End-users, 2023-2033 (US$ Million, AGR %)
Figure 85 Asia Pacific Single-use Bioprocessing Probes & Sensors Market Share Forecast by End-users, 2023 & 2033 (%)
Figure 86 Japan Single-use Bioprocessing Probes & Sensors Market Forecast, 2023-2033 (US$ Million, AGR %)
Figure 87 China Single-use Bioprocessing Probes & Sensors Market Forecast, 2023-2033 (US$ Million, AGR %)
Figure 88 India Single-use Bioprocessing Probes & Sensors Market Forecast, 2023-2033 (US$ Million, AGR %)
Figure 89 Australia Single-use Bioprocessing Probes & Sensors Market Forecast, 2023-2033 (US$ Million, AGR %)
Figure 90 South Korea Single-use Bioprocessing Probes & Sensors Market Forecast, 2023-2033 (US$ Million, AGR %)
Figure 91 Rest of Asia Pacific Single-use Bioprocessing Probes & Sensors Market Forecast, 2023-2033 (US$ Million, AGR %)
Figure 92 Latin America Single-use Bioprocessing Probes & Sensors Market Attractiveness Index
Figure 93 Latin America Single-use Bioprocessing Probes & Sensors Market by Region, 2023, 2028 & 2033 (US$ Million)
Figure 94 Latin America Single-use Bioprocessing Probes & Sensors Market Forecast by Country, 2023-2033 (US$ Million)
Figure 95 Latin America Single-use Bioprocessing Probes & Sensors Market Share Forecast by Country, 2023 & 2033 (%)
Figure 96 Latin America Single-use Bioprocessing Probes & Sensors Market Forecast by Workflow, 2023-2033 (US$ Million, AGR %)
Figure 97 Latin America Single-use Bioprocessing Probes & Sensors Market Share Forecast by Workflow, 2023 & 2033 (%)
Figure 98 Latin America Single-use Bioprocessing Probes & Sensors Market Forecast by Type, 2023-2033 (US$ Million, AGR %)
Figure 99 Latin America Single-use Bioprocessing Probes & Sensors Market Share Forecast by Type, 2023 & 2033 (%)
Figure 100 Latin America Single-use Bioprocessing Probes & Sensors Market Forecast by End-users, 2023-2033 (US$ Million, AGR %)
Figure 101 Latin America Single-use Bioprocessing Probes & Sensors Market Share Forecast by End-users, 2023 & 2033 (%)
Figure 102 Brazil Single-use Bioprocessing Probes & Sensors Market Forecast, 2023-2033 (US$ Million, AGR %)
Figure 103 Mexico Single-use Bioprocessing Probes & Sensors Market Forecast, 2023-2033 (US$ Million, AGR %)
Figure 104 Argentina Single-use Bioprocessing Probes & Sensors Market Forecast, 2023-2033 (US$ Million, AGR %)
Figure 105 Rest of Latin America Single-use Bioprocessing Probes & Sensors Market Forecast, 2023-2033 (US$ Million, AGR %)
Figure 106 MEA Single-use Bioprocessing Probes & Sensors Market Attractiveness Index
Figure 107 MEA Single-use Bioprocessing Probes & Sensors Market by Region, 2023, 2028 & 2033 (US$ Million)
Figure 108 MEA Single-use Bioprocessing Probes & Sensors Market Forecast by Country, 2023-2033 (US$ Million)
Figure 109 MEA Single-use Bioprocessing Probes & Sensors Market Share Forecast by Country, 2023 & 2033 (%)
Figure 110 MEA Single-use Bioprocessing Probes & Sensors Market Forecast by Workflow, 2023-2033 (US$ Million, AGR %)
Figure 111 MEA Single-use Bioprocessing Probes & Sensors Market Share Forecast by Workflow, 2023 & 2033 (%)
Figure 112 MEA Single-use Bioprocessing Probes & Sensors Market Forecast by Type, 2023-2033 (US$ Million, AGR %)
Figure 113 MEA Single-use Bioprocessing Probes & Sensors Market Share Forecast by Type, 2023 & 2033 (%)
Figure 114 MEA Single-use Bioprocessing Probes & Sensors Market Forecast by End-users, 2023-2033 (US$ Million, AGR %)
Figure 115 MEA Single-use Bioprocessing Probes & Sensors Market Share Forecast by End-users, 2023 & 2033 (%)
Figure 116 GCC Single-use Bioprocessing Probes & Sensors Market Forecast, 2023-2033 (US$ Million, AGR %)
Figure 117 South Africa Single-use Bioprocessing Probes & Sensors Market Forecast, 2023-2033 (US$ Million, AGR %)
Figure 118 Rest of MEA Single-use Bioprocessing Probes & Sensors Market Forecast, 2023-2033 (US$ Million, AGR %)
Figure 119 Avantor: Net Revenue, 2017-2022 (US$ Million, AGR%)
Figure 120 Avantor: Gross Profit, 2017-2022 (US$ Million, AGR%)
Figure 121 Dover Corporation: Net Revenue, 2017-2022 (US$ Million, AGR%)
Figure 122 Dover Corporation: Gross Profit, 2017-2022 (US$ Million, AGR%)
Figure 123 Emerson Electric Co: Net Revenue, 2017-2022 (US$ Million, AGR%)
Figure 124 Emerson Electric Co: Gross Profit, 2017-2022 (US$ Million, AGR%)
Figure 125 METTLER TOLEDO: Net Revenue, 2017-2022 (US$ Million, AGR%)
Figure 126 METTLER TOLEDO: R&D Expenses, 2017-2022 (US$ Million, AGR%)
Figure 127 METTLER TOLEDO: Gross Profit, 2017-2022 (US$ Million, AGR%)
Figure 128 Parker Hannifin Corporation: Net Revenue, 2017-2022 (US$ Million, AGR%)
Figure 129 Parker Hannifin Corporation: Gross Profit, 2017-2022 (US$ Million, AGR%)
Figure 130 Sartorius AG: Net Revenue, 2017-2021 (US$ Million, AGR%)
Figure 131 Sartorius AG: R&D Expenses, 2017-2021 (US$ Million, AGR%)
Figure 132 Sartorius AG: Gross Profit, 2017-2021 (US$ Million, AGR%)
Figure 133 Thermo Fisher Scientific: Net Revenue, 2017-2022 (US$ Million, AGR%)
Figure 134 Thermo Fisher Scientific: R&D Expenses, 2017-2022 (US$ Million, AGR%)
Figure 135 Thermo Fisher Scientific: Gross Profit, 2017-2022 (US$ Million, AGR%)
ページTOPに戻る
Visiongain社のヘルスケアと医薬・化学品分野での最新刊レポート
本レポートと同じKEY WORD()の最新刊レポート
- 本レポートと同じKEY WORDの最新刊レポートはありません。
よくあるご質問
Visiongain社はどのような調査会社ですか?
英国の調査会社ヴィジョンゲイン社(Visiongain)は、通信とエネルギーのほか、自動車や化学・医薬品、金属など、広範な市場を対象に調査を行っています。自動車市場については、市場全般に関する調査のほ... もっと見る
調査レポートの納品までの日数はどの程度ですか?
在庫のあるものは速納となりますが、平均的には 3-4日と見て下さい。
但し、一部の調査レポートでは、発注を受けた段階で内容更新をして納品をする場合もあります。
発注をする前のお問合せをお願いします。
注文の手続きはどのようになっていますか?
1)お客様からの御問い合わせをいただきます。
2)見積書やサンプルの提示をいたします。
3)お客様指定、もしくは弊社の発注書をメール添付にて発送してください。
4)データリソース社からレポート発行元の調査会社へ納品手配します。
5) 調査会社からお客様へ納品されます。最近は、pdfにてのメール納品が大半です。
お支払方法の方法はどのようになっていますか?
納品と同時にデータリソース社よりお客様へ請求書(必要に応じて納品書も)を発送いたします。
お客様よりデータリソース社へ(通常は円払い)の御振り込みをお願いします。
請求書は、納品日の日付で発行しますので、翌月最終営業日までの当社指定口座への振込みをお願いします。振込み手数料は御社負担にてお願いします。
お客様の御支払い条件が60日以上の場合は御相談ください。
尚、初めてのお取引先や個人の場合、前払いをお願いすることもあります。ご了承のほど、お願いします。
データリソース社はどのような会社ですか?
当社は、世界各国の主要調査会社・レポート出版社と提携し、世界各国の市場調査レポートや技術動向レポートなどを日本国内の企業・公官庁及び教育研究機関に提供しております。
世界各国の「市場・技術・法規制などの」実情を調査・収集される時には、データリソース社にご相談ください。
お客様の御要望にあったデータや情報を抽出する為のレポート紹介や調査のアドバイスも致します。
|
|

