グリッドスケール定置型蓄電池市場レポート:2023-2033
Grid Scale Stationary Battery Storage Market Report 2023-2033
レポート詳細
グリッドスケール定置型蓄電池市場レポート 2023-2033 : 本レポートは、業界とその基礎となる力学をよりよく理解したい場合、新たな収益ポケットを目指す大手企業にとって貴重なものと... もっと見る
※上記価格は部署ライセンス(Departmental licence)価格です。
その他の価格についてはデータリソースまでお問合せください。
日本語のページは自動翻訳を利用し作成しています。
実際のレポートは英文のみでご納品いたします。

|

|
サマリー
レポート詳細
グリッドスケール定置型蓄電池市場レポート 2023-2033: 本レポートは、業界とその基礎となる力学をよりよく理解したい場合、新たな収益ポケットを目指す大手企業にとって貴重なものとなります。異業種への進出や新地域での既存事業の拡大を希望する企業にとっても有益なレポートです。
グリッドスケール蓄電池市場は近年目覚ましい成長を遂げている
グリッドスケール蓄電池市場は、近年著しい成長を遂げており、今後も拡大が見込まれます。再生可能エネルギーへの需要の高まりと電池技術の進歩により、大規模な電池貯蔵システムは、グリッドの安定性と信頼性を高める費用対効果の高いソリューションとなりました。
グリッドスケールのバッテリーストレージシステムの導入は、化石燃料への依存度の低減、グリッドの柔軟性と回復力の向上、エネルギーコストの削減など、いくつかの利点があります。さらに、電気自動車の普及により、使用済みの電気自動車用バッテリーを定置用エネルギー貯蔵アプリケーションに再利用する、セカンドライフ・バッテリーの新しい市場も生まれています。
政府の政策や規制、技術の進歩、コストの低下など、さまざまな要因がグリッドスケール蓄電池市場の成長を促しています。しかし、初期コストの高さ、技術的な成熟度の低さ、規制の壁など、市場は依然として課題を抱えています。
長期的には、再生可能エネルギーの普及拡大、バッテリーコストの低下、有利な政府政策などを背景に、グリッドスケールのバッテリーストレージ市場は大きな成長を遂げると予想されます。このため、よりクリーンで持続可能なエネルギーへの移行を目指す投資家、電池メーカー、エネルギー企業にとって、この市場は大きなチャンスとなります。
マーケットリサーチレポートを購入する前に、どのような質問をするべきか?
- グリッドスケール定置型蓄電池市場はどのように進化しているのか?
- グリッドスケール定置型蓄電池市場の推進要因と抑制要因は何か?
- グリッドスケール定置型蓄電池の各サブマーケットセグメントは予測期間中にどのように成長し、2033年にこれらのサブマーケットが占める売上高はどの程度になるのか?
- 2023年から2033年にかけて、グリッドスケール定置型蓄電池の各サブマーケットの市場シェアはどのように推移していくのか?
- 2023年から2033年にかけて、市場全体の主な牽引役となるのは何か?
- グリッドスケール定置型蓄電池の主要市場は、マクロ経済ダイナミクスに幅広く追随するのか、それとも個々の国別市場が他を凌駕するのか?
- 2033年までに各国市場の市場シェアはどのように変化し、2033年に市場をリードするのはどの地域か?
- 主要プレイヤーは誰で、予測期間中の見通しは?
- これらの主要企業のグリッドスケール定置型蓄電池プロジェクトはどのようなものか?
- 2023年から2033年の間に、業界はどのように進化していくのか?現在および今後10年間に行われるグリッドスケール定置型蓄電池のプロジェクトにはどのような意味があるのか?
- グリッドスケール定置型蓄電池市場をさらに拡大させるために、製品の商業化の必要性は高いか?
- グリッドスケール定置型蓄電池市場の方向性と、市場の最前線に立つためにはどうすればよいか?
- 新製品やサービスラインに対する最適な投資オプションは何か?
- 企業を新たな成長軌道に乗せ、C-suiteに移行させるための重要な展望は何か?
このことが、現在、そして今後10年間のグリッドスケール定置型蓄電池市場にどのような影響を与えるかを知る必要があります:
- 342ページにわたる本レポートでは、139の表と204のチャート/グラフを独占的に提供します。
- 本レポートでは、業界における主要な収益性の高い分野を取り上げており、今すぐその分野をターゲットにすることができます。
- 世界、地域、国の売上と成長を詳細に分析しています。
- 競合他社が成功した主要なトレンド、変化、収益予測をハイライトしています。
本レポートは、グリッドスケール定置型蓄電池市場が今後10年間でどのように発展するか、またCOVID-19の景気後退や景気回復の変動に合わせて、今日あなたにお伝えします。この市場は、過去10年間のどの時点よりも今が重要です。
2033年までの予測やその他の分析により、商業的な展望を明らかにする。
- 342ページにわたる本レポートでは、139の表と204のチャート/グラフを独占的に提供します。
- 本レポートでは、業界における主要な収益性の高い分野を取り上げており、今すぐその分野をターゲットにすることができます。
- 世界、地域、国の売上と成長を詳細に分析しています。
- 競合他社が成功した主要なトレンド、変化、収益予測をハイライトしています。
本レポートは、グリッドスケール定置型蓄電池市場が今後10年間でどのように発展するか、またCOVID-19の景気後退や景気回復の変動に合わせて、今日あなたにお伝えします。この市場は、過去10年間のどの時点よりも今が重要です。
報告書の対象セグメント
金額・数量別市場セグメント
- 市場規模(US$ Million)
- 市場数量(累積設置容量:MW)
所有者モデル別市場セグメント
- 電力会社所有
- 第三者所有
- その他の 所有者モデル
用途別市場
- 再生可能エネルギー統合
- ピークシフト
- アンシラリーサービス
- バックアップ電源
- その他の用途
タイプ別市場セグメント
- リチウムイオン電池
- 鉛蓄電池
- フロー電池
- ナトリウム系電池
- ニッケル・カドミウム電池
- その他のタイプ
世界市場全体およびセグメントの収益予測に加え、4地域および主要20カ国市場の収益予測も掲載しています:
北米
- 米国
- カナダ
欧州
- ドイツ
- スペイン
- イギリス
- フランス
- イタリア
- その他の欧州地域
アジア太平洋地域
- 中国
- 日本
- インド
- オーストラリア
- 韓国
- その他のアジア太平洋地域
ラテンアメリカ
- ブラジル
- メキシコ
- その他のラテンアメリカ
中近東・アフリカ
- GCC
- 南アフリカ
- その他の中東・アフリカ地域
レポートには、グリッドスケール定置型蓄電池市場の2023年から2033年にかけての主要企業のプロファイルと、これらの企業のこのセグメントに焦点を当てたものも含まれています。
主要企業と市場成長の可能性
・ ABB Ltd
・ BYD Co. Ltd.
・ Fluence Energy
・ General Electric Company
・ Hitachi, Ltd
・ Kokam
・ LG Chem
・ Maxwell Technologies Inc.
・ NEC Energy Solutions
・ Orion Energy Systems, Inc.
・ Panasonic Holdings Corporation
・ Saft Groupe SAS
・ Samsung SDI Co., Ltd.
・ Siemens Energy AG
・ Tesla Energy Operations, Inc.
グリッドスケール定置型蓄電池市場の世界全体の収益、金額ベースで2023年から2033年まで、市場は2023年に30億600万米ドルを突破すると当研究所が算出。2033年まで収益が大きく伸びることが予測されます。当社の調査では、最も大きな可能性を秘めた企業を特定しています。彼らの能力、進歩、商業的展望を発見することで、先手を打つことができます。
グリッドスケール定置型蓄電池市場、2023年から2033年までのレポートはどのように役立つのでしょうか?
要約すると、340ページ以上のレポートでは、以下のような知識を得ることができます:
- グリッドスケール定置型蓄電池市場の2023年から2033年までの収益予測 所有モデル、タイプ、アプリケーションの各予測を世界および地域レベルで掲載 - 業界の展望を発見し、投資と収益に最も有利な場所を見つけることができます。
- 4つの地域と20の主要国市場の2033年までの収益予測 - 北米、欧州、アジア太平洋、ラテンアメリカ、中東&アフリカのグリッドスケール定置型蓄電池市場、2023年から2033年の市場予測をご覧いただけます。また、アメリカ、カナダ、ブラジル、ドイツ、フランス、イギリス、イタリア、中国、インド、日本、オーストラリアなど、著名な経済圏の市場も予測されています。
- 既存企業や市場参入を目指す企業の展望 - 2023年から2033年までのグリッドスケール定置型蓄電池市場に関わる主要企業15社の企業プロファイルを含む。
独自の予測による定量・定性分析をご覧いただけます。私たちのレポートだけが持つ情報を入手し、貴重なビジネスインテリジェンスとして情報を得ることができます。
他にはない情報
私たちの新しいレポートがあれば、知識に遅れをとったり、チャンスを逃したりする可能性は低くなります。私たちの仕事があなたの研究、分析、意思決定にどのように役立つかをご覧ください。Visiongainの研究は、グリッドスケール定置型蓄電池市場、2023年から2033年、市場をリードする企業のための商業的分析を必要とするすべての人のためのものです。データ、トレンド、予測を見つけることができます。
ページTOPに戻る
目次
目次
1 レポートの概要
1.1 研究の目的
1.2 グリッドスケール定置用蓄電池の市場紹介
1.3 本レポートが提供するもの
1.4 本レポートを読むべき理由
1.5 本分析レポートが回答する主な質問事項
1.6 本レポートは誰のためのものか?
1.7 調査方法
1.7.1 市場の定義
1.7.2 市場評価・予測手法
1.7.3 データの検証
1.7.3.1 プライマリーリサーチ
1.7.3.2 セカンダリーリサーチ
1.8 よくある質問(FAQ)
1.9 関連するVisiongainのレポート
1.10 Visiongainについて
2 エグゼクティブサマリー
2.1.1 グリッドスケール定置型蓄電池の所有者モデル別市場:市場魅力度指数
2.1.2 グリッドスケール定置型蓄電池の用途別市場:市場魅力度指数
2.1.3 グリッドスケール定置用蓄電池のタイプ別市場:市場魅力度指数
2.1.4 グリッドスケール定置型蓄電池の地域別市場:市場魅力度指数
3 市場の概要
3.1 主要な調査結果
3.2 サプライチェーン
3.3 マーケットダイナミクス
3.3.1 市場促進要因
3.3.1.1 持続可能なエネルギー資源に向けた投資の増加
3.3.1.2 電気自動車への需要増加
3.3.1.3 送電網の近代化も市場の成長を促進する
3.3.2 市場抑制要因
3.3.2.4 グリッド規模でのバッテリーストレージに関連する安全性の懸念
3.3.2.5 標準化の欠如も課題である
3.3.2.6 時代遅れの規制政策と市場設計
3.3.3 市場の可能性
3.3.3.7 蓄電投資に対する金融インセンティブ
3.3.3.8 バッテリーストレージは送電コストを下げることができる
3.3.3.9 世界的な再生可能エネルギーキャンペーン
3.4 COVID-19影響度分析
3.5 ポーターのファイブフォース分析
3.5.1 新規参入の脅威-高い
3.5.2 サプライヤーのバーゲニングパワー - 高い
3.5.3 買い手のバーゲニングパワー-高
3.5.4 代替品の脅威- 低~中
3.5.5 競争相手のライバルの激しさ- 高
3.6 PEST分析
3.6.1 政治的要因
3.6.2 経済的要因
3.6.3 社会的要因
3.6.4 技術的要因
4 グリッドスケール定置型蓄電池市場分析:所有者-モデル別
4.1 主要な調査結果
4.2 所有・モデル別セグメント市場魅力度指数
4.2.1 グリッドスケール定置型蓄電池の所有者モデル別市場規模の推定と予測
4.3 電力会社所有
4.3.1 地域別市場規模、2023-2033年(US$ Mn)
4.3.2 地域別市場シェア、2023年&2033年(%)
4.4 第三者所有
4.4.1 地域別市場規模、2023-2033年(US$ Mn)
4.4.2 地域別市場シェア、2023年&2033年(%)
4.5 その他の所有モデル
4.5.1 地域別市場規模、2023年~2033年(US$ Mn)
4.5.2 地域別市場シェア、2023年&2033年(%)
5 グリッドスケール定置型蓄電池市場分析:用途別
5.1 主要な調査結果
5.2 用途別セグメント 市場魅力度指数
5.2.1 グリッドスケール定置型蓄電池の用途別市場規模の推定と予測
5.3 再生可能エネルギーとの統合
5.3.1 地域別市場規模、2023年~2033年(US$ Mn)
5.3.2 地域別市場シェア、2023年&2033年(%)
5.4 ピークシフト
5.4.1 地域別市場規模、2023年~2033年(US$ Mn)
5.4.2 地域別市場シェア、2023年&2033年(%)
5.5 アンシラリーサービス
5.5.1 地域別市場規模、2023年~2033年(US$ Mn)
5.5.2 地域別市場シェア、2023年&2033年(%)
5.6 バックアップ電源
5.6.1 地域別市場規模、2023年~2033年(US$ Mn)
5.6.2 地域別市場シェア、2023年&2033年(%)
5.7 その他のアプリケーション
5.7.1 マイクログリッド
5.7.2 送電・配電アップグレード
5.7.3 地域別市場規模、2023年~2033年(US$ Mn)
5.7.4 地域別市場シェア、2023年&2033年(%)
6 グリッドスケール定置型蓄電池市場分析:タイプ別
6.1 主要な調査結果
6.2 タイプ別セグメント市場魅力度指数
6.3 グリッドスケール定置型蓄電池のタイプ別市場規模の推定と予測
6.4 リチウムイオン電池
6.4.1 地域別市場規模、2023年~2033年(US$ Mn)
6.4.2 地域別市場シェア、2023年~2033年(%)
6.5 鉛蓄電池
6.5.1 地域別市場規模、2023年~2033年(US$ Mn)
6.5.2 地域別市場シェア、2023年&2033年(%)
6.6 フロー電池
6.6.1 地域別市場規模、2023年~2033年(US$ Mn)
6.6.2 地域別市場シェア、2023年&2033年(%)
6.7 ナトリウム系電池
6.7.1 地域別市場規模、2023年~2033年(US$ Mn)
6.7.2 地域別市場シェア、2023年&2033年(%)
6.8 ニッケル・カドミウム電池
6.8.1 地域別市場規模、2023年~2033年(US$ Mn)
6.8.2 地域別市場シェア、2023年&2033年(%)
6.9 その他のタイプ
6.9.1 ジンク・カーボン・バッテリー
6.9.2 ニッケル水素(NiMH)電池
6.9.3 地域別市場規模、2023年~2033年(US$ Mn)
6.9.4 地域別市場シェア、2023年&2033年 (%)
7 グリッドスケール定置型蓄電池市場分析:地域別
7.1 主要な調査結果
7.1.1 世界のグリッドスケール定置型蓄電池市場:地域別
8 北米のグリッドスケール定置型蓄電池市場分析
8.1 主要な調査結果
8.2 北米グリッドスケール定置型蓄電池市場魅力度指数
8.3 北米グリッドスケール定置型蓄電池市場規模推定と予測
8.4 北米グリッドスケール定置型蓄電池市場:累積設置容量別
8.5 北米グリッドスケール定置型蓄電池の国別市場:累積設置容量別
8.6 北米グリッドスケール定置用蓄電池の国別市場規模推定と予測
8.7 北米グリッドスケール定置用蓄電池の所有者モデル別市場規模推定と予測
8.8 北米グリッドスケール定置用蓄電池の用途別市場規模推定と予測
8.9 北米グリッドスケール定置用蓄電池のタイプ別市場規模推定と予測
8.10 米国のグリッドスケール定置型蓄電池の市場分析
8.11 カナダのグリッドスケール定置型蓄電池の市場分析
9 欧州のグリッドスケール定置用蓄電池市場分析
9.1 主要な調査結果
9.2 欧州グリッドスケール定置型蓄電池市場魅力度指数
9.3 欧州グリッドスケール定置型蓄電池の市場規模推定と予測
9.4 欧州グリッドスケール定置型蓄電池市場:累積設置容量別
9.5 欧州グリッドスケール定置型蓄電池の国別市場:累積設置容量別
9.6 欧州グリッドスケール定置型蓄電池の国別市場規模推定と予測
9.7 欧州グリッドスケール定置型蓄電池の所有者モデル別市場規模推定と予測
9.8 欧州のグリッドスケール定置型蓄電池の用途別市場規模推定と予測
9.9 欧州のグリッドスケール定置型蓄電池のタイプ別市場規模推定と予測
9.10 ドイツのグリッドスケール定置型蓄電池の市場分析
9.11 イギリスのグリッドスケール定置型蓄電池の市場分析
9.12 フランスのグリッドスケール定置型蓄電池の市場分析
9.13 イタリアのグリッドスケール定置型蓄電池の市場分析
9.14 スペイン グリッドスケール定置型蓄電池の市場分析
9.15 その他の欧州のグリッドスケール定置型蓄電池の市場分析
10 アジア太平洋地域のグリッドスケール定置型蓄電池市場分析
10.1 主要な調査結果
10.2 アジア太平洋地域のグリッドスケール定置型蓄電池市場魅力度指数
10.3 アジア太平洋地域のグリッドスケール定置型蓄電池の市場規模推定と予測
10.4 アジア太平洋地域のグリッドスケール定置型蓄電池市場:累積設置容量別
10.5 アジア太平洋地域のグリッドスケール定置型蓄電池の国別市場:累積設置容量別
10.6 アジア太平洋地域のグリッドスケール定置型蓄電池の国別市場規模推定と予測
10.7 アジア太平洋地域のグリッドスケール定置型蓄電池の所有者モデル別市場規模推定と予測
10.8 アジア太平洋地域のグリッドスケール定置型蓄電池の用途別市場規模推定と予測
10.9 アジア太平洋地域のグリッドスケール定置型蓄電池のタイプ別市場規模推定と予測
10.10 中国グリッドスケール定置型蓄電池の市場分析
10.11 インドのグリッドスケール定置型蓄電池の市場分析
10.12 日本のグリッドスケール定置型蓄電池の市場分析
10.13 オーストラリア グリッドスケール定置型蓄電池の市場分析
10.14 韓国グリッドスケール定置型蓄電池の市場分析
10.15 その他のアジア太平洋地域のグリッドスケール定置型蓄電池の市場分析
11 中東・アフリカのグリッドスケール定置型蓄電池の市場分析
11.1 主要な調査結果
11.2 中東・アフリカのグリッドスケール定置型蓄電池市場魅力度指数
11.3 中東・アフリカのグリッドスケール定置型蓄電池市場規模推定と予測
11.4 中東・アフリカのグリッドスケール定置型蓄電池市場:累積設置容量別
11.5 中東・アフリカのグリッドスケール定置型蓄電池の国別市場:累積設置容量別
11.6 中東・アフリカのグリッドスケール定置用蓄電池の国別市場規模推定と予測
11.7 中東・アフリカのグリッドスケール定置用蓄電池の所有者モデル別市場規模推移推定と予測
11.8 中東・アフリカのグリッドスケール定置用蓄電池の用途別市場規模推定と予測
11.9 中東・アフリカのグリッドスケール定置型蓄電池のタイプ別市場規模推定と予測
11.10 GCCグリッドスケール定置型蓄電池の市場分析
11.11 南アフリカのグリッドスケール定置型蓄電池の市場分析
11.12 その他の中東・アフリカのグリッドスケール定置型蓄電池の市場分析
12 ラテンアメリカのグリッドスケール定置型蓄電池の市場分析
12.1 主要な調査結果
12.2 ラテンアメリカのグリッドスケール定置型蓄電池市場魅力度指数
12.3 ラテンアメリカのグリッドスケール定置型蓄電池の市場規模の推定と予測
12.4 ラテンアメリカのグリッドスケール定置型蓄電池市場:累積設置容量別
12.5 ラテンアメリカのグリッドスケール定置型蓄電池の国別市場:累積設置容量別
12.6 ラテンアメリカのグリッドスケール定置型蓄電池の国別市場規模推定と予測
12.7 ラテンアメリカのグリッドスケール定置型蓄電池の所有者モデル別市場規模の推定と予測
12.8 ラテンアメリカのグリッドスケール定置型蓄電池の用途別市場規模推定と予測
12.9 ラテンアメリカのグリッドスケール定置型蓄電池のタイプ別市場規模推定と予測
12.10 ブラジルのグリッドスケール定置型蓄電池の市場分析
12.11 メキシコのグリッドスケール定置型蓄電池の市場分析
12.12 その他のラテンアメリカの地域グリッドスケール定置型蓄電池の市場分析
13 会社概要
13.1 競争環境、2022年
13.2 戦略的な展望
13.2.1 主要事業戦略
13.3 Tesla Energy Operations, Inc.
13.3.1 企業スナップショット
13.3.2 会社概要
13.3.3 財務分析
13.3.3.1 純収益、2018年〜2022年
13.3.3.2 R&D、2018年~2022年
13.3.3.3 地域別収入シェア、2022年(%)
13.3.3.4 事業セグメント別売上高シェア、2022年(%)
13.3.4 製品ベンチマーキング
13.4 LG Chem
13.4.1 企業スナップショット
13.4.2 会社概要
13.4.3 財務分析
13.4.3.1 純収益、2018年〜2022年
13.4.3.2 R&D、2018年〜2022年
13.4.3.3 地域別収入シェア、2022年(%)
13.4.3.4 事業セグメント別売上高シェア、2022年(%)
13.4.4 製品のベンチマーキング
13.4.5 戦略的な展望
13.5 BYD Co.Ltd.
13.5.1 企業スナップショット
13.5.2 会社概要
13.5.3 財務分析
13.5.3.1 純収益、2017-2021年
13.5.3.2 R&D、2017年~2021年
13.5.3.3 地域別売上高シェア、2021年(%)
13.5.4 製品ベンチマーキング
13.6 Fluence Energy
13.6.1 企業スナップショット
13.6.2 会社概要
13.6.3 財務分析
13.6.3.1 純収益、2018年〜2022年
13.6.3.2 R&D、2018年〜2022年
13.6.4 製品ベンチマーキング
13.6.5 戦略的な展望
13.7 Samsung SDI Co., Ltd.
13.7.1 企業スナップショット
13.7.2 会社概要
13.7.3 財務分析
13.7.3.1 純収益、2018年〜2022年
13.7.3.2 R&D、2018年~2022年
13.7.3.3 地域別収入シェア、2022年(%)
13.7.3.4 事業セグメント別売上高シェア、2022年(%)
13.7.4 製品のベンチマーキング
13.8 Saft Groupe SAS
13.8.1 企業スナップショット
13.8.2 会社概要
13.8.3 財務分析
13.8.3.1 純収益、2018年〜2022年
13.8.3.2 R&D、2018年〜2022年
13.8.3.3 地域別収入シェア、2022年(%)
13.8.3.4 事業セグメント別売上高シェア、2022年(%)
13.8.4 製品のベンチマーキング
13.8.5 戦略的な展望
13.9 General Electric Company
13.9.1 企業スナップショット
13.9.2 会社概要
13.9.3 財務分析
13.9.3.1 純収益、2018年〜2022年
13.9.3.2 R&D、2018年〜2022年
13.9.3.3 地域別収入シェア、2022年(%)
13.9.3.4 事業セグメント別売上高シェア、2022年(%)
13.9.4 製品ベンチマーキング
13.10 Siemens Energy AG
13.10.1 企業スナップショット
13.10.2 会社概要
13.10.3 財務分析
13.10.3.1 純収益、2018年〜2022年
13.10.3.2 R&D、2018年〜2022年
13.10.3.3 地域別収入シェア、2022年(%)
13.10.3.4 事業セグメント別売上高シェア、2022年(%)
13.10.4 製品のベンチマーキング
13.10.5 戦略的な展望
13.11 Panasonic Holdings Corporation
13.11.1 企業スナップショット
13.11.2 会社概要
13.11.3 財務分析
13.11.3.1 純収益、2018年~2022年
13.11.3.2 R&D、2018年~2022年
13.11.3.3 地域別収入シェア、2022年(%)
13.11.3.4 事業セグメント別売上高シェア、2022年(%)
13.11.4 製品ベンチマーキング
13.12 Hitachi, Ltd
13.12.1 企業スナップショット
13.12.2 会社概要
13.12.3 財務分析
13.12.3.1 純収益、2018年~2022年
13.12.3.2 地域別収入シェア、2022年(%)
13.12.3.3 事業セグメント別収益シェア、2022年(%)
13.12.4 製品のベンチマーキング
13.12.5 戦略的な展望
13.13 ABB Ltd
13.13.1 企業スナップショット
13.13.2 会社概要
13.13.3 財務分析
13.13.3.1 純収益、2018年〜2022年
13.13.3.2 R&D、2018年〜2022年
13.13.3.3 地域別収入シェア、2022年(%)
13.13.3.4 事業セグメント別売上高シェア、2022年(%)
13.13.4 製品のベンチマーキング
13.13.5 戦略的な展望
13.14 Orion Energy Systems, Inc
13.14.1 企業スナップショット
13.14.2 会社概要
13.14.3 財務分析
13.14.3.1 純収益、2018年〜2022年
13.14.3.2 R&D、2018年〜2022年
13.14.4 製品ベンチマーキング
13.15 Maxwell Technologies Inc.
13.15.1 企業スナップショット
13.15.2 会社概要
13.15.3 財務分析
13.15.3.1 純収益、2018年〜2022年
13.15.3.2 R&D、2018年〜2022年
13.15.3.3 地域別収入シェア、2022年(%)
13.15.3.4 事業セグメント別売上高シェア、2022年(%)
13.15.4 製品のベンチマーキング
13.15.5 戦略的な展望
13.16 NEC Energy Solutions
13.16.1 企業スナップショット
13.16.2 会社概要
13.16.3 ベンチマーキング
13.17 Kokam
13.17.1 企業スナップショット
13.17.2 会社概要
13.17.3 製品ベンチマーキング
14 結論と提言
14.1 Visiongainからの結びの言葉
14.2 市場関係者への提言
ページTOPに戻る
図表リスト
表の一覧
Table 1 Grid Scale Stationery Battery Storage Market Snapshot, 2023 & 2033 (US$ million, CAGR %)
Table 2 Global Grid Scale Stationary Battery Storage Market Forecast, 2023-2033 (US$ Mn, AGR (%), CAGR (%)) (V-Shaped Recovery Scenario)
Table 3 Global Grid Scale Stationary Battery Storage Market by Region, 2023-2033 (US$ Mn, AGR (%), CAGR (%)) (V-Shaped Recovery Scenario)
Table 4 Global Grid Scale Stationary Battery Storage Market Forecast, 2023-2033 (US$ Mn, AGR (%), CAGR (%)) (W-Shaped Recovery Scenario)
Table 5 Global Grid Scale Stationary Battery Storage Market by Region, 2023-2033 (US$ Mn, AGR (%), CAGR (%)) (W-Shaped Recovery Scenario)
Table 6 Global Grid Scale Stationary Battery Storage Market Forecast, 2023-2033 (US$ Mn, AGR (%), CAGR (%)) (U-Shaped Recovery Scenario)
Table 7 Global Grid Scale Stationary Battery Storage Market by Region, 2023-2033 (US$ Mn, AGR (%), CAGR (%)) (U-Shaped Recovery Scenario)
Table 8 Global Grid Scale Stationary Battery Storage Market Forecast, 2023-2033 (US$ Mn, AGR (%), CAGR (%)) (L-Shaped Recovery Scenario)
Table 9 Global Grid Scale Stationary Battery Storage Market by Region, 2023-2033 (US$ Mn, AGR (%), CAGR (%)) (L-Shaped Recovery Scenario)
Table 10 Global Grid Scale Stationary Battery Storage Market by Ownership-Model, 2023-2033 (US$ Mn, AGR (%), CAGR (%))
Table 11 Utility Owned Market by Region, 2023-2033 (US$ Mn, AGR (%), CAGR (%))
Table 12 Third-Party Owned Market by Region, 2023-2033 (US$ Mn, AGR (%), CAGR (%))
Table 13 Other Ownership-Model Market by Region, 2023-2033 (US$ Mn, AGR (%), CAGR (%))
Table 14 Global Grid Scale Stationary Battery Storage Market by Application, 2023-2033 (US$ Mn, AGR (%), CAGR (%))
Table 15 Renewable Integration Market by Region, 2023-2033 (US$ Mn, AGR (%), CAGR (%))
Table 16 Peak Shift Market by Region, 2023-2033 (US$ Mn, AGR (%), CAGR (%))
Table 17 Ancillary Services Market by Region, 2023-2033 (US$ Mn, AGR (%), CAGR (%))
Table 18 Back-Up Power Market by Region, 2023-2033 (US$ Mn, AGR (%), CAGR (%))
Table 19 Other Application Market by Region, 2023-2033 (US$ Mn, AGR (%), CAGR (%))
Table 20 Global Grid Scale Stationary Battery Storage Market by Type, 2023-2033 (US$ Mn, AGR (%), CAGR (%))
Table 21 Lithium-Ion Battery Market by Region, 2023-2033 (US$ Mn, AGR (%), CAGR (%))
Table 22 Lead Acid Battery Market by Region, 2023-2033 (US$ Mn, AGR (%), CAGR (%))
Table 23 Flow Battery Market by Region, 2023-2033 (US$ Mn, AGR (%), CAGR (%))
Table 24 Sodium Based Battery Market by Region, 2023-2033 (US$ Mn, AGR (%), CAGR (%))
Table 25 Nickel–Cadmium Battery Market by Region, 2023-2033 (US$ Mn, AGR (%), CAGR (%))
Table 26 Other Type Market by Region, 2023-2033 (US$ Mn, AGR (%), CAGR (%))
Table 27 Global Grid Scale Stationary Battery Storage Market by Region, 2023-2033 (US$ Mn, AGR (%), CAGR (%))
Table 28 North America Grid Scale Stationary Battery Storage Market by Cumulative Installed Capacity, 2023-2033 (MW, AGR (%), CAGR (%))
Table 29 North America Grid Scale Stationary Battery Storage Market by Cumulative Installed Capacity, 2023-2033 (MW, AGR (%), CAGR (%))
Table 30 North America Grid Scale Stationary Battery Storage Market by Country, 2023-2033 (US$ Mn, AGR (%), CAGR (%))
Table 31 North America Grid Scale Stationary Battery Storage Market by Ownership-Model, 2023-2033 (US$ Mn, AGR (%), CAGR (%))
Table 32 North America Grid Scale Stationary Battery Storage Market by Application, 2023-2033 (US$ Mn, AGR (%), CAGR (%))
Table 33 North America Grid Scale Stationary Battery Storage Market by Type, 2023-2033 (US$ Mn, AGR (%), CAGR (%))
Table 34 US Grid Scale Stationary Battery Storage Market by Value, 2023-2033 (US$ Mn, AGR (%), CAGR (%))
Table 35 US Grid Scale Stationary Battery Stor0age Market by Cumulative Installed Capacity, 2023-2033 (MW, AGR (%), CAGR (%))
Table 36 Canada Grid Scale Stationary Battery Storage Market by Value, 2023-2033 (US$ Mn, AGR (%), CAGR (%))
Table 37 Canada Grid Scale Stationary Battery Storage Market by Cumulative Installed Capacity, 2023-2033 (MW, AGR (%), CAGR (%))
Table 38 Europe Grid Scale Stationary Battery Storage Market by Value, 2023-2033 (US$ Mn, AGR (%), CAGR (%))
Table 39 Europe Grid Scale Stationary Battery Storage Market by Cumulative Installed Capacity, 2023-2033 (MW, AGR (%), CAGR (%))
Table 40 Europe Grid Scale Stationary Battery Storage Market by Country, 2023-2033 (MW, AGR (%), CAGR (%))
Table 41 Europe Grid Scale Stationary Battery Storage Market by Country, 2023-2033 (US$ Mn, AGR (%), CAGR (%))
Table 42 Europe Grid Scale Stationary Battery Storage Market by Ownership-Model, 2023-2033 (US$ Mn, AGR (%), CAGR (%))
Table 43 Europe Grid Scale Stationary Battery Storage Market by Application, 2023-2033 (US$ Mn, AGR (%), CAGR (%))
Table 44 Europe Grid Scale Stationary Battery Storage Market by Type, 2023-2033 (US$ Mn, AGR (%), CAGR (%))
Table 45 Germany Grid Scale Stationary Battery Storage Market by Value, 2023-2033 (US$ Mn, AGR (%), CAGR (%))
Table 46 Germany Grid Scale Stationary Battery Storage Market by Cumulative Installed Capacity, 2023-2033 (MW, AGR (%), CAGR (%))
Table 47 UK Grid Scale Stationary Battery Storage Market by Value, 2023-2033 (US$ Mn, AGR (%), CAGR (%))
Table 48 UK Grid Scale Stationary Battery Storage Market by Cumulative Installed Capacity, 2023-2033 (MW, AGR (%), CAGR (%))
Table 49 France Grid Scale Stationary Battery Storage Market by Value, 2023-2033 (US$ Mn, AGR (%), CAGR (%))
Table 50 France Grid Scale Stationary Battery Storage Market by Cumulative Installed Capacity, 2023-2033 (MW, AGR (%), CAGR (%))
Table 51 Italy Grid Scale Stationary Battery Storage Market by Value, 2023-2033 (US$ Mn, AGR (%), CAGR (%))
Table 52 Italy Grid Scale Stationary Battery Storage Market by Cumulative Installed Capacity, 2023-2033 (MW, AGR (%), CAGR (%))
Table 53 Spain Grid Scale Stationary Battery Storage Market by Value, 2023-2033 (US$ Mn, AGR (%), CAGR (%))
Table 54 Spain Grid Scale Stationary Battery Storage Market by Cumulative Installed Capacity, 2023-2033 (MW, AGR (%), CAGR (%))
Table 55 Rest of Europe Grid Scale Stationary Battery Storage Market by Value, 2023-2033 (US$ Mn, AGR (%), CAGR (%))
Table 56 Rest of Europe Grid Scale Stationary Battery Storage Market by Cumulative Installed Capacity, 2023-2033 (MW, AGR (%), CAGR (%))
Table 57 Asia-Pacific Grid Scale Stationary Battery Storage Market by Value, 2023-2033 (US$ Mn, AGR (%), CAGR (%))
Table 58 Asia-Pacific Grid Scale Stationary Battery Storage Market by Cumulative Installed Capacity, 2023-2033 (MW, AGR (%), CAGR (%))
Table 59 Asia-Pacific Grid Scale Stationary Battery Storage Market Cumulative Installed Capacity, by Country, 2023-2033 (MW, AGR (%), CAGR (%))
Table 60 Asia-Pacific Grid Scale Stationary Battery Storage Market by Country, 2023-2033 (US$ Mn, AGR (%), CAGR (%))
Table 61 Asia-Pacific Grid Scale Stationary Battery Storage Market by Ownership-Model, 2023-2033 (US$ Mn, AGR (%), CAGR (%))
Table 62 Asia-Pacific Grid Scale Stationary Battery Storage Market by Application, 2023-2033 (US$ Mn, AGR (%), CAGR (%))
Table 63 Asia-Pacific Grid Scale Stationary Battery Storage Market by Type, 2023-2033 (US$ Mn, AGR (%), CAGR (%))
Table 64 China Grid Scale Stationary Battery Storage Market by Value, 2023-2033 (US$ Mn, AGR (%), CAGR (%))
Table 65 China Grid Scale Stationary Battery Storage Market by Cumulative Installed Capacity, 2023-2033 (MW, AGR (%), CAGR (%))
Table 66 India Grid Scale Stationary Battery Storage Market by Value, 2023-2033 (US$ Mn, AGR (%), CAGR (%))
Table 67 India Grid Scale Stationary Battery Storage Market by Cumulative Installed Capacity, 2023-2033 (MW, AGR (%), CAGR (%))
Table 68 Japan Grid Scale Stationary Battery Storage Market by Value, 2023-2033 (US$ Mn, AGR (%), CAGR (%))
Table 69 Japan Grid Scale Stationary Battery Storage Market by Cumulative Installed Capacity, 2023-2033 (MW, AGR (%), CAGR (%))
Table 70 Australia Grid Scale Stationary Battery Storage Market by Value, 2023-2033 (US$ Mn, AGR (%), CAGR (%))
Table 71 Australia Grid Scale Stationary Battery Storage Market by Cumulative Installed Capacity, 2023-2033 (MW, AGR (%), CAGR (%))
Table 72 South Korea Grid Scale Stationary Battery Storage Market by Value, 2023-2033 (US$ Mn, AGR (%), CAGR (%))
Table 73 South Korea Grid Scale Stationary Battery Storage Market by Cumulative Installed Capacity, 2023-2033 (MW, AGR (%), CAGR (%))
Table 74 Rest of Asia-Pacific Grid Scale Stationary Battery Storage Market by Value, 2023-2033 (US$ Mn, AGR (%), CAGR (%))
Table 75 Rest of Asia-Pacific Grid Scale Stationary Battery Storage Market by Cumulative Installed Capacity, 2023-2033 (MW, AGR (%), CAGR (%))
Table 76 Middle East & Africa Grid Scale Stationary Battery Storage Market by Value, 2023-2033 (US$ Mn, AGR (%), CAGR (%))
Table 77 Middle East & Africa Grid Scale Stationary Battery Storage Market by Cumulative Installed Capacity, 2023-2033 (MW, AGR (%), CAGR (%))
Table 78 Middle East & Africa Grid Scale Stationary Battery Storage Market by Cumulative Installed Capacity by Country, 2023-2033 (MW, AGR (%), CAGR (%))
Table 79 Middle East & Africa Grid Scale Stationary Battery Storage Market by Country, 2023-2033 (US$ Mn, AGR (%), CAGR (%))
Table 80 Middle East & Africa Grid Scale Stationary Battery Storage Market by Ownership-Model, 2023-2033 (US$ Mn, AGR (%), CAGR (%))
Table 81 Middle East & Africa Grid Scale Stationary Battery Storage Market by Application, 2023-2033 (US$ Mn, AGR (%), CAGR (%))
Table 82 Middle East & Africa Grid Scale Stationary Battery Storage Market by Type, 2023-2033 (US$ Mn, AGR (%), CAGR (%))
Table 83 GCC Grid Scale Stationary Battery Storage Market by Value, 2023-2033 (US$ Mn, AGR (%), CAGR (%))
Table 84 GCC Grid Scale Stationary Battery Storage Market by Cumulative Installed Capacity, 2023-2033 (MW, AGR (%), CAGR (%))
Table 85 South Africa Grid Scale Stationary Battery Storage Market by Value, 2023-2033 (US$ Mn, AGR (%), CAGR (%))
Table 86 South Africa Grid Scale Stationary Battery Storage Market by Cumulative Installed Capacity, 2023-2033 (MW, AGR (%), CAGR (%))
Table 87 Rest of Middle East & Africa Grid Scale Stationary Battery Storage Market by Value, 2023-2033 (US$ Mn, AGR (%), CAGR (%))
Table 88 Rest of Middle East & Africa Grid Scale Stationary Battery Storage Market by Cumulative Installed Capacity, 2023-2033 (MW, AGR (%), CAGR (%))
Table 89 Latin America Grid Scale Stationary Battery Storage Market by Value, 2023-2033 (US$ Mn, AGR (%), CAGR (%))
Table 90 Latin America Grid Scale Stationary Battery Storage Market by Cumulative Installed Capacity, 2023-2033 (MW, AGR (%), CAGR (%))
Table 91 Latin America Grid Scale Stationary Battery Storage Market Cumulative Installed Capacity, by Country, 2023-2033 (MW, AGR (%), CAGR (%))
Table 92 Latin America Grid Scale Stationary Battery Storage Market by Country, 2023-2033 (US$ Mn, AGR (%), CAGR (%))
Table 93 Latin America Grid Scale Stationary Battery Storage Market by Ownership-Model, 2023-2033 (US$ Mn, AGR (%), CAGR (%))
Table 94 Latin America Grid Scale Stationary Battery Storage Market by Application, 2023-2033 (US$ Mn, AGR (%), CAGR (%))
Table 95 Latin America Grid Scale Stationary Battery Storage Market by Type, 2023-2033 (US$ Mn, AGR (%), CAGR (%))
Table 96 Brazil Grid Scale Stationary Battery Storage Market by Value, 2023-2033 (US$ Mn, AGR (%), CAGR (%))
Table 97 Brazil Grid Scale Stationary Battery Storage Market by Cumulative Installed Capacity, 2023-2033 (MW, AGR (%), CAGR (%))
Table 98 Mexico Grid Scale Stationary Battery Storage Market by Value, 2023-2033 (US$ Mn, AGR (%), CAGR (%))
Table 99 Mexico Grid Scale Stationary Battery Storage Market by Cumulative Installed Capacity, 2023-2033 (MW, AGR (%), CAGR (%))
Table 100 Rest of Latin America Grid Scale Stationary Battery Storage Market by Value, 2023-2033 (US$ Mn, AGR (%), CAGR (%))
Table 101 Rest of Latin America Grid Scale Stationary Battery Storage Market by Cumulative Installed Capacity, 2023-2033 (MW, AGR (%), CAGR (%))
Table 102 Strategic Outlook
Table 103 Tesla Energy Operations, Inc.: Key Details, (CEO, HQ, Revenue, Founded, No. of Employees, Company Type, Website, Business Segment)
Table 104 Tesla Energy Operations, Inc.: Product Benchmarking
Table 105 LG Chem: Key Details, (CEO, HQ, Revenue, Founded, No. of Employees, Company Type, Website, Business Segment)
Table 106 LG Chem: Product Benchmarking
Table 107 LG Chem: Strategic Outlook
Table 108 BYD Co. Ltd.: Key Details, (CEO, HQ, Revenue, Founded, No. of Employees, Company Type, Website, Business Segment)
Table 109 BYD Co. Ltd.: Product Benchmarking
Table 110 Fluence Energy: Key Details, (CEO, HQ, Revenue, Founded, No. of Employees, Company Type, Website, Business Segment)
Table 111 Fluence Energy: Product Benchmarking
Table 112 Fluence Energy: Strategic Outlook
Table 113 Samsung SDI Co., Ltd.: Key Details, (CEO, HQ, Revenue, Founded, No. of Employees, Company Type, Website, Business Segment)
Table 114 Samsung SDI Co., Ltd.: Product Benchmarking
Table 115 Saft Groupe SAS: Key Details, (CEO, HQ, Revenue, Founded, No. of Employees, Company Type, Website, Business Segment)
Table 116 Saft Groupe SAS: Product Benchmarking
Table 117 Saft Groupe SAS: Strategic Outlook
Table 118 General Electric Company: Key Details, (CEO, HQ, Revenue, Founded, No. of Employees, Company Type, Website, Business Segment)
Table 119 General Electric Company: Product Benchmarking
Table 120 Siemens Energy AG: Key Details, (CEO, HQ, Revenue, Founded, No. of Employees, Company Type, Website, Business Segment)
Table 121 Siemens Energy AG: Product Benchmarking
Table 122 Siemens Energy AG: Strategic Outlook
Table 123 Panasonic Holdings Corporation: Key Details, (CEO, HQ, Revenue, Founded, No. of Employees, Company Type, Website, Business Segment)
Table 124 Panasonic Holdings Corporation: Product Benchmarking
Table 125 Hitachi, Ltd: Key Details, (CEO, HQ, Revenue, Founded, No. of Employees, Company Type, Website, Business Segment)
Table 126 Hitachi, Ltd: Product Benchmarking
Table 127 Hitachi, Ltd: Strategic Outlook
Table 128 ABB Ltd: Key Details, (CEO, HQ, Revenue, Founded, No. of Employees, Company Type, Website, Business Segment)
Table 129 ABB Ltd: Product Benchmarking
Table 130 ABB Ltd: Strategic Outlook
Table 131 Orion Energy Systems Inc.: Key Details, (CEO, HQ, Revenue, Founded, No. of Employees, Company Type, Website, Business Segment)
Table 132 Orion Energy Systems Inc.: Product Benchmarking
Table 133 Maxwell Technologies Inc.: Key Details, (CEO, HQ, Revenue, Founded, No. of Employees, Company Type, Website, Business Segment)
Table 134 Maxwell Technologies Inc.: Product Benchmarking
Table 135 Maxwell Technologies Inc.: Strategic Outlook
Table 136 NEC Energy Solutions: Key Details, (CEO, HQ, Revenue, Founded, No. of Employees, Company Type, Website, Business Segment)
Table 137 NEC Energy Solutions: Product Benchmarking
Table 138 Kokam: Key Details, (CEO, HQ, Revenue, Founded, No. of Employees, Company Type, Website, Business Segment)
Table 139 Kokam: Product Benchmarking
図の一覧
Figure 1 Grid Scale Stationery Battery Storage Market Segmentation
Figure 2 Grid Scale Stationery Battery Storage Market by Ownership-Model: Market Attractiveness Index
Figure 3 Grid Scale Stationery Battery Storage Market by Application: Market Attractiveness Index
Figure 4 Grid Scale Stationery Battery Storage Market by Type: Market Attractiveness Index
Figure 5 Grid Scale Stationery Battery Storage Market by Region: Market Attractiveness Index
Figure 6 Grid Scale Stationery Battery Storage Market: Market Dynamics
Figure 7 COVID Impact Analysis: Grid Scale Stationery Battery Storage Market Recovery Scenarios
Figure 8 Global Grid Scale Stationary Battery Storage Market Forecast, 2023-2033 (US$ Mn, AGR (%)) (V-Shaped Recovery Scenario)
Figure 9 Global Grid Scale Stationary Battery Storage Market by Region, 2023-2033 (US$ Mn, AGR (%)) (V-Shaped Recovery Scenario)
Figure 10 Global Grid Scale Stationary Battery Storage Market Forecast, 2023-2033 (US$ Mn, AGR (%)) (W-Shaped Recovery Scenario)
Figure 11 Global Grid Scale Stationary Battery Storage Market by Region, 2023-2033 (US$ Mn, AGR (%)) (W-Shaped Recovery Scenario)
Figure 12 Global Grid Scale Stationary Battery Storage Market Forecast, 2023-2033 (US$ Mn, AGR (%)) (U-Shaped Recovery Scenario)
Figure 13 Global Grid Scale Stationary Battery Storage Market by Region, 2023-2033 (US$ Mn, AGR (%)) (U-Shaped Recovery Scenario)
Figure 14 Global Grid Scale Stationary Battery Storage Market Forecast, 2023-2033 (US$ Mn, AGR (%)) (L-Shaped Recovery Scenario)
Figure 15 Global Grid Scale Stationary Battery Storage Market by Region, 2023-2033 (US$ Mn, AGR (%)) (L-Shaped Recovery Scenario)
Figure 16 Grid Scale Stationery Battery Storage Market: Porter’s Five Forces Analysis
Figure 17 Grid Scale Stationery Battery Storage Market: PEST Analysis
Figure 18 Grid Scale Stationery Battery Storage Market by ownership-model: Market Attractiveness Index
Figure 19 Global Grid Scale Stationary Battery Storage Market by Ownership-Model, 2023-2033 (US$ Mn, AGR (%))
Figure 20 Grid Scale Stationery Battery Storage Market Share Forecast by Ownership-Model, 2023 & 2033 (%)
Figure 21 Utility Owned Market by Region, 2023-2033 (US$ Mn, AGR (%))
Figure 22 Utility Owned Market Share Forecast by Region, 2023 & 2033 (%)
Figure 23 Third-Party Owned Market by Region, 2023-2033 (US$ Mn, AGR (%))
Figure 24 Third Party Owned Market Share Forecast by Region, 2023 & 2033 (%)
Figure 25 Other Ownership-Model Market by Region, 2023-2033 (US$ Mn, AGR (%))
Figure 26 Other Ownership-Model Market Share Forecast by Region, 2023 & 2033 (%)
Figure 27 Grid Scale Stationery Battery Storage Market by Application: Market Attractiveness Index
Figure 28 Global Grid Scale Stationary Battery Storage Market by Application, 2023-2033 (US$ Mn, AGR (%))
Figure 29 Grid Scale Stationery Battery Storage Market Share Forecast by Application, 2023 & 2033 (%)
Figure 30 Renewable Integration Market by Region, 2023-2033 (US$ Mn, AGR (%))
Figure 31 Renewable Integration Market Share Forecast by Region, 2023 & 2033 (%)
Figure 32 Peak Shift Market by Region, 2023-2033 (US$ Mn, AGR (%))
Figure 33 Peak Shift Market Share Forecast by Region, 2023 & 2033 (%)
Figure 34 Ancillary Services Market by Region, 2023-2033 (US$ Mn, AGR (%))
Figure 35 Ancillary Services Market Share Forecast by Region, 2023 & 2033 (%)
Figure 36 Back-Up Power Market by Region, 2023-2033 (US$ Mn, AGR (%))
Figure 37 Back-Up Power Market Share Forecast by Region, 2023 & 2033 (%)
Figure 38 Other Application Market by Region, 2023-2033 (US$ Mn, AGR (%))
Figure 39 Other Application Market Share Forecast by Region, 2023 & 2033 (%)
Figure 40 Grid Scale Stationery Battery Storage Market by Type: Market Attractiveness Index
Figure 41 Global Grid Scale Stationary Battery Storage Market by Type, 2023-2033 (US$ Mn, AGR (%))
Figure 42 Grid Scale Stationery Battery Storage Market Share Forecast by Type, 2023 & 2033 (%)
Figure 43 Lithium-Ion Battery Market by Region, 2023-2033 (US$ Mn, AGR (%))
Figure 44 Lithium- Ion Battery Market Share Forecast by Region, 2023 & 2033 (%)
Figure 45 Lead Acid Battery Market by Region, 2023-2033 (US$ Mn, AGR (%))
Figure 46 Lead Acid Battery Market Share Forecast by Region, 2023 & 2033 (%)
Figure 47 Flow Battery Market by Region, 2023-2033 (US$ Mn, AGR (%))
Figure 48 Flow Battery Market Share Forecast by Region, 2023 & 2033 (%)
Figure 49 Sodium Based Battery Market by Region, 2023-2033 (US$ Mn, AGR (%))
Figure 50 Sodium Based Battery Market Share Forecast by Region, 2023 & 2033 (%)
Figure 51 Nickel–Cadmium Battery Market by Region, 2023-2033 (US$ Mn, AGR (%))
Figure 52 Nickel-Cadmium Battery Market Share Forecast by Region, 2023 & 2033 (%)
Figure 53 Other Type Market by Region, 2023-2033 (US$ Mn, AGR (%))
Figure 54 Others Market Share Forecast by Region, 2023 & 2033 (%)
Figure 55 Global Grid Scale Stationary Battery Storage Market by Region, 2023-2033 (US$ Mn, AGR (%))
Figure 56 Grid Scale Stationery Battery Storage Market Share Forecast by Region 2023 & 2033 (%)
Figure 57 North America Grid Scale Stationery Battery Storage Market Attractiveness Index
Figure 58 North America Grid Scale Stationary Battery Storage Market by Value, 2023-2033 (US$ Mn, AGR (%))
Figure 59 North America Grid Scale Stationary Battery Storage Market by Cumulative Installed Capacity, 2023-2033 (MW, AGR (%))
Figure 60 North America Grid Scale Stationary Battery Storage Market by Cumulative Installed Capacity, 2023-2033 (MW, AGR (%))
Figure 61 North America Grid Scale Stationary Battery Storage Market by Country, 2023-2033 (US$ Mn, AGR (%))
Figure 62 North America Grid Scale Stationery Battery Storage Market Share Forecast by Country, 2023 & 2033 (%)
Figure 63 North America Grid Scale Stationary Battery Storage Market by Ownership-Model, 2023-2033 (US$ Mn, AGR (%))
Figure 64 North America Grid Scale Stationery Battery Storage Market Share Forecast by Ownership-Model, 2023 & 2033 (%)
Figure 65 North America Grid Scale Stationary Battery Storage Market by Application, 2023-2033 (US$ Mn, AGR (%))
Figure 66 North America Grid Scale Stationary Battery Storage Market Share Forecast by Application, 2023-2033 (%)
Figure 67 North America Grid Scale Stationary Battery Storage Market by Type, 2023-2033 (US$ Mn, AGR (%))
Figure 68 North America Grid Scale Stationary Battery Storage Market Share Forecast by Type, 2023-2033 (%)
Figure 69 US Grid Scale Stationary Battery Storage Market by Value, 2023-2033 (US$ Mn, AGR (%))
Figure 70 US Grid Scale Stationary Battery Storage Market by Cumulative Installed Capacity, 2023-2033 (MW, AGR (%))
Figure 71 Canada Grid Scale Stationary Battery Storage Market by Value, 2023-2033 (US$ Mn, AGR (%))
Figure 72 Canada Grid Scale Stationary Battery Storage Market by Cumulative Installed Capacity, 2023-2033 (MW, AGR (%))
Figure 73 Europe Grid Scale Stationery Battery Storage Market Attractiveness Index
Figure 74 Europe Grid Scale Stationary Battery Storage Market by Value, 2023-2033 (US$ Mn, AGR (%))
Figure 75 Europe Grid Scale Stationary Battery Storage Market by Cumulative Installed Capacity, 2023-2033 (MW, AGR (%))
Figure 76 Europe Grid Scale Stationary Battery Storage Market by Country, 2023-2033 (US$ Mn, AGR (%))
Figure 77 Europe Grid Scale Stationary Battery Storage Market by Country, 2023-2033 (US$ Mn, AGR (%))
Figure 78 Europe Grid Scale Stationary Battery Storage Market Share Forecast by Country, 2023-2033 (%)
Figure 79 Europe Grid Scale Stationary Battery Storage Market by Ownership-Model, 2023-2033 (US$ Mn, AGR (%))
Figure 80 Europe Grid Scale Stationary Battery Storage) Market Share Forecast by Ownership-Model, 2023-2033 (%)
Figure 81 Europe Grid Scale Stationary Battery Storage Market by Application, 2023-2033 (US$ Mn, AGR (%))
Figure 82 Europe Grid Scale Stationary Battery Storage Market Share Forecast by Application, 2023-2033 (%)
Figure 83 Europe Grid Scale Stationary Battery Storage Market by Type, 2023-2033 (US$ Mn, AGR (%))
Figure 84 Europe Grid Scale Stationary Battery Storage Market Share Forecast by Type, 2023-2033 (%)
Figure 85 Germany Grid Scale Stationary Battery Storage Market by Value, 2023-2033 (US$ Mn, AGR (%))
Figure 86 Germany Grid Scale Stationary Battery Storage Market by Cumulative Installed Capacity, 2023-2033 (MW, AGR (%))
Figure 87 UK Grid Scale Stationary Battery Storage Market by Value, 2023-2033 (US$ Mn, AGR (%))
Figure 88 UK Grid Scale Stationary Battery Storage Market by Cumulative Installed Capacity, 2023-2033 (MW, AGR (%))
Figure 89 France Grid Scale Stationary Battery Storage Market by Value, 2023-2033 (US$ Mn, AGR (%))
Figure 90 France Grid Scale Stationary Battery Storage Market by Cumulative Installed Capacity, 2023-2033 (MW, AGR (%))
Figure 91 Italy Grid Scale Stationary Battery Storage Market by Value, 2023-2033 (US$ Mn, AGR (%))
Figure 92 Italy Grid Scale Stationary Battery Storage Market by Cumulative Installed Capacity, 2023-2033 (MW, AGR (%))
Figure 93 Spain Grid Scale Stationary Battery Storage Market by Value, 2023-2033 (US$ Mn, AGR (%))
Figure 94 Spain Grid Scale Stationary Battery Storage Market by Cumulative Installed Capacity, 2023-2033 (MW, AGR (%))
Figure 95 Rest of Europe Grid Scale Stationary Battery Storage Market by Value, 2023-2033 (US$ Mn, AGR (%))
Figure 96 Rest of Europe Grid Scale Stationary Battery Storage Market by Cumulative Installed Capacity, 2023-2033 (MW, AGR (%))
Figure 97 Asia-Pacific Grid Scale Stationery Battery Storage Market Attractiveness Index
Figure 98 Asia-Pacific Grid Scale Stationary Battery Storage Market by Value, 2023-2033 (US$ Mn, AGR (%))
Figure 99 Asia-Pacific Grid Scale Stationary Battery Storage Market by Cumulative Installed Capacity, 2023-2033 (MW, AGR (%))
Figure 100 Asia-Pacific Grid Scale Stationary Battery Storage Market Cumulative Installed Capacity, by Country, 2023-2033 (MW, AGR (%))
Figure 101 Asia-Pacific Grid Scale Stationary Battery Storage Market by Country, 2023-2033 (US$ Mn, AGR (%))
Figure 102 Asia-Pacific Grid Scale Stationary Battery Storage Market Share Forecast by Country, 2023-2033 (%)
Figure 103 Asia-Pacific Grid Scale Stationary Battery Storage Market by Ownership-Model, 2023-2033 (US$ Mn, AGR (%))
Figure 104 Asia-Pacific Grid Scale Stationary Battery Storage Market Share Forecast by Ownership-Model, 2023-2033 (%)
Figure 105 Asia-Pacific Grid Scale Stationary Battery Storage Market by Application, 2023-2033 (US$ Mn, AGR (%))
Figure 106 Asia-Pacific Grid Scale Stationary Battery Storage Market Share Forecast by Application, 2023-2033 (%)
Figure 107 Asia-Pacific Grid Scale Stationary Battery Storage Market by Type, 2023-2033 (US$ Mn, AGR (%))
Figure 108 Asia-Pacific Grid Scale Stationary Battery Storage Market Share Forecast by Type, 2023-2033 (%)
Figure 109 China Grid Scale Stationary Battery Storage Market by Value, 2023-2033 (US$ Mn, AGR (%))
Figure 110 China Grid Scale Stationary Battery Storage Market by Cumulative Installed Capacity, 2023-2033 (MW, AGR (%))
Figure 111 India Grid Scale Stationary Battery Storage Market by Value, 2023-2033 (US$ Mn, AGR (%))
Figure 112 India Grid Scale Stationary Battery Storage Market by Cumulative Installed Capacity, 2023-2033 (MW, AGR (%))
Figure 114 Japan Grid Scale Stationary Battery Storage Market by Value, 2023-2033 (US$ Mn, AGR (%))
Figure 115 Japan Grid Scale Stationary Battery Storage Market by Cumulative Installed Capacity, 2023-2033 (MW, AGR (%))
Figure 116 Australia Grid Scale Stationary Battery Storage Market by Value, 2023-2033 (US$ Mn, AGR (%))
Figure 117 Australia Grid Scale Stationary Battery Storage Market by Cumulative Installed Capacity, 2023-2033 (MW, AGR (%))
Figure 118 South Korea Grid Scale Stationary Battery Storage Market by Value, 2023-2033 (US$ Mn, AGR (%))
Figure 119 South Korea Grid Scale Stationary Battery Storage Market by Cumulative Installed Capacity, 2023-2033 (MW, AGR (%))
Figure 120 Rest of Asia-Pacific Grid Scale Stationary Battery Storage Market by Value, 2023-2033 (US$ Mn, AGR (%))
Figure 121 Rest of Asia-Pacific Grid Scale Stationary Battery Storage Market by Cumulative Installed Capacity, 2023-2033 (MW, AGR (%))
Figure 122 Middle East & Africa Grid Scale Stationery Battery Storage Market Attractiveness Index
Figure 123 Middle East & Africa Grid Scale Stationary Battery Storage Market by Value, 2023-2033 (US$ Mn, AGR (%))
Figure 124 Middle East & Africa Grid Scale Stationary Battery Storage Market by Cumulative Installed Capacity, 2023-2033 (MW, AGR (%))
Figure 125 Middle East & Africa Grid Scale Stationary Battery Storage Market by Cumulative Installed Capacity by Country, 2023-2033 (MW, AGR (%))
Figure 126 Middle East & Africa Grid Scale Stationary Battery Storage Market by Country, 2023-2033 (US$ Mn, AGR (%))
Figure 127 Middle East & Africa Grid Scale Stationary Battery Storage Market Share Forecast by Country, 2023-2033 (%)
Figure 128 Middle East & Africa Grid Scale Stationary Battery Storage Market by Ownership-Model, 2023-2033 (US$ Mn, AGR (%))
Figure 129 Middle East & Africa Grid Scale Stationary Battery Storage Market Share Forecast by Ownership-Model, 2023-2033 (%)
Figure 130 Middle East & Africa Grid Scale Stationary Battery Storage Market by Application, 2023-2033 (US$ Mn, AGR (%))
Figure 131 Middle East & Africa Grid Scale Stationary Battery Storage Market Share Forecast by Application, 2023-2033 (%)
Figure 132 Middle East & Africa Grid Scale Stationary Battery Storage Market by Type, 2023-2033 (US$ Mn, AGR (%))
Figure 133 Middle East & Africa Grid Scale Stationary Battery Storage Market Share Forecast by Type, 2023-2033 (%)
Figure 134 GCC Grid Scale Stationary Battery Storage Market by Value, 2023-2033 (US$ Mn, AGR (%))
Figure 135 GCC Grid Scale Stationary Battery Storage Market by Cumulative Installed Capacity, 2023-2033 (MW, AGR (%))
Figure 136 South Africa Grid Scale Stationary Battery Storage Market by Value, 2023-2033 (US$ Mn, AGR (%))
Figure 137 South Africa Grid Scale Stationary Battery Storage Market by Cumulative Installed Capacity, 2023-2033 (MW, AGR (%))
Figure 138 Rest of Middle East & Africa Grid Scale Stationary Battery Storage Market by Value, 2023-2033 (US$ Mn, AGR (%))
Figure 139 Rest of Middle East & Africa Grid Scale Stationary Battery Storage Market by Cumulative Installed Capacity, 2023-2033 (MW, AGR (%))
Figure 140 Latin America Grid Scale Stationery Battery Storage Market Attractiveness Index
Figure 141 Latin America Grid Scale Stationary Battery Storage Market by Value, 2023-2033 (US$ Mn, AGR (%))
Figure 142 Latin America Grid Scale Stationary Battery Storage Market by Cumulative Installed Capacity, 2023-2033 (MW, AGR (%))
Figure 143 Latin America Grid Scale Stationary Battery Storage Market Cumulative Installed Capacity, by Country, 2023-2033 (MW, AGR (%))
Figure 144 Latin America Grid Scale Stationary Battery Storage Market by Country, 2023-2033 (US$ Mn, AGR (%))
Figure 145 Latin America Grid Scale Stationary Battery Storage Market Share Forecast by Country, 2023-2033 (%)
Figure 146 Latin America Grid Scale Stationary Battery Storage Market by Ownership-Model, 2023-2033 (US$ Mn, AGR (%))
Figure 147 Latin America Grid Scale Stationary Battery Storage Market Share Forecast by Ownership-Model, 2023-2033 (%)
Figure 148 Latin America Grid Scale Stationary Battery Storage Market by Application, 2023-2033 (US$ Mn, AGR (%))
Figure 149 Latin America Grid Scale Stationary Battery Storage Market Share Forecast by Application, 2023-2033 (%)
Figure 150 Latin America Grid Scale Stationary Battery Storage Market by Type, 2023-2033 (US$ Mn, AGR (%))
Figure 151 Latin America Grid Scale Stationary Battery Storage Market Share Forecast by type, 2023-2033 (%)
Figure 152 Brazil Grid Scale Stationary Battery Storage Market by Value, 2023-2033 (US$ Mn, AGR (%))
Figure 153 Brazil Grid Scale Stationary Battery Storage Market by Cumulative Installed Capacity, 2023-2033 (MW, AGR (%))
Figure 154 Mexico Grid Scale Stationary Battery Storage Market by Value, 2023-2033 (US$ Mn, AGR (%))
Figure 155 Mexico Grid Scale Stationary Battery Storage Market by Cumulative Installed Capacity, 2023-2033 (MW, AGR (%))
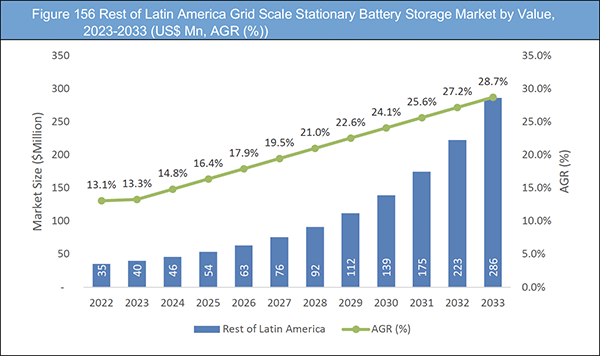
Figure 156 Rest of Latin America Grid Scale Stationary Battery Storage Market by Value, 2023-2033 (US$ Mn, AGR (%))
Figure 157 Rest of Latin America Grid Scale Stationary Battery Storage Market by Cumulative Installed Capacity, 2023-2033 (MW, AGR (%))
Figure 158 Grid Scale Stationery Battery Storage Market: Company Share/Ranking, 2022
Figure 159 Tesla Energy Operations, Inc.: Net Revenue, 2018-2022 (US$ million, AGR%)
Figure 160 Tesla Energy Operations, Inc.: R&D, 2018-2022 (US$ million, AGR%)
Figure 161 Tesla Energy Operations, Inc.: Regional Revenue Shares, 2022 (%)
Figure 162 Tesla Energy Operations, Inc.: Business Segment Revenue Shares, 2022 (%)
Figure 163 LG Chem: Net Revenue, 2018-2022 (US$ million, AGR%)
Figure 164 LG Chem: R&D, 2018-2022 (US$ million, AGR%)
Figure 165 LG Chem: Regional Revenue Shares, 2022 (%)
Figure 166 LG Chem: Business Segment Revenue Shares, 2022 (%)
Figure 167 BYD Co. Ltd: Net Revenue, 2017-2021 (US$ million, AGR%)
Figure 168 BYD Co. Ltd: R&D, 2017-2021 (US$ million, AGR%)
Figure 169 BYD Co. Ltd: Regional Revenue Shares, 2021 (%)
Figure 170 Fluence Energy: Net Revenue, 2018-2022 (US$ million, AGR%)
Figure 171 Fluence Energy: R&D, 2018-2022 (US$ million, AGR%)
Figure 172 Samsung SDI Co., Ltd.: Net Revenue, 2018-2022 (US$ million, AGR%)
Figure 173 Samsung SDI Co., Ltd.: R&D, 2018-2022 (US$ million, AGR%)
Figure 174 Samsung SDI Co., Ltd.: Regional Revenue Shares, 2022 (%)
Figure 175 Samsung SDI Co., Ltd.: Business Segment Revenue Shares, 2022 (%)
Figure 176 Saft Groupe SAS: Net Revenue, 2018-2022 (US$ million, AGR%)
Figure 177 Saft Groupe SAS: R&D, 2018-2022 (US$ million, AGR%)
Figure 178 Saft Groupe SAS: Regional Revenue Shares, 2022 (%)
Figure 179 Saft Groupe SAS: Business Segment Revenue Shares, 2022 (%)
Figure 180 General Electric Company: Net Revenue, 2018-2022 (US$ million, AGR%)
Figure 181 General Electric Company: R&D, 2018-2022 (US$ million, AGR%)
Figure 182 General Electric Company: Regional Revenue Shares, 2022 (%)
Figure 183 General Electric Company: Business Segment Revenue Shares, 2022 (%)
Figure 184 Siemens Energy AG: Net Revenue, 2018-2022 (US$ million, AGR%)
Figure 185 Siemens Energy AG: R&D, 2018-2022 (US$ million, AGR%)
Figure 186 Siemens Energy AG: Regional Revenue Shares, 2022 (%)
Figure 187 Siemens Energy AG: Business Segment Revenue Shares, 2022 (%)
Figure 188 Panasonic Holdings Corporation: Net Revenue, 2018-2022 (US$ million, AGR%)
Figure 189 Panasonic Holdings Corporation: R&D, 2018-2022 (US$ million, AGR%)
Figure 190 Panasonic Holdings Corporation: Regional Revenue Shares, 2022 (%)
Figure 191 Panasonic Holdings Corporation: Business Segment Revenue Shares, 2022 (%)
Figure 192 Hitachi, Ltd: Net Revenue, 2018-2022 (US$ million, AGR%)
Figure 193 Hitachi, Ltd: Regional Revenue Shares, 2022 (%)
Figure 194 Hitachi, Ltd: Business Segment Revenue Shares, 2022 (%)
Figure 195 ABB Ltd: Net Revenue, 2018-2022 (US$ million, AGR%)
Figure 196 ABB Ltd: R&D, 2018-2022 (US$ million, AGR%)
Figure 197 ABB Ltd: Regional Revenue Shares, 2022 (%)
Figure 198 ABB Ltd: Business Segment Revenue Shares, 2022 (%)
Figure 199 Orion Energy Systems Inc.: Net Revenue, 2018-2022 (US$ million, AGR%)
Figure 200 Orion Energy Systems Inc.: R&D, 2018-2022 (US$ million, AGR%)
Figure 201 Maxwell Technologies Inc..: Net Revenue, 2018-2022 (US$ million, AGR%)
Figure 202 Maxwell Technologies Inc..: R&D, 2018-2022 (US$ million, AGR%)
Figure 203 Maxwell Technologies Inc..: Regional Revenue Shares, 2022 (%)
Figure 204 Maxwell Technologies Inc..: Business Segment Revenue Shares, 2022 (%)
ページTOPに戻る
Summary
Report Details
The Grid Scale Stationary Battery Storage Market Report 2023-2033: This report will prove invaluable to leading firms striving for new revenue pockets if they wish to better understand the industry and its underlying dynamics. It will be useful for companies that would like to expand into different industries or to expand their existing operations in a new region.
The Grid-Scale Battery Storage Market Has Seen Remarkable Growth in Recent Years
the grid-scale battery storage market has seen remarkable growth in recent years and is expected to continue expanding in the future. The increasing demand for renewable energy sources, coupled with advancements in battery technology, has made large-scale battery storage systems a cost-effective solution for grid stability and reliability.
The deployment of grid-scale battery storage systems has several benefits, such as reducing reliance on fossil fuels, improving grid flexibility and resiliency, and reducing energy costs. Additionally, the rise of electric vehicles has created a new market for second-life batteries, where used EV batteries can be repurposed for stationary energy storage applications.
Various factors, such as government policies and regulations, technological advancements, and declining costs, are driving the growth of the grid-scale battery storage market. However, the market still faces challenges, such as high initial costs, limited technological maturity, and regulatory barriers.
In the long term, the grid-scale battery storage market is expected to witness significant growth, driven by increasing renewable energy penetration, declining battery costs, and favourable government policies. As such, the market presents significant opportunities for investors, battery manufacturers, and energy companies looking to participate in the transition to a cleaner and more sustainable energy future.
What Questions Should You Ask before Buying a Market Research Report?
• How is the grid scale stationary battery storage market evolving?
• What is driving and restraining the grid scale stationary battery storage market?
• How will each grid scale stationary battery storage submarket segment grow over the forecast period and how much revenue will these submarkets account for in 2033?
• How will the market shares for each grid scale stationary battery storage submarket develop from 2023 to 2033?
• What will be the main driver for the overall market from 2023 to 2033?
• Will leading grid scale stationary battery storage markets broadly follow the macroeconomic dynamics, or will individual national markets outperform others?
• How will the market shares of the national markets change by 2033 and which geographical region will lead the market in 2033?
• Who are the leading players and what are their prospects over the forecast period?
• What are the grid scale stationary battery storage projects for these leading companies?
• How will the industry evolve during the period between 2023 and 2033? What are the implications of grid scale stationary battery storage projects taking place now and over the next 10 years?
• Is there a greater need for product commercialisation to further scale the grid scale stationary battery storage market?
• Where is the grid scale stationary battery storage market heading and how can you ensure you are at the forefront of the market?
• What are the best investment options for new product and service lines?
• What are the key prospects for moving companies into a new growth path and C-suite?
You need to discover how this will impact the grid scale stationary battery storage market today, and over the next 10 years:
• Our 342-page report provides 139 tables and 204 charts/graphs exclusively to you.
• The report highlights key lucrative areas in the industry so you can target them – NOW.
• It contains in-depth analysis of global, regional and national sales and growth.
• It highlights for you the key successful trends, changes and revenue projections made by your competitors.
This report tells you TODAY how the grid scale stationary battery storage market will develop in the next 10 years, and in line with the variations in COVID-19 economic recession and bounce. This market is more critical now than at any point over the last 10 years.
Forecasts to 2033 and other analyses reveal commercial prospects
• In addition to revenue forecasting to 2033, our new study provides you with recent results, growth rates, and market shares.
• You will find original analyses, with business outlooks and developments.
• Discover qualitative analyses (including market dynamics, drivers, opportunities, restraints and challenges), cost structure, impact of rising grid scale stationary battery storage prices and recent developments.
This report includes data analysis and invaluable insight into how COVID-19 will affect the industry and your company. Four COVID-19 recovery patterns and their impact, namely, “V”, “L”, “W” and “U” are discussed in this report.
Segments Covered in the Report
Market Segment by Value and Volume
• Market Value (US$ Million)
• Market Volume (Cumulative Installed Capacity in MW)
Market Segment by Ownership-Model
• Utility Owned
• Third-Party Owned
• Other Ownership-Model
Market Segment by Application
• Renewable Integration
• Peak Shift
• Ancillary Services
• Back-Up Power
• Other Application
Market Segment by Type
• Lithium-Ion Battery
• Lead Acid Battery
• Flow Battery
• Sodium Based Battery
• Nickel–Cadmium Battery
• Other Type
In addition to the revenue predictions for the overall world market and segments, you will also find revenue forecasts for four regional and 20 leading national markets:
North America
• U.S.
• Canada
Europe
• Germany
• Spain
• United Kingdom
• France
• Italy
• Rest of Europe
Asia Pacific
• China
• Japan
• India
• Australia
• South Korea
• Rest of Asia Pacific
Latin America
• Brazil
• Mexico
• Rest of Latin America
Middle East & Africa
• GCC
• South Africa
• Rest of Middle East & Africa
The report also includes profiles and for some of the leading companies in the Grid Scale Stationary Battery Storage Market, 2023 to 2033, with a focus on this segment of these companies’ operations.
Leading companies and the potential for market growth
• ABB Ltd
• BYD Co. Ltd.
• Fluence Energy
• General Electric Company
• Hitachi, Ltd
• Kokam
• LG Chem
• Maxwell Technologies Inc.
• NEC Energy Solutions
• Orion Energy Systems, Inc.
• Panasonic Holdings Corporation
• Saft Groupe SAS
• Samsung SDI Co., Ltd.
• Siemens Energy AG
• Tesla Energy Operations, Inc.
Overall world revenue for Grid Scale Stationary Battery Storage Market, 2023 to 2033 in terms of value the market will surpass US$3,006 million in 2023, our work calculates. We predict strong revenue growth through to 2033. Our work identifies which organizations hold the greatest potential. Discover their capabilities, progress, and commercial prospects, helping you stay ahead.
How will the Grid Scale Stationary Battery Storage Market, 2023 to 2033 report help you?
In summary, our 340+ page report provides you with the following knowledge:
• Revenue forecasts to 2033 for Grid Scale Stationary Battery Storage Market, 2023 to 2033 Market, with forecasts for ownership-model, type, and application, each forecast at a global and regional level – discover the industry’s prospects, finding the most lucrative places for investments and revenues.
• Revenue forecasts to 2033 for four regional and 20 key national markets – See forecasts for the Grid Scale Stationary Battery Storage Market, 2023 to 2033 market in North America, Europe, Asia-Pacific, Latin America and Middle East & Africa. Also forecasted is the market in the US, Canada, Brazil, Germany, France, UK, Italy, China, India, Japan, and Australia among other prominent economies.
• Prospects for established firms and those seeking to enter the market – including company profiles for 15 of the major companies involved in the Grid Scale Stationary Battery Storage Market, 2023 to 2033.
Find quantitative and qualitative analyses with independent predictions. Receive information that only our report contains, staying informed with invaluable business intelligence.
Information found nowhere else
With our new report, you are less likely to fall behind in knowledge or miss out on opportunities. See how our work could benefit your research, analyses, and decisions. Visiongain’s study is for everybody needing commercial analyses for the Grid Scale Stationary Battery Storage Market, 2023 to 2033, market-leading companies. You will find data, trends and predictions.
ページTOPに戻る
Table of Contents
Table of Contents
1 Report Overview
1.1 Objectives of the Study
1.2 Introduction to Grid Scale Stationery Battery Storage Market
1.3 What This Report Delivers
1.4 Why You Should Read This Report
1.5 Key Questions Answered by This Analytical Report
1.6 Who is This Report for?
1.7 Research Methodology
1.7.1 Market Definitions
1.7.2 Market Evaluation & Forecasting Methodology
1.7.3 Data Validation
1.7.3.1 Primary Research
1.7.3.2 Secondary Research
1.8 Frequently Asked Questions (FAQs)
1.9 Associated Visiongain Reports
1.10 About Visiongain
2 Executive Summary
2.1.1 Grid Scale Stationery Battery Storage Market by Ownership-Model: Market Attractiveness Index
2.1.2 Grid Scale Stationery Battery Storage Market by Application: Market Attractiveness Index
2.1.3 Grid Scale Stationery Battery Storage Market by Type: Market Attractiveness Index
2.1.4 Grid Scale Stationery Battery Storage Market by Region: Market Attractiveness Index
3 Market Overview
3.1 Key Findings
3.2 Supply chain
3.3 Market Dynamics
3.3.1 Market Driving Factors
3.3.1.1 Growing Investments Towards Sustainable Energy Resources
3.3.1.2 Increasing Demand for Electric Vehicles
3.3.1.3 Grid Modernization is Also Driving the Market Growth
3.3.2 Market Restraining Factors
3.3.2.4 Safety Concerns Associated with Grid Scale Battery Storage
3.3.2.5 Lack of Standardization is Another Challenge
3.3.2.6 Outdated Regulatory Policy and Market Design
3.3.3 Market Opportunities
3.3.3.7 Financial Incentives for Storage Investment
3.3.3.8 Battery Storage has Lower Transmission Costs
3.3.3.9 Global Renewable Energy Campaign
3.4 COVID-19 Impact Analysis
3.5 Porter’s Five Forces Analysis
3.5.1 Threat of New Entrants- High
3.5.2 Bargaining Power of Suppliers - High
3.5.3 Bargaining Power of Buyers- High
3.5.4 Threat of Substitutes- Low to Medium
3.5.5 Intensity of Competitive Rivalry- High
3.6 PEST Analysis
3.6.1 Political Factors
3.6.2 Economic Factors
3.6.3 Social Factors
3.6.4 Technological Factors
4 Grid Scale Stationery Battery Storage Market Analysis by Ownership-Model
4.1 Key Findings
4.2 Ownership-Model Segment: Market Attractiveness Index
4.2.1 Grid Scale Stationery Battery Storage Market Size Estimation and Forecast by Ownership-Model
4.3 Utility Owned
4.3.1 Market Size by Region, 2023-2033 (US$ Mn)
4.3.2 Market Share by Region, 2023 & 2033 (%)
4.4 Third-Party Owned
4.4.1 Market Size by Region, 2023-2033 (US$ Mn)
4.4.2 Market Share by Region, 2023 & 2033 (%)
4.5 Other Ownership-Model
4.5.1 Market Size by Region, 2023-2033 (US$ Mn)
4.5.2 Market Share by Region, 2023 & 2033 (%)
5 Grid Scale Stationery Battery Storage Market Analysis by Application
5.1 Key Findings
5.2 Application Segment: Market Attractiveness Index
5.2.1 Grid Scale Stationery Battery Storage Market Size Estimation and Forecast by Application
5.3 Renewable Integration
5.3.1 Market Size by Region, 2023-2033 (US$ Mn)
5.3.2 Market Share by Region, 2023 & 2033 (%)
5.4 Peak Shift
5.4.1 Market Size by Region, 2023-2033 (US$ Mn)
5.4.2 Market Share by Region, 2023 & 2033 (%)
5.5 Ancillary Services
5.5.1 Market Size by Region, 2023-2033 (US$ Mn)
5.5.2 Market Share by Region, 2023 & 2033 (%)
5.6 Back-Up Power
5.6.1 Market Size by Region, 2023-2033 (US$ Mn)
5.6.2 Market Share by Region, 2023 & 2033 (%)
5.7 Other Application
5.7.1 Microgrids
5.7.2 Transmission and Distribution Upgrades
5.7.3 Market Size by Region, 2023-2033 (US$ Mn)
5.7.4 Market Share by Region, 2023 & 2033 (%)
6 Grid Scale Stationery Battery Storage Market Analysis by Type
6.1 Key Findings
6.2 Type Segment: Market Attractiveness Index
6.3 Grid Scale Stationery Battery Storage Market Size Estimation and Forecast by Type
6.4 Lithium-Ion Battery
6.4.1 Market Size by Region, 2023-2033 (US$ Mn)
6.4.2 Market Share by Region, 2023 & 2033 (%)
6.5 Lead Acid Battery
6.5.1 Market Size by Region, 2023-2033 (US$ Mn)
6.5.2 Market Share by Region, 2023 & 2033 (%)
6.6 Flow Battery
6.6.1 Market Size by Region, 2023-2033 (US$ Mn)
6.6.2 Market Share by Region, 2023 & 2033 (%)
6.7 Sodium Based Battery
6.7.1 Market Size by Region, 2023-2033 (US$ Mn)
6.7.2 Market Share by Region, 2023 & 2033 (%)
6.8 Nickel–Cadmium Battery
6.8.1 Market Size by Region, 2023-2033 (US$ Mn)
6.8.2 Market Share by Region, 2023 & 2033 (%)
6.9 Other Type
6.9.1 Zinc-carbon battery
6.9.2 Nickel-metal hydride (NiMH) battery
6.9.3 Market Size by Region, 2023-2033 (US$ Mn)
6.9.4 Market Share by Region, 2023 & 2033 (%)
7 Grid Scale Stationery Battery Storage Market Analysis by Region
7.1 Key Findings
7.1.1 Global Grid Scale Stationary Battery Storage Market by Region
8 North America Grid Scale Stationery Battery Storage Market Analysis
8.1 Key Findings
8.2 North America Grid Scale Stationery Battery Storage Market Attractiveness Index
8.3 North America Grid Scale Stationery Battery Storage Market Size Estimation and Forecast
8.4 North America Grid Scale Stationary Battery Storage Market by Cumulative Installed Capacity
8.5 North America Grid Scale Stationary Battery Storage Country Market by Cumulative Installed Capacity
8.6 North America Grid Scale Stationery Battery Storage Market Size Estimation and Forecast by Country
8.7 North America Grid Scale Stationery Battery Storage Market Size Estimation and Forecast by Ownership-Model
8.8 North America Grid Scale Stationery Battery Storage Market Size Estimation and Forecast by Application
8.9 North America Grid Scale Stationery Battery Storage Market Size Estimation and Forecast by Type
8.10 U.S. Grid Scale Stationery Battery Storage Market Analysis
8.11 Canada Grid Scale Stationery Battery Storage Market Analysis
9 Europe Grid Scale Stationery Battery Storage Market Analysis
9.1 Key Findings
9.2 Europe Grid Scale Stationery Battery Storage Market Attractiveness Index
9.3 Europe Grid Scale Stationery Battery Storage Market Size Estimation and Forecast
9.4 Europe Grid Scale Stationary Battery Storage Market by Cumulative Installed Capacity
9.5 Europe Grid Scale Stationary Battery Storage Country Market by Cumulative Installed Capacity
9.6 Europe Grid Scale Stationery Battery Storage Market Size Estimation and Forecast by Country
9.7 Europe Grid Scale Stationery Battery Storage Market Size Estimation and Forecast by Ownership-Model
9.8 Europe Grid Scale Stationery Battery Storage Market Size Estimation and Forecast by Application
9.9 Europe Grid Scale Stationery Battery Storage Market Size Estimation and Forecast by Type
9.10 Germany Grid Scale Stationery Battery Storage Market Analysis
9.11 UK Grid Scale Stationery Battery Storage Market Analysis
9.12 France Grid Scale Stationery Battery Storage Market Analysis
9.13 Italy Grid Scale Stationery Battery Storage Market Analysis
9.14 Spain Grid Scale Stationery Battery Storage Market Analysis
9.15 Rest of Europe Grid Scale Stationery Battery Storage Market Analysis
10 Asia-Pacific Grid Scale Stationery Battery Storage Market Analysis
10.1 Key Findings
10.2 Asia-Pacific Grid Scale Stationery Battery Storage Market Attractiveness Index
10.3 Asia-Pacific Grid Scale Stationery Battery Storage Market Size Estimation and Forecast
10.4 Asia-Pacific Grid Scale Stationary Battery Storage Market by Cumulative Installed Capacity
10.5 Asia-Pacific Grid Scale Stationary Battery Storage Country Market by Cumulative Installed Capacity
10.6 Asia-Pacific Grid Scale Stationery Battery Storage Market Size Estimation and Forecast by Country
10.7 Asia-Pacific Grid Scale Stationery Battery Storage Market Size Estimation and Forecast by Ownership-Model
10.8 Asia-Pacific Grid Scale Stationery Battery Storage Market Size Estimation and Forecast by Application
10.9 Asia-Pacific Grid Scale Stationery Battery Storage Market Size Estimation and Forecast by Type
10.10 China Grid Scale Stationery Battery Storage Market Analysis
10.11 India Grid Scale Stationery Battery Storage Market Analysis
10.12 Japan Grid Scale Stationery Battery Storage Market Analysis
10.13 Australia Grid Scale Stationery Battery Storage Market Analysis
10.14 South Korea Grid Scale Stationery Battery Storage Market Analysis
10.15 Rest of Asia-Pacific Grid Scale Stationery Battery Storage Market Analysis
11 Middle East & Africa Grid Scale Stationery Battery Storage Market Analysis
11.1 Key Findings
11.2 Middle East & Africa Grid Scale Stationery Battery Storage Market Attractiveness Index
11.3 Middle East & Africa Grid Scale Stationery Battery Storage Market Size Estimation and Forecast
11.4 Middle East & Africa Grid Scale Stationary Battery Storage Market by Cumulative Installed Capacity
11.5 Middle East & Africa Grid Scale Stationary Battery Storage Country Market by Cumulative Installed Capacity
11.6 Middle East & Africa Grid Scale Stationery Battery Storage Market Size Estimation and Forecast by Country
11.7 Middle East & Africa Grid Scale Stationery Battery Storage Market Size Estimation and Forecast by Ownership-Model
11.8 Middle East & Africa Grid Scale Stationery Battery Storage Market Size Estimation and Forecast by Application
11.9 Middle East & Africa Grid Scale Stationery Battery Storage Market Size Estimation and Forecast by Type
11.10 GCC Grid Scale Stationery Battery Storage Market Analysis
11.11 South Africa Grid Scale Stationery Battery Storage Market Analysis
11.12 Rest of Middle East & Africa Grid Scale Stationery Battery Storage Market Analysis
12 Latin America Grid Scale Stationery Battery Storage Market Analysis
12.1 Key Findings
12.2 Latin America Grid Scale Stationery Battery Storage Market Attractiveness Index
12.3 Latin America Grid Scale Stationery Battery Storage Market Size Estimation and Forecast
12.4 Latin America Grid Scale Stationary Battery Storage Market by Cumulative Installed Capacity
12.5 Latin America Grid Scale Stationary Battery Storage Country Market by Cumulative Installed Capacity
12.6 Latin America Grid Scale Stationery Battery Storage Market Size Estimation and Forecast by Country
12.7 Latin America Grid Scale Stationery Battery Storage Market Size Estimation and Forecast by Ownership-Model
12.8 Latin America Grid Scale Stationery Battery Storage Market Size Estimation and Forecast by Application
12.9 Latin America Grid Scale Stationery Battery Storage Market Size Estimation and Forecast by Type
12.10 Brazil Grid Scale Stationery Battery Storage Market Analysis
12.11 Mexico Grid Scale Stationery Battery Storage Market Analysis
12.12 Rest of Latin America Grid Scale Stationery Battery Storage Market Analysis
13 Company Profiles
13.1 Competitive Landscape, 2022
13.2 Strategic Outlook
13.2.1 Key Business Strategy
13.3 Tesla Energy Operations, Inc.
13.3.1 Company Snapshot
13.3.2 Company Overview
13.3.3 Financial Analysis
13.3.3.1 Net Revenue, 2018-2022
13.3.3.2 R&D, 2018-2022
13.3.3.3 Regional Revenue Shares, 2022 (%)
13.3.3.4 Business Segment Revenue Shares, 2022 (%)
13.3.4 Product Benchmarking
13.4 LG Chem
13.4.1 Company Snapshot
13.4.2 Company Overview
13.4.3 Financial Analysis
13.4.3.1 Net Revenue, 2018-2022
13.4.3.2 R&D, 2018-2022
13.4.3.3 Regional Revenue Shares, 2022 (%)
13.4.3.4 Business Segment Revenue Shares, 2022 (%)
13.4.4 Product Benchmarking
13.4.5 Strategic Outlook
13.5 BYD Co. Ltd.
13.5.1 Company Snapshot
13.5.2 Company Overview
13.5.3 Financial Analysis
13.5.3.1 Net Revenue, 2017-2021
13.5.3.2 R&D, 2017-2021
13.5.3.3 Regional Revenue Shares, 2021 (%)
13.5.4 Product Benchmarking
13.6 Fluence Energy
13.6.1 Company Snapshot
13.6.2 Company Overview
13.6.3 Financial Analysis
13.6.3.1 Net Revenue, 2018-2022
13.6.3.2 R&D, 2018-2022
13.6.4 Product Benchmarking
13.6.5 Strategic Outlook
13.7 Samsung SDI Co., Ltd.
13.7.1 Company Snapshot
13.7.2 Company Overview
13.7.3 Financial Analysis
13.7.3.1 Net Revenue, 2018-2022
13.7.3.2 R&D, 2018-2022
13.7.3.3 Regional Revenue Shares, 2022 (%)
13.7.3.4 Business Segment Revenue Shares, 2022 (%)
13.7.4 Product Benchmarking
13.8 Saft Groupe SAS
13.8.1 Company Snapshot
13.8.2 Company Overview
13.8.3 Financial Analysis
13.8.3.1 Net Revenue, 2018-2022
13.8.3.2 R&D, 2018-2022
13.8.3.3 Regional Revenue Shares, 2022 (%)
13.8.3.4 Business Segment Revenue Shares, 2022 (%)
13.8.4 Product Benchmarking
13.8.5 Strategic Outlook
13.9 General Electric Company
13.9.1 Company Snapshot
13.9.2 Company Overview
13.9.3 Financial Analysis
13.9.3.1 Net Revenue, 2018-2022
13.9.3.2 R&D, 2018-2022
13.9.3.3 Regional Revenue Shares, 2022 (%)
13.9.3.4 Business Segment Revenue Shares, 2022 (%)
13.9.4 Product Benchmarking
13.10 Siemens Energy AG
13.10.1 Company Snapshot
13.10.2 Company Overview
13.10.3 Financial Analysis
13.10.3.1 Net Revenue, 2018-2022
13.10.3.2 R&D, 2018-2022
13.10.3.3 Regional Revenue Shares, 2022 (%)
13.10.3.4 Business Segment Revenue Shares, 2022 (%)
13.10.4 Product Benchmarking
13.10.5 Strategic Outlook
13.11 Panasonic Holdings Corporation
13.11.1 Company Snapshot
13.11.2 Company Overview
13.11.3 Financial Analysis
13.11.3.1 Net Revenue, 2018-2022
13.11.3.2 R&D, 2018-2022
13.11.3.3 Regional Revenue Shares, 2022 (%)
13.11.3.4 Business Segment Revenue Shares, 2022 (%)
13.11.4 Product Benchmarking
13.12 Hitachi, Ltd
13.12.1 Company Snapshot
13.12.2 Company Overview
13.12.3 Financial Analysis
13.12.3.1 Net Revenue, 2018-2022
13.12.3.2 Regional Revenue Shares, 2022 (%)
13.12.3.3 Business Segment Revenue Shares, 2022 (%)
13.12.4 Product Benchmarking
13.12.5 Strategic Outlook
13.13 ABB Ltd
13.13.1 Company Snapshot
13.13.2 Company Overview
13.13.3 Financial Analysis
13.13.3.1 Net Revenue, 2018-2022
13.13.3.2 R&D, 2018-2022
13.13.3.3 Regional Revenue Shares, 2022 (%)
13.13.3.4 Business Segment Revenue Shares, 2022 (%)
13.13.4 Product Benchmarking
13.13.5 Strategic Outlook
13.14 Orion Energy Systems, Inc
13.14.1 Company Snapshot
13.14.2 Company Overview
13.14.3 Financial Analysis
13.14.3.1 Net Revenue, 2018-2022
13.14.3.2 R&D, 2018-2022
13.14.4 Product Benchmarking
13.15 Maxwell Technologies Inc.
13.15.1 Company Snapshot
13.15.2 Company Overview
13.15.3 Financial Analysis
13.15.3.1 Net Revenue, 2018-2022
13.15.3.2 R&D, 2018-2022
13.15.3.3 Regional Revenue Shares, 2022 (%)
13.15.3.4 Business Segment Revenue Shares, 2022 (%)
13.15.4 Product Benchmarking
13.15.5 Strategic Outlook
13.16 NEC Energy Solutions
13.16.1 Company Snapshot
13.16.2 Company Overview
13.16.3 Product Benchmarking
13.17 Kokam
13.17.1 Company Snapshot
13.17.2 Company Overview
13.17.3 Product Benchmarking
14 Conclusion and Recommendations
14.1 Concluding Remarks from Visiongain
14.2 Recommendations for Market Players
ページTOPに戻る
List of Tables/Graphs
List of Tables
Table 1 Grid Scale Stationery Battery Storage Market Snapshot, 2023 & 2033 (US$ million, CAGR %)
Table 2 Global Grid Scale Stationary Battery Storage Market Forecast, 2023-2033 (US$ Mn, AGR (%), CAGR (%)) (V-Shaped Recovery Scenario)
Table 3 Global Grid Scale Stationary Battery Storage Market by Region, 2023-2033 (US$ Mn, AGR (%), CAGR (%)) (V-Shaped Recovery Scenario)
Table 4 Global Grid Scale Stationary Battery Storage Market Forecast, 2023-2033 (US$ Mn, AGR (%), CAGR (%)) (W-Shaped Recovery Scenario)
Table 5 Global Grid Scale Stationary Battery Storage Market by Region, 2023-2033 (US$ Mn, AGR (%), CAGR (%)) (W-Shaped Recovery Scenario)
Table 6 Global Grid Scale Stationary Battery Storage Market Forecast, 2023-2033 (US$ Mn, AGR (%), CAGR (%)) (U-Shaped Recovery Scenario)
Table 7 Global Grid Scale Stationary Battery Storage Market by Region, 2023-2033 (US$ Mn, AGR (%), CAGR (%)) (U-Shaped Recovery Scenario)
Table 8 Global Grid Scale Stationary Battery Storage Market Forecast, 2023-2033 (US$ Mn, AGR (%), CAGR (%)) (L-Shaped Recovery Scenario)
Table 9 Global Grid Scale Stationary Battery Storage Market by Region, 2023-2033 (US$ Mn, AGR (%), CAGR (%)) (L-Shaped Recovery Scenario)
Table 10 Global Grid Scale Stationary Battery Storage Market by Ownership-Model, 2023-2033 (US$ Mn, AGR (%), CAGR (%))
Table 11 Utility Owned Market by Region, 2023-2033 (US$ Mn, AGR (%), CAGR (%))
Table 12 Third-Party Owned Market by Region, 2023-2033 (US$ Mn, AGR (%), CAGR (%))
Table 13 Other Ownership-Model Market by Region, 2023-2033 (US$ Mn, AGR (%), CAGR (%))
Table 14 Global Grid Scale Stationary Battery Storage Market by Application, 2023-2033 (US$ Mn, AGR (%), CAGR (%))
Table 15 Renewable Integration Market by Region, 2023-2033 (US$ Mn, AGR (%), CAGR (%))
Table 16 Peak Shift Market by Region, 2023-2033 (US$ Mn, AGR (%), CAGR (%))
Table 17 Ancillary Services Market by Region, 2023-2033 (US$ Mn, AGR (%), CAGR (%))
Table 18 Back-Up Power Market by Region, 2023-2033 (US$ Mn, AGR (%), CAGR (%))
Table 19 Other Application Market by Region, 2023-2033 (US$ Mn, AGR (%), CAGR (%))
Table 20 Global Grid Scale Stationary Battery Storage Market by Type, 2023-2033 (US$ Mn, AGR (%), CAGR (%))
Table 21 Lithium-Ion Battery Market by Region, 2023-2033 (US$ Mn, AGR (%), CAGR (%))
Table 22 Lead Acid Battery Market by Region, 2023-2033 (US$ Mn, AGR (%), CAGR (%))
Table 23 Flow Battery Market by Region, 2023-2033 (US$ Mn, AGR (%), CAGR (%))
Table 24 Sodium Based Battery Market by Region, 2023-2033 (US$ Mn, AGR (%), CAGR (%))
Table 25 Nickel–Cadmium Battery Market by Region, 2023-2033 (US$ Mn, AGR (%), CAGR (%))
Table 26 Other Type Market by Region, 2023-2033 (US$ Mn, AGR (%), CAGR (%))
Table 27 Global Grid Scale Stationary Battery Storage Market by Region, 2023-2033 (US$ Mn, AGR (%), CAGR (%))
Table 28 North America Grid Scale Stationary Battery Storage Market by Cumulative Installed Capacity, 2023-2033 (MW, AGR (%), CAGR (%))
Table 29 North America Grid Scale Stationary Battery Storage Market by Cumulative Installed Capacity, 2023-2033 (MW, AGR (%), CAGR (%))
Table 30 North America Grid Scale Stationary Battery Storage Market by Country, 2023-2033 (US$ Mn, AGR (%), CAGR (%))
Table 31 North America Grid Scale Stationary Battery Storage Market by Ownership-Model, 2023-2033 (US$ Mn, AGR (%), CAGR (%))
Table 32 North America Grid Scale Stationary Battery Storage Market by Application, 2023-2033 (US$ Mn, AGR (%), CAGR (%))
Table 33 North America Grid Scale Stationary Battery Storage Market by Type, 2023-2033 (US$ Mn, AGR (%), CAGR (%))
Table 34 US Grid Scale Stationary Battery Storage Market by Value, 2023-2033 (US$ Mn, AGR (%), CAGR (%))
Table 35 US Grid Scale Stationary Battery Stor0age Market by Cumulative Installed Capacity, 2023-2033 (MW, AGR (%), CAGR (%))
Table 36 Canada Grid Scale Stationary Battery Storage Market by Value, 2023-2033 (US$ Mn, AGR (%), CAGR (%))
Table 37 Canada Grid Scale Stationary Battery Storage Market by Cumulative Installed Capacity, 2023-2033 (MW, AGR (%), CAGR (%))
Table 38 Europe Grid Scale Stationary Battery Storage Market by Value, 2023-2033 (US$ Mn, AGR (%), CAGR (%))
Table 39 Europe Grid Scale Stationary Battery Storage Market by Cumulative Installed Capacity, 2023-2033 (MW, AGR (%), CAGR (%))
Table 40 Europe Grid Scale Stationary Battery Storage Market by Country, 2023-2033 (MW, AGR (%), CAGR (%))
Table 41 Europe Grid Scale Stationary Battery Storage Market by Country, 2023-2033 (US$ Mn, AGR (%), CAGR (%))
Table 42 Europe Grid Scale Stationary Battery Storage Market by Ownership-Model, 2023-2033 (US$ Mn, AGR (%), CAGR (%))
Table 43 Europe Grid Scale Stationary Battery Storage Market by Application, 2023-2033 (US$ Mn, AGR (%), CAGR (%))
Table 44 Europe Grid Scale Stationary Battery Storage Market by Type, 2023-2033 (US$ Mn, AGR (%), CAGR (%))
Table 45 Germany Grid Scale Stationary Battery Storage Market by Value, 2023-2033 (US$ Mn, AGR (%), CAGR (%))
Table 46 Germany Grid Scale Stationary Battery Storage Market by Cumulative Installed Capacity, 2023-2033 (MW, AGR (%), CAGR (%))
Table 47 UK Grid Scale Stationary Battery Storage Market by Value, 2023-2033 (US$ Mn, AGR (%), CAGR (%))
Table 48 UK Grid Scale Stationary Battery Storage Market by Cumulative Installed Capacity, 2023-2033 (MW, AGR (%), CAGR (%))
Table 49 France Grid Scale Stationary Battery Storage Market by Value, 2023-2033 (US$ Mn, AGR (%), CAGR (%))
Table 50 France Grid Scale Stationary Battery Storage Market by Cumulative Installed Capacity, 2023-2033 (MW, AGR (%), CAGR (%))
Table 51 Italy Grid Scale Stationary Battery Storage Market by Value, 2023-2033 (US$ Mn, AGR (%), CAGR (%))
Table 52 Italy Grid Scale Stationary Battery Storage Market by Cumulative Installed Capacity, 2023-2033 (MW, AGR (%), CAGR (%))
Table 53 Spain Grid Scale Stationary Battery Storage Market by Value, 2023-2033 (US$ Mn, AGR (%), CAGR (%))
Table 54 Spain Grid Scale Stationary Battery Storage Market by Cumulative Installed Capacity, 2023-2033 (MW, AGR (%), CAGR (%))
Table 55 Rest of Europe Grid Scale Stationary Battery Storage Market by Value, 2023-2033 (US$ Mn, AGR (%), CAGR (%))
Table 56 Rest of Europe Grid Scale Stationary Battery Storage Market by Cumulative Installed Capacity, 2023-2033 (MW, AGR (%), CAGR (%))
Table 57 Asia-Pacific Grid Scale Stationary Battery Storage Market by Value, 2023-2033 (US$ Mn, AGR (%), CAGR (%))
Table 58 Asia-Pacific Grid Scale Stationary Battery Storage Market by Cumulative Installed Capacity, 2023-2033 (MW, AGR (%), CAGR (%))
Table 59 Asia-Pacific Grid Scale Stationary Battery Storage Market Cumulative Installed Capacity, by Country, 2023-2033 (MW, AGR (%), CAGR (%))
Table 60 Asia-Pacific Grid Scale Stationary Battery Storage Market by Country, 2023-2033 (US$ Mn, AGR (%), CAGR (%))
Table 61 Asia-Pacific Grid Scale Stationary Battery Storage Market by Ownership-Model, 2023-2033 (US$ Mn, AGR (%), CAGR (%))
Table 62 Asia-Pacific Grid Scale Stationary Battery Storage Market by Application, 2023-2033 (US$ Mn, AGR (%), CAGR (%))
Table 63 Asia-Pacific Grid Scale Stationary Battery Storage Market by Type, 2023-2033 (US$ Mn, AGR (%), CAGR (%))
Table 64 China Grid Scale Stationary Battery Storage Market by Value, 2023-2033 (US$ Mn, AGR (%), CAGR (%))
Table 65 China Grid Scale Stationary Battery Storage Market by Cumulative Installed Capacity, 2023-2033 (MW, AGR (%), CAGR (%))
Table 66 India Grid Scale Stationary Battery Storage Market by Value, 2023-2033 (US$ Mn, AGR (%), CAGR (%))
Table 67 India Grid Scale Stationary Battery Storage Market by Cumulative Installed Capacity, 2023-2033 (MW, AGR (%), CAGR (%))
Table 68 Japan Grid Scale Stationary Battery Storage Market by Value, 2023-2033 (US$ Mn, AGR (%), CAGR (%))
Table 69 Japan Grid Scale Stationary Battery Storage Market by Cumulative Installed Capacity, 2023-2033 (MW, AGR (%), CAGR (%))
Table 70 Australia Grid Scale Stationary Battery Storage Market by Value, 2023-2033 (US$ Mn, AGR (%), CAGR (%))
Table 71 Australia Grid Scale Stationary Battery Storage Market by Cumulative Installed Capacity, 2023-2033 (MW, AGR (%), CAGR (%))
Table 72 South Korea Grid Scale Stationary Battery Storage Market by Value, 2023-2033 (US$ Mn, AGR (%), CAGR (%))
Table 73 South Korea Grid Scale Stationary Battery Storage Market by Cumulative Installed Capacity, 2023-2033 (MW, AGR (%), CAGR (%))
Table 74 Rest of Asia-Pacific Grid Scale Stationary Battery Storage Market by Value, 2023-2033 (US$ Mn, AGR (%), CAGR (%))
Table 75 Rest of Asia-Pacific Grid Scale Stationary Battery Storage Market by Cumulative Installed Capacity, 2023-2033 (MW, AGR (%), CAGR (%))
Table 76 Middle East & Africa Grid Scale Stationary Battery Storage Market by Value, 2023-2033 (US$ Mn, AGR (%), CAGR (%))
Table 77 Middle East & Africa Grid Scale Stationary Battery Storage Market by Cumulative Installed Capacity, 2023-2033 (MW, AGR (%), CAGR (%))
Table 78 Middle East & Africa Grid Scale Stationary Battery Storage Market by Cumulative Installed Capacity by Country, 2023-2033 (MW, AGR (%), CAGR (%))
Table 79 Middle East & Africa Grid Scale Stationary Battery Storage Market by Country, 2023-2033 (US$ Mn, AGR (%), CAGR (%))
Table 80 Middle East & Africa Grid Scale Stationary Battery Storage Market by Ownership-Model, 2023-2033 (US$ Mn, AGR (%), CAGR (%))
Table 81 Middle East & Africa Grid Scale Stationary Battery Storage Market by Application, 2023-2033 (US$ Mn, AGR (%), CAGR (%))
Table 82 Middle East & Africa Grid Scale Stationary Battery Storage Market by Type, 2023-2033 (US$ Mn, AGR (%), CAGR (%))
Table 83 GCC Grid Scale Stationary Battery Storage Market by Value, 2023-2033 (US$ Mn, AGR (%), CAGR (%))
Table 84 GCC Grid Scale Stationary Battery Storage Market by Cumulative Installed Capacity, 2023-2033 (MW, AGR (%), CAGR (%))
Table 85 South Africa Grid Scale Stationary Battery Storage Market by Value, 2023-2033 (US$ Mn, AGR (%), CAGR (%))
Table 86 South Africa Grid Scale Stationary Battery Storage Market by Cumulative Installed Capacity, 2023-2033 (MW, AGR (%), CAGR (%))
Table 87 Rest of Middle East & Africa Grid Scale Stationary Battery Storage Market by Value, 2023-2033 (US$ Mn, AGR (%), CAGR (%))
Table 88 Rest of Middle East & Africa Grid Scale Stationary Battery Storage Market by Cumulative Installed Capacity, 2023-2033 (MW, AGR (%), CAGR (%))
Table 89 Latin America Grid Scale Stationary Battery Storage Market by Value, 2023-2033 (US$ Mn, AGR (%), CAGR (%))
Table 90 Latin America Grid Scale Stationary Battery Storage Market by Cumulative Installed Capacity, 2023-2033 (MW, AGR (%), CAGR (%))
Table 91 Latin America Grid Scale Stationary Battery Storage Market Cumulative Installed Capacity, by Country, 2023-2033 (MW, AGR (%), CAGR (%))
Table 92 Latin America Grid Scale Stationary Battery Storage Market by Country, 2023-2033 (US$ Mn, AGR (%), CAGR (%))
Table 93 Latin America Grid Scale Stationary Battery Storage Market by Ownership-Model, 2023-2033 (US$ Mn, AGR (%), CAGR (%))
Table 94 Latin America Grid Scale Stationary Battery Storage Market by Application, 2023-2033 (US$ Mn, AGR (%), CAGR (%))
Table 95 Latin America Grid Scale Stationary Battery Storage Market by Type, 2023-2033 (US$ Mn, AGR (%), CAGR (%))
Table 96 Brazil Grid Scale Stationary Battery Storage Market by Value, 2023-2033 (US$ Mn, AGR (%), CAGR (%))
Table 97 Brazil Grid Scale Stationary Battery Storage Market by Cumulative Installed Capacity, 2023-2033 (MW, AGR (%), CAGR (%))
Table 98 Mexico Grid Scale Stationary Battery Storage Market by Value, 2023-2033 (US$ Mn, AGR (%), CAGR (%))
Table 99 Mexico Grid Scale Stationary Battery Storage Market by Cumulative Installed Capacity, 2023-2033 (MW, AGR (%), CAGR (%))
Table 100 Rest of Latin America Grid Scale Stationary Battery Storage Market by Value, 2023-2033 (US$ Mn, AGR (%), CAGR (%))
Table 101 Rest of Latin America Grid Scale Stationary Battery Storage Market by Cumulative Installed Capacity, 2023-2033 (MW, AGR (%), CAGR (%))
Table 102 Strategic Outlook
Table 103 Tesla Energy Operations, Inc.: Key Details, (CEO, HQ, Revenue, Founded, No. of Employees, Company Type, Website, Business Segment)
Table 104 Tesla Energy Operations, Inc.: Product Benchmarking
Table 105 LG Chem: Key Details, (CEO, HQ, Revenue, Founded, No. of Employees, Company Type, Website, Business Segment)
Table 106 LG Chem: Product Benchmarking
Table 107 LG Chem: Strategic Outlook
Table 108 BYD Co. Ltd.: Key Details, (CEO, HQ, Revenue, Founded, No. of Employees, Company Type, Website, Business Segment)
Table 109 BYD Co. Ltd.: Product Benchmarking
Table 110 Fluence Energy: Key Details, (CEO, HQ, Revenue, Founded, No. of Employees, Company Type, Website, Business Segment)
Table 111 Fluence Energy: Product Benchmarking
Table 112 Fluence Energy: Strategic Outlook
Table 113 Samsung SDI Co., Ltd.: Key Details, (CEO, HQ, Revenue, Founded, No. of Employees, Company Type, Website, Business Segment)
Table 114 Samsung SDI Co., Ltd.: Product Benchmarking
Table 115 Saft Groupe SAS: Key Details, (CEO, HQ, Revenue, Founded, No. of Employees, Company Type, Website, Business Segment)
Table 116 Saft Groupe SAS: Product Benchmarking
Table 117 Saft Groupe SAS: Strategic Outlook
Table 118 General Electric Company: Key Details, (CEO, HQ, Revenue, Founded, No. of Employees, Company Type, Website, Business Segment)
Table 119 General Electric Company: Product Benchmarking
Table 120 Siemens Energy AG: Key Details, (CEO, HQ, Revenue, Founded, No. of Employees, Company Type, Website, Business Segment)
Table 121 Siemens Energy AG: Product Benchmarking
Table 122 Siemens Energy AG: Strategic Outlook
Table 123 Panasonic Holdings Corporation: Key Details, (CEO, HQ, Revenue, Founded, No. of Employees, Company Type, Website, Business Segment)
Table 124 Panasonic Holdings Corporation: Product Benchmarking
Table 125 Hitachi, Ltd: Key Details, (CEO, HQ, Revenue, Founded, No. of Employees, Company Type, Website, Business Segment)
Table 126 Hitachi, Ltd: Product Benchmarking
Table 127 Hitachi, Ltd: Strategic Outlook
Table 128 ABB Ltd: Key Details, (CEO, HQ, Revenue, Founded, No. of Employees, Company Type, Website, Business Segment)
Table 129 ABB Ltd: Product Benchmarking
Table 130 ABB Ltd: Strategic Outlook
Table 131 Orion Energy Systems Inc.: Key Details, (CEO, HQ, Revenue, Founded, No. of Employees, Company Type, Website, Business Segment)
Table 132 Orion Energy Systems Inc.: Product Benchmarking
Table 133 Maxwell Technologies Inc.: Key Details, (CEO, HQ, Revenue, Founded, No. of Employees, Company Type, Website, Business Segment)
Table 134 Maxwell Technologies Inc.: Product Benchmarking
Table 135 Maxwell Technologies Inc.: Strategic Outlook
Table 136 NEC Energy Solutions: Key Details, (CEO, HQ, Revenue, Founded, No. of Employees, Company Type, Website, Business Segment)
Table 137 NEC Energy Solutions: Product Benchmarking
Table 138 Kokam: Key Details, (CEO, HQ, Revenue, Founded, No. of Employees, Company Type, Website, Business Segment)
Table 139 Kokam: Product Benchmarking
List of Figures
Figure 1 Grid Scale Stationery Battery Storage Market Segmentation
Figure 2 Grid Scale Stationery Battery Storage Market by Ownership-Model: Market Attractiveness Index
Figure 3 Grid Scale Stationery Battery Storage Market by Application: Market Attractiveness Index
Figure 4 Grid Scale Stationery Battery Storage Market by Type: Market Attractiveness Index
Figure 5 Grid Scale Stationery Battery Storage Market by Region: Market Attractiveness Index
Figure 6 Grid Scale Stationery Battery Storage Market: Market Dynamics
Figure 7 COVID Impact Analysis: Grid Scale Stationery Battery Storage Market Recovery Scenarios
Figure 8 Global Grid Scale Stationary Battery Storage Market Forecast, 2023-2033 (US$ Mn, AGR (%)) (V-Shaped Recovery Scenario)
Figure 9 Global Grid Scale Stationary Battery Storage Market by Region, 2023-2033 (US$ Mn, AGR (%)) (V-Shaped Recovery Scenario)
Figure 10 Global Grid Scale Stationary Battery Storage Market Forecast, 2023-2033 (US$ Mn, AGR (%)) (W-Shaped Recovery Scenario)
Figure 11 Global Grid Scale Stationary Battery Storage Market by Region, 2023-2033 (US$ Mn, AGR (%)) (W-Shaped Recovery Scenario)
Figure 12 Global Grid Scale Stationary Battery Storage Market Forecast, 2023-2033 (US$ Mn, AGR (%)) (U-Shaped Recovery Scenario)
Figure 13 Global Grid Scale Stationary Battery Storage Market by Region, 2023-2033 (US$ Mn, AGR (%)) (U-Shaped Recovery Scenario)
Figure 14 Global Grid Scale Stationary Battery Storage Market Forecast, 2023-2033 (US$ Mn, AGR (%)) (L-Shaped Recovery Scenario)
Figure 15 Global Grid Scale Stationary Battery Storage Market by Region, 2023-2033 (US$ Mn, AGR (%)) (L-Shaped Recovery Scenario)
Figure 16 Grid Scale Stationery Battery Storage Market: Porter’s Five Forces Analysis
Figure 17 Grid Scale Stationery Battery Storage Market: PEST Analysis
Figure 18 Grid Scale Stationery Battery Storage Market by ownership-model: Market Attractiveness Index
Figure 19 Global Grid Scale Stationary Battery Storage Market by Ownership-Model, 2023-2033 (US$ Mn, AGR (%))
Figure 20 Grid Scale Stationery Battery Storage Market Share Forecast by Ownership-Model, 2023 & 2033 (%)
Figure 21 Utility Owned Market by Region, 2023-2033 (US$ Mn, AGR (%))
Figure 22 Utility Owned Market Share Forecast by Region, 2023 & 2033 (%)
Figure 23 Third-Party Owned Market by Region, 2023-2033 (US$ Mn, AGR (%))
Figure 24 Third Party Owned Market Share Forecast by Region, 2023 & 2033 (%)
Figure 25 Other Ownership-Model Market by Region, 2023-2033 (US$ Mn, AGR (%))
Figure 26 Other Ownership-Model Market Share Forecast by Region, 2023 & 2033 (%)
Figure 27 Grid Scale Stationery Battery Storage Market by Application: Market Attractiveness Index
Figure 28 Global Grid Scale Stationary Battery Storage Market by Application, 2023-2033 (US$ Mn, AGR (%))
Figure 29 Grid Scale Stationery Battery Storage Market Share Forecast by Application, 2023 & 2033 (%)
Figure 30 Renewable Integration Market by Region, 2023-2033 (US$ Mn, AGR (%))
Figure 31 Renewable Integration Market Share Forecast by Region, 2023 & 2033 (%)
Figure 32 Peak Shift Market by Region, 2023-2033 (US$ Mn, AGR (%))
Figure 33 Peak Shift Market Share Forecast by Region, 2023 & 2033 (%)
Figure 34 Ancillary Services Market by Region, 2023-2033 (US$ Mn, AGR (%))
Figure 35 Ancillary Services Market Share Forecast by Region, 2023 & 2033 (%)
Figure 36 Back-Up Power Market by Region, 2023-2033 (US$ Mn, AGR (%))
Figure 37 Back-Up Power Market Share Forecast by Region, 2023 & 2033 (%)
Figure 38 Other Application Market by Region, 2023-2033 (US$ Mn, AGR (%))
Figure 39 Other Application Market Share Forecast by Region, 2023 & 2033 (%)
Figure 40 Grid Scale Stationery Battery Storage Market by Type: Market Attractiveness Index
Figure 41 Global Grid Scale Stationary Battery Storage Market by Type, 2023-2033 (US$ Mn, AGR (%))
Figure 42 Grid Scale Stationery Battery Storage Market Share Forecast by Type, 2023 & 2033 (%)
Figure 43 Lithium-Ion Battery Market by Region, 2023-2033 (US$ Mn, AGR (%))
Figure 44 Lithium- Ion Battery Market Share Forecast by Region, 2023 & 2033 (%)
Figure 45 Lead Acid Battery Market by Region, 2023-2033 (US$ Mn, AGR (%))
Figure 46 Lead Acid Battery Market Share Forecast by Region, 2023 & 2033 (%)
Figure 47 Flow Battery Market by Region, 2023-2033 (US$ Mn, AGR (%))
Figure 48 Flow Battery Market Share Forecast by Region, 2023 & 2033 (%)
Figure 49 Sodium Based Battery Market by Region, 2023-2033 (US$ Mn, AGR (%))
Figure 50 Sodium Based Battery Market Share Forecast by Region, 2023 & 2033 (%)
Figure 51 Nickel–Cadmium Battery Market by Region, 2023-2033 (US$ Mn, AGR (%))
Figure 52 Nickel-Cadmium Battery Market Share Forecast by Region, 2023 & 2033 (%)
Figure 53 Other Type Market by Region, 2023-2033 (US$ Mn, AGR (%))
Figure 54 Others Market Share Forecast by Region, 2023 & 2033 (%)
Figure 55 Global Grid Scale Stationary Battery Storage Market by Region, 2023-2033 (US$ Mn, AGR (%))
Figure 56 Grid Scale Stationery Battery Storage Market Share Forecast by Region 2023 & 2033 (%)
Figure 57 North America Grid Scale Stationery Battery Storage Market Attractiveness Index
Figure 58 North America Grid Scale Stationary Battery Storage Market by Value, 2023-2033 (US$ Mn, AGR (%))
Figure 59 North America Grid Scale Stationary Battery Storage Market by Cumulative Installed Capacity, 2023-2033 (MW, AGR (%))
Figure 60 North America Grid Scale Stationary Battery Storage Market by Cumulative Installed Capacity, 2023-2033 (MW, AGR (%))
Figure 61 North America Grid Scale Stationary Battery Storage Market by Country, 2023-2033 (US$ Mn, AGR (%))
Figure 62 North America Grid Scale Stationery Battery Storage Market Share Forecast by Country, 2023 & 2033 (%)
Figure 63 North America Grid Scale Stationary Battery Storage Market by Ownership-Model, 2023-2033 (US$ Mn, AGR (%))
Figure 64 North America Grid Scale Stationery Battery Storage Market Share Forecast by Ownership-Model, 2023 & 2033 (%)
Figure 65 North America Grid Scale Stationary Battery Storage Market by Application, 2023-2033 (US$ Mn, AGR (%))
Figure 66 North America Grid Scale Stationary Battery Storage Market Share Forecast by Application, 2023-2033 (%)
Figure 67 North America Grid Scale Stationary Battery Storage Market by Type, 2023-2033 (US$ Mn, AGR (%))
Figure 68 North America Grid Scale Stationary Battery Storage Market Share Forecast by Type, 2023-2033 (%)
Figure 69 US Grid Scale Stationary Battery Storage Market by Value, 2023-2033 (US$ Mn, AGR (%))
Figure 70 US Grid Scale Stationary Battery Storage Market by Cumulative Installed Capacity, 2023-2033 (MW, AGR (%))
Figure 71 Canada Grid Scale Stationary Battery Storage Market by Value, 2023-2033 (US$ Mn, AGR (%))
Figure 72 Canada Grid Scale Stationary Battery Storage Market by Cumulative Installed Capacity, 2023-2033 (MW, AGR (%))
Figure 73 Europe Grid Scale Stationery Battery Storage Market Attractiveness Index
Figure 74 Europe Grid Scale Stationary Battery Storage Market by Value, 2023-2033 (US$ Mn, AGR (%))
Figure 75 Europe Grid Scale Stationary Battery Storage Market by Cumulative Installed Capacity, 2023-2033 (MW, AGR (%))
Figure 76 Europe Grid Scale Stationary Battery Storage Market by Country, 2023-2033 (US$ Mn, AGR (%))
Figure 77 Europe Grid Scale Stationary Battery Storage Market by Country, 2023-2033 (US$ Mn, AGR (%))
Figure 78 Europe Grid Scale Stationary Battery Storage Market Share Forecast by Country, 2023-2033 (%)
Figure 79 Europe Grid Scale Stationary Battery Storage Market by Ownership-Model, 2023-2033 (US$ Mn, AGR (%))
Figure 80 Europe Grid Scale Stationary Battery Storage) Market Share Forecast by Ownership-Model, 2023-2033 (%)
Figure 81 Europe Grid Scale Stationary Battery Storage Market by Application, 2023-2033 (US$ Mn, AGR (%))
Figure 82 Europe Grid Scale Stationary Battery Storage Market Share Forecast by Application, 2023-2033 (%)
Figure 83 Europe Grid Scale Stationary Battery Storage Market by Type, 2023-2033 (US$ Mn, AGR (%))
Figure 84 Europe Grid Scale Stationary Battery Storage Market Share Forecast by Type, 2023-2033 (%)
Figure 85 Germany Grid Scale Stationary Battery Storage Market by Value, 2023-2033 (US$ Mn, AGR (%))
Figure 86 Germany Grid Scale Stationary Battery Storage Market by Cumulative Installed Capacity, 2023-2033 (MW, AGR (%))
Figure 87 UK Grid Scale Stationary Battery Storage Market by Value, 2023-2033 (US$ Mn, AGR (%))
Figure 88 UK Grid Scale Stationary Battery Storage Market by Cumulative Installed Capacity, 2023-2033 (MW, AGR (%))
Figure 89 France Grid Scale Stationary Battery Storage Market by Value, 2023-2033 (US$ Mn, AGR (%))
Figure 90 France Grid Scale Stationary Battery Storage Market by Cumulative Installed Capacity, 2023-2033 (MW, AGR (%))
Figure 91 Italy Grid Scale Stationary Battery Storage Market by Value, 2023-2033 (US$ Mn, AGR (%))
Figure 92 Italy Grid Scale Stationary Battery Storage Market by Cumulative Installed Capacity, 2023-2033 (MW, AGR (%))
Figure 93 Spain Grid Scale Stationary Battery Storage Market by Value, 2023-2033 (US$ Mn, AGR (%))
Figure 94 Spain Grid Scale Stationary Battery Storage Market by Cumulative Installed Capacity, 2023-2033 (MW, AGR (%))
Figure 95 Rest of Europe Grid Scale Stationary Battery Storage Market by Value, 2023-2033 (US$ Mn, AGR (%))
Figure 96 Rest of Europe Grid Scale Stationary Battery Storage Market by Cumulative Installed Capacity, 2023-2033 (MW, AGR (%))
Figure 97 Asia-Pacific Grid Scale Stationery Battery Storage Market Attractiveness Index
Figure 98 Asia-Pacific Grid Scale Stationary Battery Storage Market by Value, 2023-2033 (US$ Mn, AGR (%))
Figure 99 Asia-Pacific Grid Scale Stationary Battery Storage Market by Cumulative Installed Capacity, 2023-2033 (MW, AGR (%))
Figure 100 Asia-Pacific Grid Scale Stationary Battery Storage Market Cumulative Installed Capacity, by Country, 2023-2033 (MW, AGR (%))
Figure 101 Asia-Pacific Grid Scale Stationary Battery Storage Market by Country, 2023-2033 (US$ Mn, AGR (%))
Figure 102 Asia-Pacific Grid Scale Stationary Battery Storage Market Share Forecast by Country, 2023-2033 (%)
Figure 103 Asia-Pacific Grid Scale Stationary Battery Storage Market by Ownership-Model, 2023-2033 (US$ Mn, AGR (%))
Figure 104 Asia-Pacific Grid Scale Stationary Battery Storage Market Share Forecast by Ownership-Model, 2023-2033 (%)
Figure 105 Asia-Pacific Grid Scale Stationary Battery Storage Market by Application, 2023-2033 (US$ Mn, AGR (%))
Figure 106 Asia-Pacific Grid Scale Stationary Battery Storage Market Share Forecast by Application, 2023-2033 (%)
Figure 107 Asia-Pacific Grid Scale Stationary Battery Storage Market by Type, 2023-2033 (US$ Mn, AGR (%))
Figure 108 Asia-Pacific Grid Scale Stationary Battery Storage Market Share Forecast by Type, 2023-2033 (%)
Figure 109 China Grid Scale Stationary Battery Storage Market by Value, 2023-2033 (US$ Mn, AGR (%))
Figure 110 China Grid Scale Stationary Battery Storage Market by Cumulative Installed Capacity, 2023-2033 (MW, AGR (%))
Figure 111 India Grid Scale Stationary Battery Storage Market by Value, 2023-2033 (US$ Mn, AGR (%))
Figure 112 India Grid Scale Stationary Battery Storage Market by Cumulative Installed Capacity, 2023-2033 (MW, AGR (%))
Figure 114 Japan Grid Scale Stationary Battery Storage Market by Value, 2023-2033 (US$ Mn, AGR (%))
Figure 115 Japan Grid Scale Stationary Battery Storage Market by Cumulative Installed Capacity, 2023-2033 (MW, AGR (%))
Figure 116 Australia Grid Scale Stationary Battery Storage Market by Value, 2023-2033 (US$ Mn, AGR (%))
Figure 117 Australia Grid Scale Stationary Battery Storage Market by Cumulative Installed Capacity, 2023-2033 (MW, AGR (%))
Figure 118 South Korea Grid Scale Stationary Battery Storage Market by Value, 2023-2033 (US$ Mn, AGR (%))
Figure 119 South Korea Grid Scale Stationary Battery Storage Market by Cumulative Installed Capacity, 2023-2033 (MW, AGR (%))
Figure 120 Rest of Asia-Pacific Grid Scale Stationary Battery Storage Market by Value, 2023-2033 (US$ Mn, AGR (%))
Figure 121 Rest of Asia-Pacific Grid Scale Stationary Battery Storage Market by Cumulative Installed Capacity, 2023-2033 (MW, AGR (%))
Figure 122 Middle East & Africa Grid Scale Stationery Battery Storage Market Attractiveness Index
Figure 123 Middle East & Africa Grid Scale Stationary Battery Storage Market by Value, 2023-2033 (US$ Mn, AGR (%))
Figure 124 Middle East & Africa Grid Scale Stationary Battery Storage Market by Cumulative Installed Capacity, 2023-2033 (MW, AGR (%))
Figure 125 Middle East & Africa Grid Scale Stationary Battery Storage Market by Cumulative Installed Capacity by Country, 2023-2033 (MW, AGR (%))
Figure 126 Middle East & Africa Grid Scale Stationary Battery Storage Market by Country, 2023-2033 (US$ Mn, AGR (%))
Figure 127 Middle East & Africa Grid Scale Stationary Battery Storage Market Share Forecast by Country, 2023-2033 (%)
Figure 128 Middle East & Africa Grid Scale Stationary Battery Storage Market by Ownership-Model, 2023-2033 (US$ Mn, AGR (%))
Figure 129 Middle East & Africa Grid Scale Stationary Battery Storage Market Share Forecast by Ownership-Model, 2023-2033 (%)
Figure 130 Middle East & Africa Grid Scale Stationary Battery Storage Market by Application, 2023-2033 (US$ Mn, AGR (%))
Figure 131 Middle East & Africa Grid Scale Stationary Battery Storage Market Share Forecast by Application, 2023-2033 (%)
Figure 132 Middle East & Africa Grid Scale Stationary Battery Storage Market by Type, 2023-2033 (US$ Mn, AGR (%))
Figure 133 Middle East & Africa Grid Scale Stationary Battery Storage Market Share Forecast by Type, 2023-2033 (%)
Figure 134 GCC Grid Scale Stationary Battery Storage Market by Value, 2023-2033 (US$ Mn, AGR (%))
Figure 135 GCC Grid Scale Stationary Battery Storage Market by Cumulative Installed Capacity, 2023-2033 (MW, AGR (%))
Figure 136 South Africa Grid Scale Stationary Battery Storage Market by Value, 2023-2033 (US$ Mn, AGR (%))
Figure 137 South Africa Grid Scale Stationary Battery Storage Market by Cumulative Installed Capacity, 2023-2033 (MW, AGR (%))
Figure 138 Rest of Middle East & Africa Grid Scale Stationary Battery Storage Market by Value, 2023-2033 (US$ Mn, AGR (%))
Figure 139 Rest of Middle East & Africa Grid Scale Stationary Battery Storage Market by Cumulative Installed Capacity, 2023-2033 (MW, AGR (%))
Figure 140 Latin America Grid Scale Stationery Battery Storage Market Attractiveness Index
Figure 141 Latin America Grid Scale Stationary Battery Storage Market by Value, 2023-2033 (US$ Mn, AGR (%))
Figure 142 Latin America Grid Scale Stationary Battery Storage Market by Cumulative Installed Capacity, 2023-2033 (MW, AGR (%))
Figure 143 Latin America Grid Scale Stationary Battery Storage Market Cumulative Installed Capacity, by Country, 2023-2033 (MW, AGR (%))
Figure 144 Latin America Grid Scale Stationary Battery Storage Market by Country, 2023-2033 (US$ Mn, AGR (%))
Figure 145 Latin America Grid Scale Stationary Battery Storage Market Share Forecast by Country, 2023-2033 (%)
Figure 146 Latin America Grid Scale Stationary Battery Storage Market by Ownership-Model, 2023-2033 (US$ Mn, AGR (%))
Figure 147 Latin America Grid Scale Stationary Battery Storage Market Share Forecast by Ownership-Model, 2023-2033 (%)
Figure 148 Latin America Grid Scale Stationary Battery Storage Market by Application, 2023-2033 (US$ Mn, AGR (%))
Figure 149 Latin America Grid Scale Stationary Battery Storage Market Share Forecast by Application, 2023-2033 (%)
Figure 150 Latin America Grid Scale Stationary Battery Storage Market by Type, 2023-2033 (US$ Mn, AGR (%))
Figure 151 Latin America Grid Scale Stationary Battery Storage Market Share Forecast by type, 2023-2033 (%)
Figure 152 Brazil Grid Scale Stationary Battery Storage Market by Value, 2023-2033 (US$ Mn, AGR (%))
Figure 153 Brazil Grid Scale Stationary Battery Storage Market by Cumulative Installed Capacity, 2023-2033 (MW, AGR (%))
Figure 154 Mexico Grid Scale Stationary Battery Storage Market by Value, 2023-2033 (US$ Mn, AGR (%))
Figure 155 Mexico Grid Scale Stationary Battery Storage Market by Cumulative Installed Capacity, 2023-2033 (MW, AGR (%))
Figure 156 Rest of Latin America Grid Scale Stationary Battery Storage Market by Value, 2023-2033 (US$ Mn, AGR (%))
Figure 157 Rest of Latin America Grid Scale Stationary Battery Storage Market by Cumulative Installed Capacity, 2023-2033 (MW, AGR (%))
Figure 158 Grid Scale Stationery Battery Storage Market: Company Share/Ranking, 2022
Figure 159 Tesla Energy Operations, Inc.: Net Revenue, 2018-2022 (US$ million, AGR%)
Figure 160 Tesla Energy Operations, Inc.: R&D, 2018-2022 (US$ million, AGR%)
Figure 161 Tesla Energy Operations, Inc.: Regional Revenue Shares, 2022 (%)
Figure 162 Tesla Energy Operations, Inc.: Business Segment Revenue Shares, 2022 (%)
Figure 163 LG Chem: Net Revenue, 2018-2022 (US$ million, AGR%)
Figure 164 LG Chem: R&D, 2018-2022 (US$ million, AGR%)
Figure 165 LG Chem: Regional Revenue Shares, 2022 (%)
Figure 166 LG Chem: Business Segment Revenue Shares, 2022 (%)
Figure 167 BYD Co. Ltd: Net Revenue, 2017-2021 (US$ million, AGR%)
Figure 168 BYD Co. Ltd: R&D, 2017-2021 (US$ million, AGR%)
Figure 169 BYD Co. Ltd: Regional Revenue Shares, 2021 (%)
Figure 170 Fluence Energy: Net Revenue, 2018-2022 (US$ million, AGR%)
Figure 171 Fluence Energy: R&D, 2018-2022 (US$ million, AGR%)
Figure 172 Samsung SDI Co., Ltd.: Net Revenue, 2018-2022 (US$ million, AGR%)
Figure 173 Samsung SDI Co., Ltd.: R&D, 2018-2022 (US$ million, AGR%)
Figure 174 Samsung SDI Co., Ltd.: Regional Revenue Shares, 2022 (%)
Figure 175 Samsung SDI Co., Ltd.: Business Segment Revenue Shares, 2022 (%)
Figure 176 Saft Groupe SAS: Net Revenue, 2018-2022 (US$ million, AGR%)
Figure 177 Saft Groupe SAS: R&D, 2018-2022 (US$ million, AGR%)
Figure 178 Saft Groupe SAS: Regional Revenue Shares, 2022 (%)
Figure 179 Saft Groupe SAS: Business Segment Revenue Shares, 2022 (%)
Figure 180 General Electric Company: Net Revenue, 2018-2022 (US$ million, AGR%)
Figure 181 General Electric Company: R&D, 2018-2022 (US$ million, AGR%)
Figure 182 General Electric Company: Regional Revenue Shares, 2022 (%)
Figure 183 General Electric Company: Business Segment Revenue Shares, 2022 (%)
Figure 184 Siemens Energy AG: Net Revenue, 2018-2022 (US$ million, AGR%)
Figure 185 Siemens Energy AG: R&D, 2018-2022 (US$ million, AGR%)
Figure 186 Siemens Energy AG: Regional Revenue Shares, 2022 (%)
Figure 187 Siemens Energy AG: Business Segment Revenue Shares, 2022 (%)
Figure 188 Panasonic Holdings Corporation: Net Revenue, 2018-2022 (US$ million, AGR%)
Figure 189 Panasonic Holdings Corporation: R&D, 2018-2022 (US$ million, AGR%)
Figure 190 Panasonic Holdings Corporation: Regional Revenue Shares, 2022 (%)
Figure 191 Panasonic Holdings Corporation: Business Segment Revenue Shares, 2022 (%)
Figure 192 Hitachi, Ltd: Net Revenue, 2018-2022 (US$ million, AGR%)
Figure 193 Hitachi, Ltd: Regional Revenue Shares, 2022 (%)
Figure 194 Hitachi, Ltd: Business Segment Revenue Shares, 2022 (%)
Figure 195 ABB Ltd: Net Revenue, 2018-2022 (US$ million, AGR%)
Figure 196 ABB Ltd: R&D, 2018-2022 (US$ million, AGR%)
Figure 197 ABB Ltd: Regional Revenue Shares, 2022 (%)
Figure 198 ABB Ltd: Business Segment Revenue Shares, 2022 (%)
Figure 199 Orion Energy Systems Inc.: Net Revenue, 2018-2022 (US$ million, AGR%)
Figure 200 Orion Energy Systems Inc.: R&D, 2018-2022 (US$ million, AGR%)
Figure 201 Maxwell Technologies Inc..: Net Revenue, 2018-2022 (US$ million, AGR%)
Figure 202 Maxwell Technologies Inc..: R&D, 2018-2022 (US$ million, AGR%)
Figure 203 Maxwell Technologies Inc..: Regional Revenue Shares, 2022 (%)
Figure 204 Maxwell Technologies Inc..: Business Segment Revenue Shares, 2022 (%)
ページTOPに戻る
本レポートと同じKEY WORD(grid)の最新刊レポート
- 本レポートと同じKEY WORDの最新刊レポートはありません。
よくあるご質問
Visiongain社はどのような調査会社ですか?
英国の調査会社ヴィジョンゲイン社(Visiongain)は、通信とエネルギーのほか、自動車や化学・医薬品、金属など、広範な市場を対象に調査を行っています。自動車市場については、市場全般に関する調査のほ... もっと見る
調査レポートの納品までの日数はどの程度ですか?
在庫のあるものは速納となりますが、平均的には 3-4日と見て下さい。
但し、一部の調査レポートでは、発注を受けた段階で内容更新をして納品をする場合もあります。
発注をする前のお問合せをお願いします。
注文の手続きはどのようになっていますか?
1)お客様からの御問い合わせをいただきます。
2)見積書やサンプルの提示をいたします。
3)お客様指定、もしくは弊社の発注書をメール添付にて発送してください。
4)データリソース社からレポート発行元の調査会社へ納品手配します。
5) 調査会社からお客様へ納品されます。最近は、pdfにてのメール納品が大半です。
お支払方法の方法はどのようになっていますか?
納品と同時にデータリソース社よりお客様へ請求書(必要に応じて納品書も)を発送いたします。
お客様よりデータリソース社へ(通常は円払い)の御振り込みをお願いします。
請求書は、納品日の日付で発行しますので、翌月最終営業日までの当社指定口座への振込みをお願いします。振込み手数料は御社負担にてお願いします。
お客様の御支払い条件が60日以上の場合は御相談ください。
尚、初めてのお取引先や個人の場合、前払いをお願いすることもあります。ご了承のほど、お願いします。
データリソース社はどのような会社ですか?
当社は、世界各国の主要調査会社・レポート出版社と提携し、世界各国の市場調査レポートや技術動向レポートなどを日本国内の企業・公官庁及び教育研究機関に提供しております。
世界各国の「市場・技術・法規制などの」実情を調査・収集される時には、データリソース社にご相談ください。
お客様の御要望にあったデータや情報を抽出する為のレポート紹介や調査のアドバイスも致します。
|
|


