太陽光発電(PV)市場レポート:2023-2033
Solar Photovoltaic (PV) Market Report 2023-2033
レポート詳細
太陽光発電(PV)市場レポート 2023-2033 :本レポートは、新たな収益源の開拓を目指すリーディングカンパニーにとって、業界とその基礎となる力学をより深く理解する上で、非常に貴重な... もっと見る
※上記価格は部署ライセンス(Departmental licence)価格です。
その他の価格についてはデータリソースまでお問合せください。
日本語のページは自動翻訳を利用し作成しています。
実際のレポートは英文のみでご納品いたします。
サマリー
レポート詳細
太陽光発電(PV)市場レポート 2023-2033:本レポートは、新たな収益源の開拓を目指すリーディングカンパニーにとって、業界とその基礎となる力学をより深く理解する上で、非常に貴重なものとなるでしょう。また、異業種への進出や新地域での既存事業の拡大を目指す企業にとっても有益なレポートです。
太陽光発電市場の主な要因のひとつは、太陽電池と関連技術のコスト低下
太陽光発電市場は、再生可能エネルギーへの需要の高まりと、太陽光発電の導入を促進することを目的とした政府の政策やインセンティブの整備により、近年著しい成長を遂げています。太陽光発電技術は、太陽光を電気に変換する太陽電池を使用します。世界の環境意識が高まるにつれ、化石燃料に代わる持続可能なエネルギー源の需要が高まっており、これが太陽光発電市場の成長に拍車をかけています。
太陽光発電市場の主要な促進要因の一つは、ソーラーパネルと関連技術のコスト低下です。太陽光発電技術が成熟し、広く採用されるようになるにつれ、規模の経済と技術の進歩により、ソーラーパネルのコストが大幅に低下しています。これにより、太陽光発電は家庭や企業にとってより手頃な選択肢となり、この技術のさらなる普及を後押ししています。
太陽光発電市場の成長を促すもう一つの要因は、太陽光発電の導入を促進することを目的とした政府の政策やインセンティブが整備されたことである。世界各国の政府は、より持続可能なエネルギー源への転換の必要性を認識し、再生可能エネルギー技術の開発と普及を支援する政策やインセンティブを実施してきました。これらの政策には、固定価格買取制度、税額控除、再生可能エネルギー目標などがあり、これらすべてが太陽光発電市場の成長を後押ししてきました。
マーケットリサーチレポートを購入する前に、どのような質問をするべきか?
- 太陽光発電(PV)市場はどのように進化しているのか?
- 太陽光発電(PV)市場を牽引・抑制しているものは何か?
- 太陽光発電(PV)サブマーケットの各セグメントは予測期間中にどのように成長し、2033年にはどれくらいの収益を占めるようになるのでしょうか?
- 2023年から2033年にかけて、各太陽光発電(PV)サブマーケットの市場シェアはどのように推移するのでしょうか?
- 2023年から2033年にかけて、市場全体の主な牽引役となるのは何でしょうか?
- 主要な太陽光発電(PV)市場はマクロ経済ダイナミクスに概ね追随するのか、それとも個々の国別市場が他を凌駕するのか?
- 2033年までに各国市場のシェアはどのように変化し、2033年に市場をリードするのはどの地域か?
- 主要プレーヤーは誰か、また予測期間中の見通しはどうか?
- これらの主要企業の太陽光発電(PV)プロジェクトはどのようなものか?
- 2023年から2033年の間に、業界はどのように進化していくのか?現在および今後10年間に実施される太陽光発電(PV)プロジェクトには、どのような意味があるのか?
- 太陽光発電(PV)市場をさらに拡大するために、製品の商業化の必要性は高まっているのでしょうか?
- 太陽光発電市場はどこに向かっているのか、そして市場の最前線に立つためにはどうすればよいのか?
- 新製品やサービスラインへの最適な投資方法とは?
- 企業を新たな成長軌道に乗せ、C-suiteに移行させるための重要な展望とは?
このことが、現在、そして今後10年間の太陽光発電(PV)市場にどのような影響を与えるかを見極める必要があります。
- 355ページにわたる本レポートでは、174の表と227のチャート/グラフを独占的に提供します。
- 本レポートでは、業界における主要な収益性の高い分野を取り上げているため、今すぐその分野をターゲットにすることができます。
- 世界、地域、国の売上高と成長率を詳細に分析しています。
- 競合他社が成功した主要なトレンド、変化、収益予測をハイライトしています。
本レポートは、太陽光発電(PV)市場が今後10年間にどのように発展するか、またCOVID-19の景気後退と好転の変動に合わせて、今日あなたにお伝えします。この市場は、過去10年間のどの時点よりも今が重要です。
2033年までの予測やその他の分析により、商業的な展望を明らかにする。
- 2033年までの収益予測に加え、直近の実績や成長率、市場シェアなど、本調査では
- ビジネスの展望や展開など、独自の分析がご覧いただけます。
- 定性的分析(市場力学、促進要因、機会、阻害要因、課題など)、コスト構造、太陽光発電(PV)価格上昇の影響、最近の動向などをご覧いただけます。
本レポートでは、COVID-19が業界や貴社にどのような影響を与えるかについて、データ分析および貴重な知見を提供しています。COVID-19の4つの回収パターン、すなわち「V」、「L」、「W」、「U」の回収パターンとその影響について考察しています。
報告書の対象セグメント
市場別セグメント
- 市場価値(US$ Billion)
- 市場累積設置容量(GW)
セルタイプ別市場セグメント
- フルセルPVモジュール
- ハーフセルPVモジュール
コンポーネント別市場セグメント
- モジュール
- インバーター
- バランスオブシステム(BOS)
素材別市場セグメント
- 結晶シリコン(C-Si)
- 薄膜
- 銅インジウムガリウムセレン化物(CIGS)
- テルル化カドミウム(CDTE)
設置タイプ別市場セグメント
- 地上設置型
- 屋上設置型
- 窓設置型
- 浮遊型PV
- その他の設置タイプ
用途別市場セグメント
- 住宅・商業施設
- リモートパワーシステム
- 交通機関
- ソーラーファーム
- 携帯型電子機器
- その他用途
世界市場全体およびセグメントの収益予測に加え、4地域および主要20カ国市場の収益予測も掲載しています。
北米
- U.S.
- カナダ
欧州
- ドイツ
- スペイン
- イギリス
- フランス
- イタリア
- その他の欧州
アジア太平洋
- 中国
- 日本
- インド
- オーストラリア
- 韓国
- その他のアジア太平洋地域
ラテンアメリカ
- ブラジル
- メキシコ
- その他のラテンアメリカ地域
中近東・アフリカ
- GCC
- 南アフリカ
- その他の中東・アフリカ地域
レポートには、太陽光発電(PV)市場の主要企業のプロファイルと2023年から2033年まで、これらの企業の事業のこのセグメントに焦点を当てたいくつかの企業についても含まれています。
主要企業と市場成長の可能性
・ ABB Ltd.
・ Canadian Solar Inc.
・ Eaton Corporation plc
・ EMMVEE Photovoltaic Power Private Limited
・ First Solar, Inc.
・ Hanwha Q Cells
・ JA Solar Holdings Co., Ltd.
・ JinkoSolar Holding Co., Ltd.
・ LG Electronics Inc.
・ LONGi Green Energy Technology
・ Sharp Corporation
・ Suntech Power Holdings Co., Ltd.
・ Trina Solar Co., Ltd.
・ Waaree Energies Limited
・ Yingli Green Energy Holding Company Limited
太陽光発電(PV)市場の世界全体の収益、金額ベースで2023年から2033年まで、市場は2023年に1179億4000万米ドルを突破すると、当研究所が算出しました。2033年まで収益が大きく伸びることが予測されます。当研究所では、最も大きな可能性を秘めた企業を特定しています。彼らの能力、進歩、商業的展望を発見することで、先手を打つことができます。
太陽光発電(PV)市場、2023年から2033年までのレポートはどのように役立つのでしょうか?
要約すると、350ページ以上のレポートでは、以下のような知識を得ることができます。
- 太陽光発電(PV)市場、2023年から2033年までの収益予測 市場価値、累積設置容量、セルタイプ、コンポーネント、材料、設置タイプ、アプリケーション、企業規模を世界および地域レベルでそれぞれ予測 - 業界の展望を発見し、投資や収益に最も有利な場所を見つけることができます。
- 4つの地域と20の主要国市場の2033年までの収益予測 - 北米、欧州、アジア太平洋、ラテンアメリカ、中東・アフリカの太陽光発電(PV)市場、2023年から2033年の市場予測をご覧いただけます。また、米国、カナダ、ブラジル、ドイツ、フランス、英国、イタリア、中国、インド、日本、オーストラリアなど著名な経済圏の市場も予測されています。
- 既存企業や市場参入を目指す企業の展望 - 太陽光発電(PV)市場に関わる主要企業15社の企業プロファイルを含む、2023年から2033年の市場。
独自の予測による定量・定性分析をご覧いただけます。私たちのレポートだけが持つ情報を入手し、貴重なビジネスインテリジェンスとして情報を得ることができます。
他にはない情報
私たちの新しいレポートがあれば、知識に遅れをとったり、チャンスを逃したりする可能性は低くなります。私たちの仕事があなたの調査、分析、意思決定にどのように役立つかをご覧ください。Visiongainの調査は、太陽光発電(PV)市場、2023年から2033年、市場をリードする企業の商業分析を必要とするすべての人のためのものです。データ、トレンド、予測を見つけることができます。
ページTOPに戻る
目次
目次
1 レポートの概要
1.1 研究の目的
1.2 太陽光発電の市場紹介
1.3 この報告書がもたらすもの
1.4 本レポートを読むべき理由
1.本分析レポートが回答する5つの重要な質問
1.6 本レポートは誰のためのものか?
1.7 調査方法
1.7.1 市場の定義
1.7.2 市場評価・予測手法
1.7.3 データバリデーション
1.7.3.1 一次調査
1.7.3.2 セカンダリーリサーチ
1.8 よくある質問(FAQ)
1.9 関連するVisiongainのレポート
1.10 ビジョンゲインについて
2 エグゼクティブサマリー
2.1 セグメント別分析
2.1.1 セルタイプセグメント:市場魅力度指数
2.1.2 セルコンポーネントセグメント:市場魅力度指数
2.1.3 素材別セグメント:市場魅力度指数
2.1.4 設置型セグメント:市場魅力度指数
2.1.5 用途別セグメント:市場魅力度指数
2.2 地域別分析
3 市場の概要
3.1 キーファインディング
3.2 マーケットダイナミクス
3.2.1 市場促進要因
3.2.1.1 政府のサポートが市場の成長を助ける
3.2.1.2 太陽光電池モジュールの製造におけるコストダウン
3.2.1.3 環境への配慮。大きな改善点
3.2.2 市場の抑制要因
3.2.2.1 高いイニシャルコストが市場の成長を抑制する
3.2.2.2 断続的であること。天候に左右される
3.2.2.3 技術的な制約が市場成長を制限する
3.2.3 マーケットオポチュニティ
3.2.3.1 技術革新が太陽光発電市場を活性化させる
3.2.3.2 世界の発展途上国での新興国市場
3.2.3.3 新たな研究対象として浮上するエネルギー貯蔵
3.3 COVID-19の影響度分析
3.3.1 V字型リカバリー
3.3.2 W型リカバリー
3.3.3 U字型リカバリー
3.3.4 L字型リカバリー
3.4 ポーターのファイブフォース分析
3.4.1 新規参入の脅威
3.4.2 サプライヤーのバーゲニングパワー
3.4.3 バイヤーのバーゲニングパワー
3.4.4 代替品の脅威
3.4.5 競争力のあるライバル
3.5 PEST分析
3.5.1 政治的要因
3.5.2 経済的要因
3.5.3 社会的要因
3.5.4 技術的要因
4 太陽光発電市場分析:セルタイプ別
4.1 キーファインディング
4.2 セルタイプ別セグメント:市場魅力度指数
4.3 太陽光発電のセルタイプ別市場規模の推定と予測
4.4 フルセルPVモジュール
4.4.1 地域別市場規模、2023-2033年(US$ Bn)
4.4.2 2023年&2033年地域別市場シェア(%)
4.5 ハーフセルPVモジュール
4.5.1 地域別市場規模、2023-2033年(US$ Bn)
4.5.2 2023年&2033年地域別市場シェア(%)
5 太陽光発電市場分析:コンポーネント別
5.1 キーファインディング
5.2 セルコンポーネントセグメント:市場魅力度指数
5.3 太陽光発電のセルコンポーネント別市場規模の推定と予測
5.4モジュール
5.4.1 地域別市場規模、2023-2033年(US$ Bn)
5.4.2 2023年&2033年地域別市場シェア(%)
5.5 インバーター
5.5.1 地域別市場規模、2023-2033年(US$ Bn)
5.5.2 2023年&2033年地域別市場シェア(%)
5.6 バランスオブシステム(BOS)
5.6.1 地域別市場規模、2023-2033年(US$ Bn)
5.6.2 2023年&2033年地域別市場シェア(%)
6 太陽光発電市場分析:素材別
6.1 キーファインディング
6.2 素材別セグメント:市場魅力度指数
6.3 太陽光発電の素材別市場規模の推定と予測
6.4 結晶シリコン(C-Si)
6.4.1 地域別市場規模、2023-2033年(US$ Bn)
6.4.2 2023年&2033年地域別市場シェア(%)
6.5 薄膜
6.5.1 地域別市場規模、2023-2033年(US$ Bn)
6.5.2 2023年&2033年地域別市場シェア(%)
6.6 銅インジウムガリウムセレン化物(CIGS)
6.6.1 地域別市場規模、2023-2033年(US$ Bn)
6.6.2 2023年&2033年地域別市場シェア(%)
6.7 カドミウムテルル(CDTE)
6.7.1 地域別市場規模、2023-2033年(US$ Bn)
6.7.2 2023年&2033年地域別市場シェア(%)
7 太陽光発電市場分析:設置タイプ別
7.1 キーファインディング
7.2 設置タイプ別セグメント:市場魅力度指数
7.3 設置タイプ別太陽光発電の市場規模の推定と予測
7.4 地上設置型
7.4.1 地域別市場規模、2023-2033年(US$ Bn)
7.4.2 2023年&2033年地域別市場シェア(%)
7.5 屋上設置型
7.5.1 地域別市場規模、2023-2033年(US$ Bn)
7.5.2 2023年&2033年地域別市場シェア(%)
7.6 窓設置型
7.6.1 地域別市場規模、2023-2033年(US$ Bn)
7.6.2 2023年&2033年地域別市場シェア(%)
7.7 浮遊型
7.7.1 地域別市場規模、2023-2033年(US$ Bn)
7.7.2 2023年&2033年地域別市場シェア(%)
7.8 その他の設置タイプ
7.8.1 地域別市場規模、2023-2033年(US$ Bn)
7.8.2 2023年&2033年地域別市場シェア(%)
8 太陽光電池市場分析:用途別
8.1 キーファインディング
8.2 用途別セグメント。市場魅力度指数
8.3 太陽光電池の用途別市場規模の推定と予測
8.4 住宅・商業施設
8.4.1 地域別市場規模、2023-2033年(US$ Bn)
8.4.2 2023年&2033年地域別市場シェア(%)
8.5 リモートパワーシステム
8.5.1 地域別市場規模、2023-2033年(US$ Bn)
8.5.2 2023年&2033年地域別市場シェア(%)
8.6 交通機関
8.6.1 地域別市場規模、2023-2033年(US$ Bn)
8.6.2 2023年&2033年地域別市場シェア(%)
8.7 ソーラーファーム
8.7.1 地域別市場規模、2023-2033年(US$ Bn)
8.7.2 2023年&2033年地域別市場シェア(%)
8.8 携帯型電子機器
8.8.1 地域別市場規模、2023-2033年(US$ Bn)
8.8.2 2023年&2033年地域別市場シェア(%)
8.9 その他用途
8.9.1 地域別市場規模、2023-2033年(US$ Bn)
8.9.2 2023年&2033年地域別市場シェア(%)
9 太陽光発電市場分析:地域別
9.1 キーファインディング
9.2 地域別市場規模の推計と予測
9.3 世界の太陽光発電(PV)市場:地域別
9.4 太陽光発電(PV)の世界市場:セルタイプ別
9.5 太陽光発電(PV)の世界市場:コンポーネント別
9.6 太陽光発電(PV)の世界市場:素材別
9.7 太陽光発電(PV)の世界市場:設置タイプ別
9.8 世界の太陽光発電(PV)市場:アプリケーション別
10 北米の太陽光発電市場分析
10.1 キーファインディング
10.2 北米太陽光発電市場魅力度指数
10.3 北米太陽光発電の市場規模推計と予測
10.4 北米太陽光発電の国別市場規模推計と予測
10.5 北米太陽光発電のセルタイプ別市場規模の推定と予測
10.6 北米太陽光発電のコンポーネント別市場規模の推定と予測
10.7 北米太陽光発電の素材別市場規模の推定と予測
10.8 北米太陽光発電の設置タイプ別市場規模の推定と予測
10.9 北米太陽光発電の用途別市場規模の推定と予測
10.10 米国太陽光発電の市場分析
10.11 カナダの太陽光発電の市場分析
11 欧州の太陽光発電市場分析
11.1 キーファインディング
11.2 欧州太陽光発電市場魅力度指数
11.3 欧州太陽光発電の市場規模の推定と予測
11.4 欧州太陽光発電の国別市場規模の推定と予測
11.5 欧州太陽光発電のセルタイプ別市場規模の推定と予測
11.6 欧州太陽光発電のコンポーネント別市場規模の推定と予測
11.7 欧州太陽光発電の素材別市場規模の推定と予測
11.8 欧州太陽光発電の設置タイプ別市場規模の推定と予測
11.9 欧州太陽光発電の用途別市場規模推計と予測
11.10 ドイツの太陽光発電の市場分析
11.11 英国太陽光発電市場の分析
11.12 フランスの太陽光発電の市場分析
11.13 イタリア太陽光発電市場の分析
11.14 スペインの太陽光発電の市場分析
11.15 その他の欧州の太陽光発電の市場分析
12 アジア太平洋地域の太陽光発電市場分析
12.1 キーファインディング
12.2 アジア太平洋地域の太陽光発電市場の魅力度指数
12.3 アジア太平洋地域の太陽光発電の市場規模の推定と予測
12.4 アジア太平洋地域の太陽光発電の国別市場規模の推定と予測
12.5 アジア太平洋地域の太陽光発電のセルタイプ別市場規模の推定と予測
12.6 アジア太平洋地域の太陽光発電の市場規模推定と構成要素別予測
12.7 アジア太平洋地域の太陽光発電の市場規模推定と材料別予測
12.8 アジア太平洋地域の太陽光発電の設置タイプ別市場規模の推定と予測
12.9 アジア太平洋地域の太陽光発電の用途別市場規模の推定と予測
12.10 中国太陽光発電市場の分析
12.11 インド太陽光発電の市場分析
12.12 日本の太陽光発電の市場分析
12.13 韓国太陽光発電市場分析
12.14 オーストラリアの太陽光発電の市場分析
12.15 その他のアジア太平洋地域の太陽光発電の市場分析
13 中東・アフリカ太陽光発電市場分析
13.1 キーファインディング
13.2 中東・アフリカ太陽光発電市場魅力度指数
13.3 中東・アフリカ太陽光発電の市場規模推定と予測
13.4 中東・アフリカ太陽光発電の国別市場規模の推定と予測
13.5 中東・アフリカ太陽光発電のセルタイプ別市場規模の推定と予測
13.6 中東・アフリカ太陽光発電の部品別市場規模の推定と予測
13.7 中東・アフリカ太陽光発電の素材別市場規模の推定と予測
13.8 中東・アフリカ太陽光発電の設置タイプ別市場規模推計と予測
13.9 中東・アフリカ太陽光発電の用途別市場規模の推定と予測
13.10 GCC太陽光発電の市場分析
13.11 南アフリカの太陽光発電の市場分析
13.12 その他の中東・アフリカ地域の太陽光発電の市場分析
14 ラテンアメリカの太陽光発電の市場分析
14.1 キーファインディング
14.2 ラテンアメリカの太陽光発電市場魅力度指数
14.3 ラテンアメリカの太陽光発電の市場規模の推定と予測
14.4 ラテンアメリカの太陽光発電の国別市場規模の推定と予測
14.5 ラテンアメリカの太陽光発電のセルタイプ別市場規模の推定と予測
14.6 ラテンアメリカの太陽光発電の市場規模推定と構成要素別予測
14.7 ラテンアメリカの太陽光発電の素材別市場規模の推定と予測
14.8 ラテンアメリカの太陽光発電の設置タイプ別市場規模の推定と予測
14.9 ラテンアメリカの太陽光発電の用途別市場規模の推定と予測
14.10 ブラジル太陽光発電の市場分析
14.11 メキシコ太陽光発電の市場分析
14.12 その他のラテンアメリカの太陽光発電の市場分析
15 会社概要
15.1 競合他社の状況、2022年
15.2 戦略的展望
15.2.1 主要な事業戦略としての企業買収
15.2.2 主要なビジネス戦略としてのコラボレーション
15.2.3 主要なビジネス戦略としての新製品発売
15.2.4 主要なビジネス戦略としての投資
15.2.5 主要なビジネス戦略としてのジョイントベンチャー
15.3 Canadian Solar Inc.
15.3.1 企業スナップショット
15.3.2 会社概要
15.3.3 財務分析
15.3.3.1 純収益、2017-2021年
15.3.3.2 R&D、2017年~2021年
15.3.3.3 地域別売上シェア、2021年(%)
15.3.3.4 事業セグメント別売上高シェア、2021年(%)
15.3.4 製品ベンチマーキング
15.3.5 戦略的な展望
15.4 First Solar, Inc.
15.4.1 企業スナップショット
15.4.2 会社概要
15.4.3 財務分析
15.4.3.1 純収益、2018年~2022年
15.4.3.2 R&D、2018年~2022年
15.4.3.3 地域別売上シェア、2022年
15.4.4 製品ベンチマーキング
15.4.5 戦略的な展望
15.5 Hanwha Q Cells
15.5.1 企業スナップショット
15.5.2 会社概要
15.5.3 製品ベンチマーキング
15.5.4 戦略的な展望
15.6 Trina Solar Co., Ltd.
15.6.1 企業スナップショット
15.6.2 会社概要
15.6.3 製品ベンチマーキング
15.6.4 戦略的な展望
15.7 Yingli Green Energy Holding Company Limited
15.7.1 企業スナップショット
15.7.2 会社概要
15.7.3 財務分析
15.7.3.1 純収益、2018年~2022年
15.7.4 製品ベンチマーキング
15.7.5 戦略的な展望
15.8 LG Electronics Inc.
15.8.1 企業スナップショット
15.8.2 会社概要
15.8.3 財務分析
15.8.3.1 純収益、2018年~2022年
15.8.3.2 R&D、2018年~2022年
15.8.3.3 2022年の地域別売上高シェア(%)
15.8.3.4 2022年の事業別売上高シェア(%)
15.8.4 製品ベンチマーキング
15.9 JinkoSolar Holding Co., Ltd.
15.9.1 企業スナップショット
15.9.2 会社概要
15.9.3 財務分析
15.9.3.1 純収益、2017-2021年
15.9.3.2 R&D、2017年~2021年
15.9.3.3 地域別売上シェア、2021年(%)
15.9.3.4 事業セグメント別売上高シェア、2021年(%)
15.9.4 製品ベンチマーキング
15.9.5 戦略的な展望
15.10 JA Solar Holdings Co., Ltd.
15.10.1 企業スナップショット
15.10.2 会社概要
15.10.3 財務分析
15.10.3.1 純収益、2018年~2022年
15.10.4 製品ベンチマーキング
15.10.5 戦略的な展望
15.11 LONGi Green Energy Technology
15.11.1 企業スナップショット
15.11.2 会社概要
15.11.3 製品ベンチマーキング
15.11.4 戦略的な展望
15.12 Suntech Power Holdings Co., Ltd.
15.12.1 企業スナップショット
15.12.2 会社概要
15.12.3 製品ベンチマーキング
15.13 Sharp Corporation
15.13.1 企業スナップショット
15.13.2 会社概要
15.13.3 財務分析
15.13.3.1 純収益、2018年~2022年
15.13.3.2 R&D、2018年~2022年
15.13.3.3 2022年の地域別売上高シェア(%)
15.13.3.4 事業セグメント別売上高シェア、2022年(%)
15.13.4 製品ベンチマーキング
15.13.5 戦略的な展望
15.14 ABB Ltd.
15.14.1 企業スナップショット
15.14.2 会社概要
15.14.3 財務分析
15.14.3.1 純収益、2018年~2022年
15.14.3.2 R&D、2018年~2022年
15.14.3.3 事業セグメント別売上高シェア、2022年(%)
15.14.4 製品ベンチマーキング
15.15 Eaton Corporation plc
15.15.1 企業スナップショット
15.15.2 会社概要
15.15.3 財務分析
15.15.3.1 純収益、2018年~2022年
15.15.3.2 R&D、2018年~2022年
15.15.3.3 地域別売上シェア、2022年(%)
15.15.3.4 2022年の事業別売上高シェア(%)
15.15.4 製品ベンチマーキング
15.15.5 戦略的な展望
15.16 Waaree Energies Limited
15.16.1 企業スナップショット
15.16.2 会社概要
15.16.3 製品ベンチマーキング
15.16.4 戦略的な展望
15.17 EMMVEE Photovoltaic Power Private Limited
15.17.1 企業スナップショット
15.17.2 会社概要
15.17.3 製品ベンチマーキング
16 結論と提言
16.1 ビジョンゲインからの結びの言葉
16.2 市場関係者への提言
表の一覧
Table 1 Solar Photovoltaic Market Snapshot, 2023 & 2033 (US$ billion, CAGR %)
Table 2 Global Solar Photovoltaic (PV) Market Forecast, 2023-2033 (US$ Bn, AGR (%), CAGR (%)) (V-Shaped Recovery Scenario)
Table 3 Global Solar Photovoltaic (PV) Market by Region, 2023-2033 (US$ Bn, AGR (%), CAGR (%)) (V-Shaped Recovery Scenario)
Table 4 Global Solar Photovoltaic (PV) Market Forecast, 2023-2033 (US$ Bn, AGR (%), CAGR (%)) (W-Shaped Recovery Scenario)
Table 5 Global Solar Photovoltaic (PV) Market by Region, 2023-2033 (US$ Bn, AGR (%), CAGR (%)) (W-Shaped Recovery Scenario)
Table 6 Global Solar Photovoltaic (PV) Market Forecast, 2023-2033 (US$ Bn, AGR (%), CAGR (%)) (U-Shaped Recovery Scenario)
Table 7 Global Solar Photovoltaic (PV) Market by Region, 2023-2033 (US$ Bn, AGR (%), CAGR (%)) (U-Shaped Recovery Scenario)
Table 8 Global Solar Photovoltaic (PV) Market Forecast, 2023-2033 (US$ Bn, AGR (%), CAGR (%)) (L-Shaped Recovery Scenario)
Table 9 Global Solar Photovoltaic (PV) Market by Region, 2023-2033 (US$ Bn, AGR (%), CAGR (%)) (L-Shaped Recovery Scenario)
Table 10 Global Solar Photovoltaic (PV) Market by Cell Type, 2023-2033 (US$ Bn, AGR (%), CAGR (%))
Table 11 Full-Cell PV Modules Market by Region, 2023-2033 (US$ Bn, AGR (%), CAGR (%))
Table 12 Half-Cell PV Modules Market by Region, 2023-2033 (US$ Bn, AGR (%), CAGR (%))
Table 13 Global Solar Photovoltaic (PV) Market by Component, 2023-2033 (US$ Bn, AGR (%), CAGR (%))
Table 14 Modules Market by Region, 2023-2033 (US$ Bn, AGR (%), CAGR (%))
Table 15 Inverters Market by Region, 2023-2033 (US$ Bn, AGR (%), CAGR (%))
Table 16 Balance of System (BOS) Market by Region, 2023-2033 (US$ Bn, AGR (%), CAGR (%))
Table 17 Global Solar Photovoltaic (PV) Market by Material, 2023-2033 (US$ Bn, AGR (%), CAGR (%))
Table 18 Crystalline Silicon (C-Si) Market by Region, 2023-2033 (US$ Bn, AGR (%), CAGR (%))
Table 19 Thin Film Market by Region, 2023-2033 (US$ Bn, AGR (%), CAGR (%))
Table 20 Copper Indium Gallium Selenide (CIGS) Market by Region, 2023-2033 (US$ Bn, AGR (%), CAGR (%))
Table 21 Cadmium Telluride (CDTE) Market by Region, 2023-2033 (US$ Bn, AGR (%), CAGR (%))
Table 22 Global Solar Photovoltaic (PV) Market by Installation Type, 2023-2033 (US$ Bn, AGR (%), CAGR (%))
Table 23 Ground-mounted Market by Region, 2023-2033 (US$ Bn, AGR (%), CAGR (%))
Table 24 Rooftops Market by Region, 2023-2033 (US$ Bn, AGR (%), CAGR (%))
Table 25 Windows Market by Region, 2023-2033 (US$ Bn, AGR (%), CAGR (%))
Table 26 Floating PV Market by Region, 2023-2033 (US$ Bn, AGR (%), CAGR (%))
Table 27 Other Installation Type Market by Region, 2023-2033 (US$ Bn, AGR (%), CAGR (%))
Table 28 Global Solar Photovoltaic (PV) Market by Application, 2023-2033 (US$ Bn, AGR (%), CAGR (%))
Table 29 Residential and Commercial Buildings Market by Region, 2023-2033 (US$ Bn, AGR (%), CAGR (%))
Table 30 Remote Power Systems Market by Region, 2023-2033 (US$ Bn, AGR (%), CAGR (%))
Table 31 Transportation Market by Region, 2023-2033 (US$ Bn, AGR (%), CAGR (%))
Table 32 Solar Farms Market by Region, 2023-2033 (US$ Bn, AGR (%), CAGR (%))
Table 33 Portable Electronic Devices Market by Region, 2023-2033 (US$ Bn, AGR (%), CAGR (%))
Table 34 Other Applications Market by Region, 2023-2033 (US$ Bn, AGR (%), CAGR (%))
Table 35 Global Solar Photovoltaic (PV) Market Forecast, 2023-2033 (US$ Bn, AGR (%), CAGR (%))
Table 36 Global Solar Photovoltaic (PV) Market Cumulative Installed Capacity, 2023-2033 (GW, AGR (%), CAGR (%))
Table 37 Global Solar Photovoltaic (PV) Market by Region, 2023-2033 (US$ Bn, AGR (%), CAGR (%))
Table 38 Global Solar Photovoltaic (PV) Market Cumulative Installed Capacity, by region, 2023-2033 (GW, AGR (%), CAGR (%))
Table 39 Global Solar Photovoltaic (PV) Market by Cell Type, 2023-2033 (US$ Bn, AGR (%), CAGR (%))
Table 40 Global Solar Photovoltaic (PV) Market by Component, 2023-2033 (US$ Bn, AGR (%), CAGR (%))
Table 41 Global Solar Photovoltaic (PV) Market by Material, 2023-2033 (US$ Bn, AGR (%), CAGR (%))
Table 42 Global Solar Photovoltaic (PV) Market by Installation Type, 2023-2033 (US$ Bn, AGR (%), CAGR (%))
Table 43 Global Solar Photovoltaic (PV) Market by Application, 2023-2033 (US$ Bn, AGR (%), CAGR (%))
Table 44 North America Solar Photovoltaic (PV) Market by Value, 2023-2033 (US$ Bn, AGR (%), CAGR (%))
Table 45 North America Solar Photovoltaic (PV) Market by Cumulative Installed Capacity, 2023-2033 (GW, AGR (%), CAGR (%))
Table 46 North America Solar Photovoltaic (PV) Market by Country, 2023-2033 (US$ Bn, AGR (%), CAGR (%))
Table 47 North America Solar Photovoltaic (PV) Market by Cumulative Installed Capacity, 2023-2033 (GW, AGR (%), CAGR (%))
Table 48 North America Solar Photovoltaic (PV) Market by Cell Type, 2023-2033 (US$ Bn, AGR (%), CAGR (%))
Table 49 North America Solar Photovoltaic (PV) Market by Component, 2023-2033 (US$ Bn, AGR (%), CAGR (%))
Table 50 North America Solar Photovoltaic (PV) Market by Material, 2023-2033 (US$ Bn, AGR (%), CAGR (%))
Table 51 North America Solar Photovoltaic (PV) Market by Installation Type, 2023-2033 (US$ Bn, AGR (%), CAGR (%))
Table 52 North America Solar Photovoltaic (PV) Market by Application, 2023-2033 (US$ Bn, AGR (%), CAGR (%))
Table 53 US Solar Photovoltaic (PV) Market by Value, 2023-2033 (US$ Bn, AGR (%), CAGR (%))
Table 54 US Solar Photovoltaic (PV) Market by Cumulative Installed Capacity, 2023-2033 (GW, AGR (%), CAGR (%))
Table 55 Canada Solar Photovoltaic (PV) Market by Value, 2023-2033 (US$ Bn, AGR (%), CAGR (%))
Table 56 Canada Solar Photovoltaic (PV) Market by Cumulative Installed Capacity, 2023-2033 (GW, AGR (%), CAGR (%))
Table 57 Europe Solar Photovoltaic (PV) Market by Value, 2023-2033 (US$ Bn, AGR (%), CAGR (%))
Table 58 Europe Solar Photovoltaic (PV) Market by Cumulative Installed Capacity, 2023-2033 (GW, AGR (%), CAGR (%))
Table 59 Europe Solar Photovoltaic (PV) Market by Country, 2023-2033 (US$ Bn, AGR (%), CAGR (%))
Table 60 Europe Solar Photovoltaic (PV) Market by Country, 2023-2033 (US$ Bn, AGR (%), CAGR (%))
Table 61 Europe Solar Photovoltaic (PV) Market by Cell Type, 2023-2033 (US$ Bn, AGR (%), CAGR (%))
Table 62 Europe Solar Photovoltaic (PV) Market by Component, 2023-2033 (US$ Bn, AGR (%), CAGR (%))
Table 63 Europe Solar Photovoltaic (PV) Market by Material, 2023-2033 (US$ Bn, AGR (%), CAGR (%))
Table 64 Europe Solar Photovoltaic (PV) Market by Installation Type, 2023-2033 (US$ Bn, AGR (%), CAGR (%))
Table 65 Europe Solar Photovoltaic (PV) Market by Application, 2023-2033 (US$ Bn, AGR (%), CAGR (%))
Table 66 Germany Solar Photovoltaic (PV) Market by Value, 2023-2033 (US$ Bn, AGR (%), CAGR (%))
Table 67 Germany Solar Photovoltaic (PV) Market by Cumulative Installed Capacity, 2023-2033 (GW, AGR (%), CAGR (%))
Table 68 UK Solar Photovoltaic (PV) Market by Value, 2023-2033 (US$ Bn, AGR (%), CAGR (%))
Table 69 UK Solar Photovoltaic (PV) Market by Cumulative Installed Capacity, 2023-2033 (GW, AGR (%), CAGR (%))
Table 70 France Solar Photovoltaic (PV) Market by Value, 2023-2033 (US$ Bn, AGR (%), CAGR (%))
Table 71 France Solar Photovoltaic (PV) Market by Cumulative Installed Capacity, 2023-2033 (GW, AGR (%), CAGR (%))
Table 72 Italy Solar Photovoltaic (PV) Market by Value, 2023-2033 (US$ Bn, AGR (%), CAGR (%))
Table 73 Italy Solar Photovoltaic (PV) Market by Cumulative Installed Capacity, 2023-2033 (GW, AGR (%), CAGR (%))
Table 74 Spain Solar Photovoltaic (PV) Market by Value, 2023-2033 (US$ Bn, AGR (%), CAGR (%))
Table 75 Spain Solar Photovoltaic (PV) Market by Cumulative Installed Capacity, 2023-2033 (GW, AGR (%), CAGR (%))
Table 76 Rest of Europe Solar Photovoltaic (PV) Market by Value, 2023-2033 (US$ Bn, AGR (%), CAGR (%))
Table 77 Rest of Europe Solar Photovoltaic (PV) Market by Cumulative Installed Capacity, 2023-2033 (GW, AGR (%), CAGR (%))
Table 78 Asia-Pacific Solar Photovoltaic (PV) Market by Value, 2023-2033 (US$ Bn, AGR (%), CAGR (%))
Table 79 Asia-Pacific Solar Photovoltaic (PV) Market by Cumulative Installed Capacity, 2023-2033 (GW, AGR (%), CAGR (%))
Table 80 Asia-Pacific Solar Photovoltaic (PV) Market by Country, 2023-2033 (US$ Bn, AGR (%), CAGR (%))
Table 81 Asia-Pacific Solar Photovoltaic (PV) Market Cumulative Installed Capacity, by Country, 2023-2033 (GW, AGR (%), CAGR (%))
Table 82 Asia-Pacific Solar Photovoltaic (PV) Market by Cell Type, 2023-2033 (US$ Bn, AGR (%), CAGR (%))
Table 83 Asia-Pacific Solar Photovoltaic (PV) Market by Component, 2023-2033 (US$ Bn, AGR (%), CAGR (%))
Table 84 Asia-Pacific Solar Photovoltaic (PV) Market by Material, 2023-2033 (US$ Bn, AGR (%), CAGR (%))
Table 85 Asia-Pacific Solar Photovoltaic (PV) Market by Installation Type, 2023-2033 (US$ Bn, AGR (%), CAGR (%))
Table 86 Asia-Pacific Solar Photovoltaic (PV) Market by Application, 2023-2033 (US$ Bn, AGR (%), CAGR (%))
Table 87 China Solar Photovoltaic (PV) Market by Value, 2023-2033 (US$ Bn, AGR (%), CAGR (%))
Table 88 China Solar Photovoltaic (PV) Market by Cumulative Installed Capacity, 2023-2033 (GW, AGR (%), CAGR (%))
Table 89 India Solar Photovoltaic (PV) Market by Value, 2023-2033 (US$ Bn, AGR (%), CAGR (%))
Table 90 India Solar Photovoltaic (PV) Market by Cumulative Installed Capacity, 2023-2033 (GW, AGR (%), CAGR (%))
Table 91 Japan Solar Photovoltaic (PV) Market by Value, 2023-2033 (US$ Bn, AGR (%), CAGR (%))
Table 92 Japan Solar Photovoltaic (PV) Market by Cumulative Installed Capacity, 2023-2033 (GW, AGR (%), CAGR (%))
Table 93 South Korea Solar Photovoltaic (PV) Market by Value, 2023-2033 (US$ Bn, AGR (%), CAGR (%))
Table 94 South Korea Solar Photovoltaic (PV) Market by Cumulative Installed Capacity, 2023-2033 (GW, AGR (%), CAGR (%))
Table 95 Australia Solar Photovoltaic (PV) Market by Value, 2023-2033 (US$ Bn, AGR (%), CAGR (%))
Table 96 Australia Solar Photovoltaic (PV) Market by Cumulative Installed Capacity, 2023-2033 (GW, AGR (%), CAGR (%))
Table 97 Rest of Asia-Pacific Solar Photovoltaic (PV) Market by Value, 2023-2033 (US$ Bn, AGR (%), CAGR (%))
Table 98 Rest of Asia-Pacific Solar Photovoltaic (PV) Market by Cumulative Installed Capacity, 2023-2033 (GW, AGR (%), CAGR (%))
Table 99 Middle East & Africa Solar Photovoltaic (PV) Market by Value, 2023-2033 (US$ Bn, AGR (%), CAGR (%))
Table 100 Middle East & Africa Solar Photovoltaic (PV) Market by Cumulative Installed Capacity, 2023-2033 (GW, AGR (%), CAGR (%))
Table 101 Middle East & Africa Solar Photovoltaic (PV) Market by Country, 2023-2033 (US$ Bn, AGR (%), CAGR (%))
Table 102 Middle East & Africa Solar Photovoltaic (PV) Market by Volume by Country, 2023-2033 (GW, AGR (%), CAGR (%))
Table 103 Middle East & Africa Solar Photovoltaic (PV) Market by Cell Type, 2023-2033 (US$ Bn, AGR (%), CAGR (%))
Table 104 Middle East & Africa Solar Photovoltaic (PV) Market by Component, 2023-2033 (US$ Bn, AGR (%), CAGR (%))
Table 105 Middle East & Africa Solar Photovoltaic (PV) Market by Material, 2023-2033 (US$ Bn, AGR (%), CAGR (%))
Table 106 Middle East & Africa Solar Photovoltaic (PV) Market by Installation Type, 2023-2033 (US$ Bn, AGR (%), CAGR (%))
Table 107 Middle East & Africa Solar Photovoltaic (PV) Market by Application, 2023-2033 (US$ Bn, AGR (%), CAGR (%))
Table 108 GCC Solar Photovoltaic (PV) Market by Value, 2023-2033 (US$ Bn, AGR (%), CAGR (%))
Table 109 GCC Solar Photovoltaic (PV) Market by Cumulative Installed Capacity, 2023-2033 (GW, AGR (%), CAGR (%))
Table 110 South Africa Solar Photovoltaic (PV) Market by Value, 2023-2033 (US$ Bn, AGR (%), CAGR (%))
Table 111 South Africa Solar Photovoltaic (PV) Market by Cumulative Installed Capacity, 2023-2033 (GW, AGR (%), CAGR (%))
Table 112 Rest of Middle East & Africa Solar Photovoltaic (PV) Market by Value, 2023-2033 (US$ Bn, AGR (%), CAGR (%))
Table 113 Rest of Middle East & Africa Solar Photovoltaic (PV) Market by Cumulative Installed Capacity, 2023-2033 (GW, AGR (%), CAGR (%))
Table 114 Latin America Solar Photovoltaic (PV) Market by Value, 2023-2033 (US$ Bn, AGR (%), CAGR (%))
Table 115 Latin America Solar Photovoltaic (PV) Market by Cumulative Installed Capacity, 2023-2033 (GW, AGR (%), CAGR (%))
Table 116 Latin America Solar Photovoltaic (PV) Market by Country, 2023-2033 (US$ Bn, AGR (%), CAGR (%))
Table 117 Latin America Solar Photovoltaic (PV) Market Cumulative Installed Capacity, by Country, 2023-2033 (GW, AGR (%), CAGR (%))
Table 118 Latin America Solar Photovoltaic (PV) Market by Cell Type, 2023-2033 (US$ Bn, AGR (%), CAGR (%))
Table 119 Latin America Solar Photovoltaic (PV) Market by Component, 2023-2033 (US$ Bn, AGR (%), CAGR (%))
Table 120 Latin America Solar Photovoltaic (PV) Market by Material, 2023-2033 (US$ Bn, AGR (%), CAGR (%))
Table 121 Latin America Solar Photovoltaic (PV) Market by Installation Type, 2023-2033 (US$ Bn, AGR (%), CAGR (%))
Table 122 Latin America Solar Photovoltaic (PV) Market by Application, 2023-2033 (US$ Bn, AGR (%), CAGR (%))
Table 123 Brazil Solar Photovoltaic (PV) Market by Value, 2023-2033 (US$ Bn, AGR (%), CAGR (%))
Table 124 Brazil Solar Photovoltaic (PV) Market by Cumulative Installed Capacity, 2023-2033 (GW, AGR (%), CAGR (%))
Table 125 Mexico Solar Photovoltaic (PV) Market by Value, 2023-2033 (US$ Bn, AGR (%), CAGR (%))
Table 126 Mexico Solar Photovoltaic (PV) Market by Cumulative Installed Capacity, 2023-2033 (GW, AGR (%), CAGR (%))
Table 127 Rest of Latin America Solar Photovoltaic (PV) Market by Value, 2023-2033 (US$ Bn, AGR (%), CAGR (%))
Table 128 Rest of Latin America Solar Photovoltaic (PV) Market by Cumulative Installed Capacity, 2023-2033 (GW, AGR (%), CAGR (%))
Table 129 Acquisitions as Key Business Strategy
Table 130 Collaborations as Key Business Strategy
Table 131 New Product Launch as Key Business Strategy
Table 132 Investment as Key Business Strategy
Table 133 Joint Venture as Key Business Strategy
Table 134 Canadian Solar Inc: Key Details, (CEO, HQ, Revenue, Founded, No. of Employees, Company Type, Website, Business Segment)
Table 135 Canadian Solar Inc: Product Benchmarking
Table 136 Canadian Solar Inc: Strategic Outlook
Table 137 First Solar, Inc.: Key Details, (CEO, HQ, Revenue, Founded, No. of Employees, Company Type, Website, Business Segment)
Table 138 First Solar, Inc: Product Benchmarking
Table 139 First Solar, Inc: Strategic Outlook
Table 140 Hanwha Q Cells: Key Details, (CEO, HQ, Revenue, Founded, No. of Employees, Company Type, Website, Business Segment)
Table 141 Hanwha Q Cells: Product Benchmarking
Table 142 Hanwha Q Cells: Strategic Outlook
Table 143 Trina Solar Co., Ltd.: Key Details, (CEO, HQ, Revenue, Founded, No. of Employees, Company Type, Website, Business Segment)
Table 144 Trina Solar Co., Ltd.: Product Benchmarking
Table 145 Trina Solar Co., Ltd.: Strategic Outlook
Table 146 Yingli Green Energy Holding Company Limited: Key Details, (CEO, HQ, Revenue, Founded, No. of Employees, Company Type, Website, Business Segment)
Table 147 Yingli Green Energy Holding Company Limited: Product Benchmarking
Table 148 Yingli Green Energy Holding Company Limited: Strategic Outlook
Table 149 LG Electronics Inc: Key Details, (CEO, HQ, Revenue, Founded, No. of Employees, Company Type, Website, Business Segment)
Table 150 LG Electronics Inc: Product Benchmarking
Table 151 JinkoSolar Holding Co., Ltd.: Key Details, (CEO, HQ, Revenue, Founded, No. of Employees, Company Type, Website, Business Segment)
Table 152 JinkoSolar Holding Co., Ltd.: Product Benchmarking
Table 153 JinkoSolar Holding Co., Ltd.: Strategic Outlook
Table 154 JA Solar Holdings Co., Ltd.: Key Details, (CEO, HQ, Revenue, Founded, No. of Employees, Company Type, Website, Business Segment)
Table 155 JA Solar Holdings Co., Ltd.: Product Benchmarking
Table 156 JA Solar Holdings Co., Ltd.: Strategic Outlook
Table 157 LONGi Green Energy Technology: Key Details, (CEO, HQ, Revenue, Founded, No. of Employees, Company Type, Website, Business Segment)
Table 158 LONGi Green Energy Technology: Product Benchmarking
Table 159 LONGi Green Energy Technology: Strategic Outlook
Table 160 Suntech Power Holdings Co., Ltd.: Key Details, (CEO, HQ, Revenue, Founded, No. of Employees, Company Type, Website, Business Segment)
Table 161 Suntech Power Holdings Co., Ltd.: Product Benchmarking
Table 162 Sharp Corporation: Key Details, (CEO, HQ, Revenue, Founded, No. of Employees, Company Type, Website, Business Segment)
Table 163 Sharp Corporation: Product Benchmarking
Table 164 Sharp Corporation: Strategic Outlook
Table 165 ABB Ltd: Key Details, (CEO, HQ, Revenue, Founded, No. of Employees, Company Type, Website, Business Segment)
Table 166 ABB Ltd: Product Benchmarking
Table 167 Eaton Corporation plc: Key Details, (CEO, HQ, Revenue, Founded, No. of Employees, Company Type, Website, Business Segment)
Table 168 Eaton Corporation plc: Product Benchmarking
Table 169 Eaton Corporation plc: Strategic Outlook
Table 170 Waaree Energies Ltd.: Key Details, (CEO, HQ, Revenue, Founded, No. of Employees, Company Type, Website, Business Segment)
Table 171 Waaree Energies Ltd.: Product Benchmarking
Table 172 Waaree Energies Ltd.: Strategic Outlook
Table 173 EMMVEE Photovoltaic Power Private Limited: Key Details, (CEO, HQ, Revenue, Founded, No. of Employees, Company Type, Website, Business Segment)
Table 174 EMMVEE Photovoltaic Power Private Limited: Product Benchmarking
図の一覧
Figure 1 Solar Photovoltaic Market Segmentation
Figure 2 Solar Photovoltaic Market by Cell Type: Market Attractiveness Index
Figure 3 Solar Photovoltaic Market by Cell Component: Market Attractiveness Index
Figure 4 Solar Photovoltaic Market by Material: Market Attractiveness Index
Figure 5 Solar Photovoltaic Market by Installation Type: Market Attractiveness Index
Figure 6 Solar Photovoltaic Market by Application: Market Attractiveness Index
Figure 7 Solar Photovoltaic Market Attractiveness Index by Region
Figure 8 Solar Photovoltaic Market: Market Dynamics
Figure 9 COVID Impact Analysis: Solar Photovoltaic Market Recovery Scenarios
Figure 10 Global Solar Photovoltaic (PV) Market Forecast, 2023-2033 (US$ Bn, AGR (%)) (V-Shaped Recovery Scenario)
Figure 11 Global Solar Photovoltaic (PV) Market by Region, 2023-2033 (US$ Bn, AGR (%)) (V-Shaped Recovery Scenario)
Figure 12 Global Solar Photovoltaic (PV) Market Forecast, 2023-2033 (US$ Bn, AGR (%)) (W-Shaped Recovery Scenario)
Figure 13 Global Solar Photovoltaic (PV) Market by Region, 2023-2033 (US$ Bn, AGR (%)) (W-Shaped Recovery Scenario)
Figure 14 Global Solar Photovoltaic (PV) Market Forecast, 2023-2033 (US$ Bn, AGR (%)) (U-Shaped Recovery Scenario)
Figure 15 Global Solar Photovoltaic (PV) Market by Region, 2023-2033 (US$ Bn, AGR (%)) (U-Shaped Recovery Scenario)
Figure 16 Global Solar Photovoltaic (PV) Market Forecast, 2023-2033 (US$ Bn, AGR (%)) (L-Shaped Recovery Scenario)
Figure 17 Global Solar Photovoltaic (PV) Market by Region, 2023-2033 (US$ Bn, AGR (%)) (L-Shaped Recovery Scenario)
Figure 18 Solar Photovoltaic Market: Porter’s Five Forces Analysis
Figure 19 Solar Photovoltaic Market: PEST Analysis
Figure 20 Solar Photovoltaic Market by Cell Type: Market Attractiveness Index
Figure 21 Global Solar Photovoltaic (PV) Market by Cell Type, 2023-2033 (US$ Bn, AGR (%))
Figure 22 Full-Cell PV Modules Market by Region, 2023-2033 (US$ Bn, AGR (%))
Figure 23 Full-Cell PV Modules Market Share Forecast by Region, 2023 & 2033 (%)
Figure 24 Half-Cell PV Modules Market by Region, 2023-2033 (US$ Bn, AGR (%))
Figure 25 Half-Cell PV Modules Market Share Forecast by Region, 2023 & 2033 (%)
Figure 26 Solar Photovoltaic Market by Cell Component: Market Attractiveness Index
Figure 27 Global Solar Photovoltaic (PV) Market by Component, 2023-2033 (US$ Bn, AGR (%))
Figure 28 Modules Market by Region, 2023-2033 (US$ Bn, AGR (%))
Figure 29 Modules Market Share Forecast by Region, 2023 & 2033 (%)
Figure 30 Inverters Market by Region, 2023-2033 (US$ Bn, AGR (%))
Figure 31 Inverters Market Share Forecast by Region, 2023 & 2033 (%)
Figure 32 Balance of System (BOS) Market by Region, 2023-2033 (US$ Bn, AGR (%))
Figure 33 Balance of System (BOS) Market Share Forecast by Region, 2023 & 2033 (%)
Figure 34 Solar Photovoltaic Market by Material: Market Attractiveness Index
Figure 35 Global Solar Photovoltaic (PV) Market by Material, 2023-2033 (US$ Bn, AGR (%))
Figure 36 Crystalline Silicon (C-Si) Market by Region, 2023-2033 (US$ Bn, AGR (%))
Figure 37 Crystalline Silicon (C-Si) Market Share Forecast by Region, 2023 & 2033 (%)
Figure 38 Thin Film Market by Region, 2023-2033 (US$ Bn, AGR (%))
Figure 39 Thin Film Market Share Forecast by Region, 2023 & 2033 (%)
Figure 40 Copper Indium Gallium Selenide (CIGS) Market by Region, 2023-2033 (US$ Bn, AGR (%))
Figure 41 Copper Indium Gallium Selenide (CIGS) Market Share Forecast by Region, 2023 & 2033 (%)
Figure 42 Cadmium Telluride (CDTE) Market by Region, 2023-2033 (US$ Bn, AGR (%))
Figure 43 Cadmium Telluride (CDTE) Market Share Forecast by Region, 2023 & 2033 (%)
Figure 44 Solar Photovoltaic Market by Installation Type: Market Attractiveness Index
Figure 45 Global Solar Photovoltaic (PV) Market by Installation Type, 2023-2033 (US$ Bn, AGR (%))
Figure 46 Ground-mounted Market by Region, 2023-2033 (US$ Bn, AGR (%))
Figure 47 Ground-mounted Market Share Forecast by Region, 2023 & 2033 (%)
Figure 48 Rooftops Market by Region, 2023-2033 (US$ Bn, AGR (%))
Figure 49 Rooftops Market Share Forecast by Region, 2023 & 2033 (%)
Figure 50 Windows Market by Region, 2023-2033 (US$ Bn, AGR (%))
Figure 51 Windows Market Share Forecast by Region, 2023 & 2033 (%)
Figure 52 Floating PV Market by Region, 2023-2033 (US$ Bn, AGR (%))
Figure 53 Floating PV Market Share Forecast by Region, 2023 & 2033 (%)
Figure 54 Other Installation Type Market by Region, 2023-2033 (US$ Bn, AGR (%))
Figure 55 Other Installation Type Market Share Forecast by Installation Type, 2023 & 2033 (%)
Figure 56 Solar Photovoltaic Market by Application: Market Attractiveness Index
Figure 57 Global Solar Photovoltaic (PV) Market by Application, 2023-2033 (US$ Bn, AGR (%))
Figure 58 Residential and Commercial Buildings Market by Region, 2023-2033 (US$ Bn, AGR (%))
Figure 59 Residential and Commercial Buildings Market by Region, 2023 & 2033 (%)
Figure 60 Remote Power Systems Market by Region, 2023-2033 (US$ Bn, AGR (%))
Figure 61 Remote Power Systems Market Share Forecast by Region, 2023 & 2033 (%)
Figure 62 Transportation Market by Region, 2023-2033 (US$ Bn, AGR (%))
Figure 63 Transportation Market Share Forecast by Application, 2023 & 2033 (%)
Figure 64 Solar Farms Market by Region, 2023-2033 (US$ Bn, AGR (%))
Figure 65 Solar Farms Market Share Forecast by Region, 2023 & 2033 (%)
Figure 66 Portable Electronic Devices Market by Region, 2023-2033 (US$ Bn, AGR (%))
Figure 67 Portable Electronic Devices Market Share Forecast by Region, 2023 & 2033 (%)
Figure 68 Other Applications Market by Region, 2023-2033 (US$ Bn, AGR (%))
Figure 69 Other Application Market Share Forecast by Region, 2023 & 2033 (%)
Figure 70 Global Solar Photovoltaic (PV) Market Forecast, 2023-2033 (US$ Bn, AGR (%))
Figure 71 Global Solar Photovoltaic (PV) Market Cumulative Installed Capacity, 2023-2033 (GW, AGR (%))
Figure 72 Global Solar Photovoltaic (PV) Market by Region, 2023-2033 (US$ Bn, AGR (%))
Figure 73 Global Solar Photovoltaic (PV) Market Cumulative Installed Capacity, by region, 2023-2033 (GW, AGR (%))
Figure 74 Global Solar Photovoltaic (PV) Market by Cell Type, 2023-2033 (US$ Bn, AGR (%))
Figure 75 Global Solar Photovoltaic (PV) Market by Component, 2023-2033 (US$ Bn, AGR (%))
Figure 76 Global Solar Photovoltaic (PV) Market by Material, 2023-2033 (US$ Bn, AGR (%))
Figure 77 Global Solar Photovoltaic (PV) Market by Installation Type, 2023-2033 (US$ Bn, AGR (%))
Figure 78 Global Solar Photovoltaic (PV) Market by Application, 2023-2033 (US$ Bn, AGR (%))
Figure 79 North America Solar Photovoltaic Market Attractiveness Index
Figure 80 North America Solar Photovoltaic (PV) Market by Value, 2023-2033 (US$ Bn, AGR (%))
Figure 81 North America Solar Photovoltaic (PV) Market by Cumulative Installed Capacity, 2023-2033 (GW, AGR (%))
Figure 82 North America Solar Photovoltaic (PV) Market by Country, 2023-2033 (US$ Bn, AGR (%))
Figure 83 North America Solar Photovoltaic (PV) Market by Cumulative Installed Capacity, 2023-2033 (GW, AGR (%))
Figure 84 North America Solar Photovoltaic (PV) Market Share Forecast by Country, 2023-2033 (%)
Figure 85 North America Solar Photovoltaic (PV) Market by Cell Type, 2023-2033 (US$ Bn, AGR (%))
Figure 86 North America Solar Photovoltaic (PV) Market Share Forecast by Cell Type, 2023-2033 (%)
Figure 87 North America Solar Photovoltaic (PV) Market by Component, 2023-2033 (US$ Bn, AGR (%))
Figure 88 North America Solar Photovoltaic (PV) Market Share Forecast by Component, 2023-2033 (%)
Figure 89 North America Solar Photovoltaic (PV) Market by Material, 2023-2033 (US$ Bn, AGR (%))
Figure 90 North America Solar Photovoltaic (PV) Market Share Forecast by Material, 2023-2033 (%)
Figure 91 North America Solar Photovoltaic (PV) Market by Installation Type, 2023-2033 (US$ Bn, AGR (%))
Figure 92 North America Solar Photovoltaic (PV) Market Share Forecast by Installation Type, 2023-2033 (%)
Figure 93 North America Solar Photovoltaic (PV) Market by Application, 2023-2033 (US$ Bn, AGR (%))
Figure 94 North America Solar Photovoltaic (PV) Market Share Forecast by Application, 2023-2033 (%)
Figure 95 US Solar Photovoltaic (PV) Market by Value, 2023-2033 (US$ Bn, AGR (%))
Figure 96 US Solar Photovoltaic (PV) Market by Cumulative Installed Capacity, 2023-2033 (GW, AGR (%))
Figure 97 Canada Solar Photovoltaic (PV) Market by Value, 2023-2033 (US$ Bn, AGR (%))
Figure 98 Canada Solar Photovoltaic (PV) Market by Cumulative Installed Capacity, 2023-2033 (GW, AGR (%))
Figure 99 Europe Solar Photovoltaic Market Attractiveness Index
Figure 100 Europe Solar Photovoltaic (PV) Market by Value, 2023-2033 (US$ Bn, AGR (%))
Figure 101 Europe Solar Photovoltaic (PV) Market by Cumulative Installed Capacity, 2023-2033 (GW, AGR (%))
Figure 102 Europe Solar Photovoltaic (PV) Market by Country, 2023-2033 (US$ Bn, AGR (%))
Figure 103 Europe Solar Photovoltaic (PV) Market by Country, 2023-2033 (US$ Bn, AGR (%))
Figure 104 Europe Solar Photovoltaic (PV) Market Share Forecast by Country, 2023-2033 (%)
Figure 105 Europe Solar Photovoltaic (PV) Market by Cell Type, 2023-2033 (US$ Bn, AGR (%))
Figure 106 Europe Solar Photovoltaic (PV) Market Share Forecast by Cell Type, 2023-2033 (%)
Figure 107 Europe Solar Photovoltaic (PV) Market by Component, 2023-2033 (US$ Bn, AGR (%))
Figure 108 Europe Solar Photovoltaic (PV) Market Share Forecast by Component, 2023-2033 (%)
Figure 109 Europe Solar Photovoltaic (PV) Market by Material, 2023-2033 (US$ Bn, AGR (%))
Figure 110 Europe Solar Photovoltaic (PV) Market Share Forecast by Material, 2023-2033 (%)
Figure 111 Europe Solar Photovoltaic (PV) Market Forecast by Region, 2022-2032 (US$ billion)
Figure 112 Europe Solar Photovoltaic (PV) Market Share Forecast by Installation Type, 2023-2033 (%)
Figure 113 Europe Market Forecast by Application, 2023-2033 (US$ billion)
Figure 114 Europe Solar Photovoltaic (PV) Market Share Forecast by Application, 2023-2033 (%)
Figure 115 Germany Solar Photovoltaic (PV) Market by Value, 2023-2033 (US$ Bn, AGR (%))
Figure 116 Germany Solar Photovoltaic (PV) Market by Cumulative Installed Capacity, 2023-2033 (GW, AGR (%))
Figure 117 UK Solar Photovoltaic (PV) Market by Value, 2023-2033 (US$ Bn, AGR (%))
Figure 118 UK Solar Photovoltaic (PV) Market by Cumulative Installed Capacity, 2023-2033 (GW, AGR (%))
Figure 119 France Solar Photovoltaic (PV) Market by Value, 2023-2033 (US$ Bn, AGR (%))
Figure 120 France Solar Photovoltaic (PV) Market by Cumulative Installed Capacity, 2023-2033 (GW, AGR (%))
Figure 121 Italy Solar Photovoltaic (PV) Market by Value, 2023-2033 (US$ Bn, AGR (%))
Figure 122 Italy Solar Photovoltaic (PV) Market by Cumulative Installed Capacity, 2023-2033 (GW, AGR (%))
Figure 123 Spain Solar Photovoltaic (PV) Market by Value, 2023-2033 (US$ Bn, AGR (%))
Figure 124 Spain Solar Photovoltaic (PV) Market by Cumulative Installed Capacity, 2023-2033 (GW, AGR (%))
Figure 125 Rest of Europe Solar Photovoltaic (PV) Market by Value, 2023-2033 (US$ Bn, AGR (%))
Figure 126 Rest of Europe Solar Photovoltaic (PV) Market by Cumulative Installed Capacity, 2023-2033 (GW, AGR (%))
Figure 127 Asia Pacific Solar Photovoltaic Market Attractiveness Index
Figure 128 Asia-Pacific Solar Photovoltaic (PV) Market Forecast by Region, 2022-2032 (US$ billion)
Figure 129 Asia-Pacific Solar Photovoltaic (PV) Market by Cumulative Installed Capacity, 2023-2033 (GW, AGR (%))
Figure 130 Asia-Pacific Solar Photovoltaic (PV) Market by Country, 2023-2033 (US$ Bn, AGR (%))
Figure 131 Asia-Pacific Solar Photovoltaic (PV) Market Cumulative Installed Capacity, by Country, 2023-2033 (GW, AGR (%))
Figure 132 Asia-Pacific Solar Photovoltaic (PV) Market Share Forecast by Country, 2023-2033 (%)
Figure 133 Asia-Pacific Market Forecast by Cell Type, 2022-2032 (US$ billion)
Figure 134 Asia-Pacific Solar Photovoltaic (PV) Market Share Forecast by Cell Type, 2023-2033 (%)
Figure 135 Asia-Pacific Solar Photovoltaic (PV) Market by Component, 2023-2033 (US$ Bn, AGR (%))
Figure 136 Asia-Pacific Solar Photovoltaic (PV) Market Share Forecast by Component, 2023-2033 (%)
Figure 137 Asia-Pacific Solar Photovoltaic (PV) Market by Material, 2023-2033 (US$ Bn, AGR (%))
Figure 138 Asia-Pacific Solar Photovoltaic (PV) Market Share Forecast by Material, 2023-2033 (%)
Figure 139 Asia-Pacific Solar Photovoltaic (PV) Market by Installation Type, 2023-2033 (US$ Bn, AGR (%))
Figure 140 Asia-Pacific Solar Photovoltaic (PV) Market Share Forecast by Installation Type, 2023-2033 (%)
Figure 141 Asia-Pacific Solar Photovoltaic (PV) Market by Application, 2023-2033 (US$ Bn, AGR (%))
Figure 142 Asia-Pacific Solar Photovoltaic (PV) Market Share Forecast by Application, 2023-2033 (%)
Figure 143 China Solar Photovoltaic (PV) Market by Value, 2023-2033 (US$ Bn, AGR (%))
Figure 144 China Solar Photovoltaic (PV) Market by Cumulative Installed Capacity, 2023-2033 (GW, AGR (%))
Figure 145 India Solar Photovoltaic (PV) Market by Value, 2023-2033 (US$ Bn, AGR (%))
Figure 146 India Solar Photovoltaic (PV) Market by Cumulative Installed Capacity, 2023-2033 (GW, AGR (%))
Figure 147 Japan Solar Photovoltaic (PV) Market by Value, 2023-2033 (US$ Bn, AGR (%))
Figure 148 Japan Solar Photovoltaic (PV) Market by Cumulative Installed Capacity, 2023-2033 (GW, AGR (%))
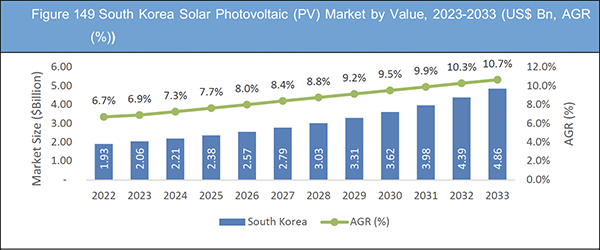
Figure 149 South Korea Solar Photovoltaic (PV) Market by Value, 2023-2033 (US$ Bn, AGR (%))
Figure 150 South Korea Solar Photovoltaic (PV) Market by Cumulative Installed Capacity, 2023-2033 (GW, AGR (%))
Figure 151 Australia Solar Photovoltaic (PV) Market by Value, 2023-2033 (US$ Bn, AGR (%))
Figure 152 Australia Solar Photovoltaic (PV) Market by Cumulative Installed Capacity, 2023-2033 (GW, AGR (%))
Figure 153 Rest of Asia-Pacific Solar Photovoltaic (PV) Market by Value, 2023-2033 (US$ Bn, AGR (%))
Figure 154 Rest of Asia-Pacific Solar Photovoltaic (PV) Market by Cumulative Installed Capacity, 2023-2033 (GW, AGR (%))
Figure 155 Middle East & Africa Solar Photovoltaic Market Attractiveness Index
Figure 156 Middle East & Africa Solar Photovoltaic (PV) Market by Value, 2023-2033 (US$ Bn, AGR (%))
Figure 157 Middle East & Africa Solar Photovoltaic (PV) Market by Cumulative Installed Capacity, 2023-2033 (GW, AGR (%))
Figure 158 Middle East & Africa Solar Photovoltaic (PV) Market by Country, 2023-2033 (US$ Bn, AGR (%))
Figure 159 Middle East & Africa Solar Photovoltaic (PV) Market by Volume by Country, 2023-2033 (GW, AGR (%))
Figure 160 Middle East & Africa Solar Photovoltaic (PV) Market Share Forecast by Country, 2023-2033 (%)
Figure 161 Middle East & Africa Solar Photovoltaic (PV) Market by Cell Type, 2023-2033 (US$ Bn, AGR (%))
Figure 162 Middle East & Africa Solar Photovoltaic (PV) Market Share Forecast by Cell Type, 2023-2033 (%)
Figure 163 Middle East & Africa Market Forecast by Component, 2022-2032 (US$ billion)
Figure 164 Middle East & Africa Solar Photovoltaic (PV) Market Share Forecast by Component, 2023-2033 (%)
Figure 165 Middle East & Africa Solar Photovoltaic (PV) Market by Material, 2023-2033 (US$ Bn, AGR (%))
Figure 166 Middle East & Africa Solar Photovoltaic (PV) Market Share Forecast by Material, 2023-2033 (%)
Figure 167 Middle East & Africa Solar Photovoltaic (PV) Market by Installation Type, 2023-2033 (US$ Bn, AGR (%))
Figure 168 Middle East & Africa Solar Photovoltaic (PV) Market Share Forecast by Installation Type, 2023-2033 (%)
Figure 169 Middle East & Africa Solar Photovoltaic (PV) Market by Application, 2023-2033 (US$ Bn, AGR (%))
Figure 170 Middle East & Africa Solar Photovoltaic (PV) Market Share Forecast by Application, 2023-2033 (%)
Figure 171 GCC Solar Photovoltaic (PV) Market by Value, 2023-2033 (US$ Bn, AGR (%))
Figure 172 GCC Solar Photovoltaic (PV) Market by Cumulative Installed Capacity, 2023-2033 (GW, AGR (%))
Figure 173 South Africa Solar Photovoltaic (PV) Market by Value, 2023-2033 (US$ Bn, AGR (%))
Figure 174 South Africa Solar Photovoltaic (PV) Market by Cumulative Installed Capacity, 2023-2033 (GW, AGR (%))
Figure 175 Rest of Middle East & Africa Solar Photovoltaic (PV) Market by Value, 2023-2033 (US$ Bn, AGR (%))
Figure 176 Rest of Middle East & Africa Solar Photovoltaic (PV) Market by Cumulative Installed Capacity, 2023-2033 (GW, AGR (%))
Figure 177 Latin America Solar Photovoltaic Market Attractiveness Index
Figure 178 Latin America Solar Photovoltaic (PV) Market by Value, 2023-2033 (US$ Bn, AGR (%))
Figure 179 Latin America Solar Photovoltaic (PV) Market by Cumulative Installed Capacity, 2023-2033 (GW, AGR (%))
Figure 180 Latin America Solar Photovoltaic (PV) Market by Country, 2023-2033 (US$ Bn, AGR (%))
Figure 181 Latin America Solar Photovoltaic (PV) Market Cumulative Installed Capacity, by Country, 2023-2033 (GW, AGR (%))
Figure 182 Latin America Solar Photovoltaic (PV) Market Share Forecast by Country, 2023-2033 (%)
Figure 183 Latin America Solar Photovoltaic (PV) Market by Cell Type, 2023-2033 (US$ Bn, AGR (%))
Figure 184 Latin America Solar Photovoltaic (PV) Market Share Forecast by Cello Type, 2023-2033 (%)
Figure 185 Latin America Solar Photovoltaic (PV) Market by Component, 2023-2033 (US$ Bn, AGR (%))
Figure 186 Latin America Solar Photovoltaic (PV) Market Share Forecast by Component, 2023-2033 (%)
Figure 187 Latin America Solar Photovoltaic (PV) Market by Material, 2023-2033 (US$ Bn, AGR (%))
Figure 188 Latin America Solar Photovoltaic (PV) Market Share Forecast by Material, 2023-2033 (%)
Figure 189 Latin America Solar Photovoltaic (PV) Market by Installation Type, 2023-2033 (US$ Bn, AGR (%))
Figure 190 Latin America Solar Photovoltaic (PV) Market Share Forecast by Installation Type, 2023-2033 (%)
Figure 191 Latin America Solar Photovoltaic (PV) Market by Application, 2023-2033 (US$ Bn, AGR (%))
Figure 192 Latin America Solar Photovoltaic (PV) Market Share Forecast by Application, 2023-2033 (%)
Figure 193 Brazil Solar Photovoltaic (PV) Market by Value, 2023-2033 (US$ Bn, AGR (%))
Figure 194 Brazil Solar Photovoltaic (PV) Market by Cumulative Installed Capacity, 2023-2033 (GW, AGR (%))
Figure 195 Mexico Solar Photovoltaic (PV) Market by Value, 2023-2033 (US$ Bn, AGR (%))
Figure 196 Mexico Solar Photovoltaic (PV) Market by Cumulative Installed Capacity, 2023-2033 (GW, AGR (%))
Figure 197 Rest of Latin America Solar Photovoltaic (PV) Market by Value, 2023-2033 (US$ Bn, AGR (%))
Figure 198 Rest of Latin America Solar Photovoltaic (PV) Market by Cumulative Installed Capacity, 2023-2033 (GW, AGR (%))
Figure 199 Solar Photovoltaic Market: Company Share, 2022
Figure 200 Canadian Solar Inc: Net Revenue, 2017-2021 (US$ million, AGR%)
Figure 201 Canadian Solar Inc: R&D, 2017-2021 (US$ million, AGR%)
Figure 202 Canadian Solar Inc: Regional Revenue Shares, 2021 (%)
Figure 203 Canadian Solar Inc: Business Segment Revenue Shares, 2021 (%)
Figure 204 First Solar, Inc: Net Revenue, 2018-2022 (US$ million, AGR%)
Figure 205 First Solar, Inc: R&D, 2018-2022 (US$ million, AGR%)
Figure 206 First Solar, Inc: Regional Revenue Shares, 2022
Figure 207 Yingli Green Energy Holding Company Limited: Net Revenue, 2018-2022 (US$ million, AGR%)
Figure 208 LG Electronics Inc: Net Revenue, 2018-2022 (US$ million, AGR%)
Figure 209 LG Electronics Inc: R&D, 2018-2022 (US$ million, AGR%)
Figure 210 LG Electronics Inc: Regional Revenue Shares, 2022 (%)
Figure 211 LG Electronics Inc: Business Segment Revenue Shares, 2022 (%)
Figure 212 JinkoSolar Holding Co., Ltd.: Net Revenue, 2017-2021 (US$ million, AGR%)
Figure 213 JinkoSolar Holding Co., Ltd.: R&D, 2017-2021 (US$ million, AGR%)
Figure 214 JinkoSolar Holding Co., Ltd.: Regional Revenue Shares, 2021 (%)
Figure 215 JinkoSolar Holding Co., Ltd.: Business Segment Revenue Shares, 2021 (%)
Figure 216 JA Solar Holdings Co., Ltd.: Net Revenue, 2018-2022 (US$ million, AGR%)
Figure 217 Sharp Corporation: Net Revenue, 2018-2022 (US$ million, AGR%)
Figure 218 Sharp Corporation: R&D, 2018-2022 (US$ million, AGR%)
Figure 219 Sharp Corporation: Regional Revenue Shares, 2022 (%)
Figure 220 Sharp Corporation: Business Segment Revenue Shares, 2022 (%)
Figure 221 ABB Ltd: Net Revenue 2018-2022 (US$ million, AGR%)
Figure 222 ABB Ltd: R&D, 2018-2022 (US$ million, AGR%)
Figure 223 ABB Ltd: Business Segment Revenue Shares, 2022 (%)
Figure 224 Eaton Corporation plc: Net Revenue, 2018-2022 (US$ million, AGR%)
Figure 225 Eaton Corporation plc: R&D, 2018-2022 (US$ million, AGR%)
Figure 226 Eaton Corporation plc: Regional Revenue Shares, 2022 (%)
Figure 227 Eaton Corporation plc: Business Segment Revenue Shares, 2022 (%)
ページTOPに戻る
Summary
Report Details
The Solar Photovoltaic (PV) Market Report 2023-2033: This report will prove invaluable to leading firms striving for new revenue pockets if they wish to better understand the industry and its underlying dynamics. It will be useful for companies that would like to expand into different industries or to expand their existing operations in a new region.
One of the Key Drivers of the Solar PV Market Has Been the Falling Costs of Solar Panels and Associated Technologies
The solar PV market has witnessed significant growth in recent years, driven by increasing demand for renewable energy sources and the development of government policies and incentives aimed at encouraging the adoption of solar power. Solar PV technology involves the use of photovoltaic cells to convert sunlight into electricity. As the world becomes more environmentally conscious, there has been a growing demand for sustainable energy sources to replace fossil fuels, which has helped to spur the growth of the solar PV market.
One of the key drivers of the solar PV market has been the falling costs of solar panels and associated technologies. As solar PV technology has matured and become more widely adopted, economies of scale and technological advancements have led to significant reductions in the cost of solar panels. This has made solar power a more affordable option for households and businesses, and has helped to drive further adoption of the technology.
Another factor driving the growth of the solar PV market has been the development of government policies and incentives aimed at encouraging the adoption of solar power. Governments around the world have recognized the need to transition towards more sustainable energy sources, and have implemented policies and incentives to support the development and deployment of renewable energy technologies. These policies have included feed-in tariffs, tax credits, and renewable energy targets, all of which have helped to drive the growth of the solar PV market.
What Questions Should You Ask before Buying a Market Research Report?
• How is the solar photovoltaic (PV) market evolving?
• What is driving and restraining the solar photovoltaic (PV) market?
• How will each solar photovoltaic (PV) submarket segment grow over the forecast period and how much revenue will these submarkets account for in 2033?
• How will the market shares for each solar photovoltaic (PV) submarket develop from 2023 to 2033?
• What will be the main driver for the overall market from 2023 to 2033?
• Will leading solar photovoltaic (PV) markets broadly follow the macroeconomic dynamics, or will individual national markets outperform others?
• How will the market shares of the national markets change by 2033 and which geographical region will lead the market in 2033?
• Who are the leading players and what are their prospects over the forecast period?
• What are the solar photovoltaic (PV) projects for these leading companies?
• How will the industry evolve during the period between 2023 and 2033? What are the implications of solar photovoltaic (PV) projects taking place now and over the next 10 years?
• Is there a greater need for product commercialisation to further scale the solar photovoltaic (PV) market?
• Where is the solar photovoltaic (PV) market heading and how can you ensure you are at the forefront of the market?
• What are the best investment options for new product and service lines?
• What are the key prospects for moving companies into a new growth path and C-suite?
You need to discover how this will impact the solar photovoltaic (PV) market today, and over the next 10 years:
• Our 355-page report provides 174 tables and 227 charts/graphs exclusively to you.
• The report highlights key lucrative areas in the industry so you can target them – NOW.
• It contains in-depth analysis of global, regional and national sales and growth.
• It highlights for you the key successful trends, changes and revenue projections made by your competitors.
This report tells you TODAY how the solar photovoltaic (PV) market will develop in the next 10 years, and in line with the variations in COVID-19 economic recession and bounce. This market is more critical now than at any point over the last 10 years.
Forecasts to 2033 and other analyses reveal commercial prospects
• In addition to revenue forecasting to 2033, our new study provides you with recent results, growth rates, and market shares.
• You will find original analyses, with business outlooks and developments.
• Discover qualitative analyses (including market dynamics, drivers, opportunities, restraints and challenges), cost structure, impact of rising solar photovoltaic (PV) prices and recent developments.
This report includes data analysis and invaluable insight into how COVID-19 will affect the industry and your company. Four COVID-19 recovery patterns and their impact, namely, “V”, “L”, “W” and “U” are discussed in this report.
Segments Covered in the Report
Market Segment by
• Market in terms of Value (US$ Billion)
• Market In terms of Cumulative Installed Capacity (GW)
Market Segment by Cell Type
• Full-Cell PV Modules
• Half-Cell PV Modules
Market Segment by Component
• Modules
• Inverters
• Balance of System (BOS)
Market Segment by Material
• Crystalline Silicon (C-Si)
• Thin Film
• Copper Indium Gallium Selenide (CIGS)
• Cadmium Telluride (CDTE)
Market Segment by Installation Type
• Ground-mounted
• Rooftops
• Windows
• Floating PV
• Other Installation Type
Market Segment by Application
• Residential and Commercial Buildings
• Remote Power Systems
• Transportation
• Solar Farms
• Portable Electronic Devices
• Other Application
In addition to the revenue predictions for the overall world market and segments, you will also find revenue forecasts for four regional and 20 leading national markets:
North America
• U.S.
• Canada
Europe
• Germany
• Spain
• United Kingdom
• France
• Italy
• Rest of Europe
Asia Pacific
• China
• Japan
• India
• Australia
• South Korea
• Rest of Asia Pacific
Latin America
• Brazil
• Mexico
• Rest of Latin America
Middle East & Africa
• GCC
• South Africa
• Rest of Middle East & Africa
The report also includes profiles and for some of the leading companies in the Solar Photovoltaic (PV) Market, 2023 to 2033, with a focus on this segment of these companies’ operations.
Leading companies and the potential for market growth
• ABB Ltd.
• Canadian Solar Inc.
• Eaton Corporation plc
• EMMVEE Photovoltaic Power Private Limited
• First Solar, Inc.
• Hanwha Q Cells
• JA Solar Holdings Co., Ltd.
• JinkoSolar Holding Co., Ltd.
• LG Electronics Inc.
• LONGi Green Energy Technology
• Sharp Corporation
• Suntech Power Holdings Co., Ltd.
• Trina Solar Co., Ltd.
• Waaree Energies Limited
• Yingli Green Energy Holding Company Limited
Overall world revenue for Solar Photovoltaic (PV) Market, 2023 to 2033 in terms of value the market will surpass US$117.94 billion in 2023, our work calculates. We predict strong revenue growth through to 2033. Our work identifies which organizations hold the greatest potential. Discover their capabilities, progress, and commercial prospects, helping you stay ahead.
How will the Solar Photovoltaic (PV) Market, 2023 to 2033 report help you?
In summary, our 350+ page report provides you with the following knowledge:
• Revenue forecasts to 2033 for Solar Photovoltaic (PV) Market, 2023 to 2033 Market, with forecasts for market value, cumulative installed capacity, cell type, component, material, installation type, application and company size, each forecast at a global and regional level – discover the industry’s prospects, finding the most lucrative places for investments and revenues.
• Revenue forecasts to 2033 for four regional and 20 key national markets – See forecasts for the Solar Photovoltaic (PV) Market, 2023 to 2033 market in North America, Europe, Asia-Pacific, Latin America and Middle East & Africa. Also forecasted is the market in the US, Canada, Brazil, Germany, France, UK, Italy, China, India, Japan, and Australia among other prominent economies.
• Prospects for established firms and those seeking to enter the market – including company profiles for 15 of the major companies involved in the Solar Photovoltaic (PV) Market, 2023 to 2033.
Find quantitative and qualitative analyses with independent predictions. Receive information that only our report contains, staying informed with invaluable business intelligence.
Information found nowhere else
With our new report, you are less likely to fall behind in knowledge or miss out on opportunities. See how our work could benefit your research, analyses, and decisions. Visiongain’s study is for everybody needing commercial analyses for the Solar Photovoltaic (PV) Market, 2023 to 2033, market-leading companies. You will find data, trends and predictions.
ページTOPに戻る
Table of Contents
Table of Contents
1 Report Overview
1.1 Objectives of the Study
1.2 Introduction to Solar Photovoltaic Market
1.3 What This Report Delivers
1.4 Why You Should Read This Report
1.5 Key Questions Answered by This Analytical Report
1.6 Who is This Report for?
1.7 Research Methodology
1.7.1 Market Definitions
1.7.2 Market Evaluation & Forecasting Methodology
1.7.3 Data Validation
1.7.3.1 Primary Research
1.7.3.2 Secondary Research
1.8 Frequently Asked Questions (FAQs)
1.9 Associated Visiongain Reports
1.10 About Visiongain
2 Executive Summary
2.1 Segment Analysis
2.1.1 Cell Type Segment: Market Attractiveness Index
2.1.2 Cell Component Segment: Market Attractiveness Index
2.1.3 Material Segment: Market Attractiveness Index
2.1.4 Installation Type Segment: Market Attractiveness Index
2.1.5 Application Segment: Market Attractiveness Index
2.2 Regional Analysis
3 Market Overview
3.1 Key Findings
3.2 Market Dynamics
3.2.1 Market Driving Factors
3.2.1.1 Government Support Aiding the Growth of the Market
3.2.1.2 Cost Reduction in Manufacturing Solar PV Modules
3.2.1.3 Environmental Concerns: A Major Scope for Improvement
3.2.2 Market Restraining Factors
3.2.2.1 High Initial Costs Restraining the Growth of the Market
3.2.2.2 Intermittency: Dependent on Weather Conditions
3.2.2.3 Technical Limitations Limit the Market Growth
3.2.3 Market Opportunities
3.2.3.1 Technological Innovations to Boost Solar PV Market
3.2.3.2 Emerging Markets in the Developing Nations of the World
3.2.3.3 Energy Storage Emerging as a New Aspect to Study
3.3 COVID-19 Impact Analysis
3.3.1 V-Shaped Recovery
3.3.2 W-Shaped Recovery
3.3.3 U-Shaped Recovery
3.3.4 L-Shaped Recovery
3.4 Porter’s Five Forces Analysis
3.4.1 Threat of New Entrants
3.4.2 Bargaining Power of Suppliers
3.4.3 Bargaining Power of Buyers
3.4.4 Threat of Substitutes
3.4.5 Competitive Rivalry
3.5 PEST Analysis
3.5.1 Political Factors
3.5.2 Economic Factors
3.5.3 Social Factors
3.5.4 Technological Factors
4 Solar Photovoltaic Market Analysis by Cell Type
4.1 Key Findings
4.2 Cell Type Segment: Market Attractiveness Index
4.3 Solar Photovoltaic Market Size Estimation and Forecast by Cell Type
4.4 Full-Cell PV Modules
4.4.1 Market Size by Region, 2023-2033 (US$ Bn)
4.4.2 Market Share by Region, 2023 & 2033 (%)
4.5 Half-Cell PV Modules
4.5.1 Market Size by Region, 2023-2033 (US$ Bn)
4.5.2 Market Share by Region, 2023 & 2033 (%)
5 Solar Photovoltaic Market Analysis by Component
5.1 Key Findings
5.2 Cell Component Segment: Market Attractiveness Index
5.3 Solar Photovoltaic Market Size Estimation and Forecast by Cell Component
5.4 Modules
5.4.1 Market Size by Region, 2023-2033 (US$ Bn)
5.4.2 Market Share by Region, 2023 & 2033 (%)
5.5 Inverters
5.5.1 Market Size by Region, 2023-2033 (US$ Bn)
5.5.2 Market Share by Region, 2023 & 2033 (%)
5.6 Balance of System (BOS)
5.6.1 Market Size by Region, 2023-2033 (US$ Bn)
5.6.2 Market Share by Region, 2023 & 2033 (%)
6 Solar Photovoltaic Market Analysis by Material
6.1 Key Findings
6.2 Material Segment: Market Attractiveness Index
6.3 Solar Photovoltaic Market Size Estimation and Forecast by Material
6.4 Crystalline Silicon (C-Si)
6.4.1 Market Size by Region, 2023-2033 (US$ Bn)
6.4.2 Market Share by Region, 2023 & 2033 (%)
6.5 Thin Film
6.5.1 Market Size by Region, 2023-2033 (US$ Bn)
6.5.2 Market Share by Region, 2023 & 2033 (%)
6.6 Copper Indium Gallium Selenide (CIGS)
6.6.1 Market Size by Region, 2023-2033 (US$ Bn)
6.6.2 Market Share by Region, 2023 & 2033 (%)
6.7 Cadmium Telluride (CDTE)
6.7.1 Market Size by Region, 2023-2033 (US$ Bn)
6.7.2 Market Share by Region, 2023 & 2033 (%)
7 Solar Photovoltaic Market Analysis by Installation Type
7.1 Key Findings
7.2 Installation Type Segment: Market Attractiveness Index
7.3 Solar Photovoltaic Market Size Estimation and Forecast by Installation Type
7.4 Ground-mounted
7.4.1 Market Size by Region, 2023-2033 (US$ Bn)
7.4.2 Market Share by Region, 2023 & 2033 (%)
7.5 Rooftops
7.5.1 Market Size by Region, 2023-2033 (US$ Bn)
7.5.2 Market Share by Region, 2023 & 2033 (%)
7.6 Windows
7.6.1 Market Size by Region, 2023-2033 (US$ Bn)
7.6.2 Market Share by Region, 2023 & 2033 (%)
7.7 Floating
7.7.1 Market Size by Region, 2023-2033 (US$ Bn)
7.7.2 Market Share by Region, 2023 & 2033 (%)
7.8 Other Installation Type
7.8.1 Market Size by Region, 2023-2033 (US$ Bn)
7.8.2 Market Share by Region, 2023 & 2033 (%)
8 Solar Photovoltaic Market Analysis by Application
8.1 Key Findings
8.2 Application Segment: Market Attractiveness Index
8.3 Solar Photovoltaic Market Size Estimation and Forecast by Application
8.4 Residential and Commercial Buildings
8.4.1 Market Size by Region, 2023-2033 (US$ Bn)
8.4.2 Market Share by Region, 2023 & 2033 (%)
8.5 Remote Power Systems
8.5.1 Market Size by Region, 2023-2033 (US$ Bn)
8.5.2 Market Share by Region, 2023 & 2033 (%)
8.6 Transportation
8.6.1 Market Size by Region, 2023-2033 (US$ Bn)
8.6.2 Market Share by Region, 2023 & 2033 (%)
8.7 Solar Farms
8.7.1 Market Size by Region, 2023-2033 (US$ Bn)
8.7.2 Market Share by Region, 2023 & 2033 (%)
8.8 Portable Electronic Devices
8.8.1 Market Size by Region, 2023-2033 (US$ Bn)
8.8.2 Market Share by Region, 2023 & 2033 (%)
8.9 Other Application
8.9.1 Market Size by Region, 2023-2033 (US$ Bn)
8.9.2 Market Share by Region, 2023 & 2033 (%)
9 Solar Photovoltaic Market Analysis by Region
9.1 Key Findings
9.2 Regional Market Size Estimation and Forecast
9.3 Global Solar Photovoltaic (PV) Market by Region
9.4 Global Solar Photovoltaic (PV) Market by Cell Type
9.5 Global Solar Photovoltaic (PV) Market by Component
9.6 Global Solar Photovoltaic (PV) Market by Material
9.7 Global Solar Photovoltaic (PV) Market by Installation Type
9.8 Global Solar Photovoltaic (PV) Market by Application
10 North America Solar Photovoltaic Market Analysis
10.1 Key Findings
10.2 North America Solar Photovoltaic Market Attractiveness Index
10.3 North America Solar Photovoltaic Market Size Estimation and Forecast
10.4 North America Solar Photovoltaic Market Size Estimation and Forecast by Country
10.5 North America Solar Photovoltaic Market Size Estimation and Forecast by Cell Type
10.6 North America Solar Photovoltaic Market Size Estimation and Forecast by Component
10.7 North America Solar Photovoltaic Market Size Estimation and Forecast by Material
10.8 North America Solar Photovoltaic Market Size Estimation and Forecast by Installation Type
10.9 North America Solar Photovoltaic Market Size Estimation and Forecast by Application
10.10 U.S. Solar Photovoltaic Market Analysis
10.11 Canada Solar Photovoltaic Market Analysis
11 Europe Solar Photovoltaic Market Analysis
11.1 Key Findings
11.2 Europe Solar Photovoltaic Market Attractiveness Index
11.3 Europe Solar Photovoltaic Market Size Estimation and Forecast
11.4 Europe Solar Photovoltaic Market Size Estimation and Forecast by Country
11.5 Europe Solar Photovoltaic Market Size Estimation and Forecast by Cell Type
11.6 Europe Solar Photovoltaic Market Size Estimation and Forecast by Component
11.7 Europe Solar Photovoltaic Market Size Estimation and Forecast by Material
11.8 Europe Solar Photovoltaic Market Size Estimation and Forecast by Installation Type
11.9 Europe Solar Photovoltaic Market Size Estimation and Forecast by Application
11.10 Germany Solar Photovoltaic Market Analysis
11.11 UK Solar Photovoltaic Market Analysis
11.12 France Solar Photovoltaic Market Analysis
11.13 Italy Solar Photovoltaic Market Analysis
11.14 Spain Solar Photovoltaic Market Analysis
11.15 Rest of Europe Solar Photovoltaic Market Analysis
12 Asia Pacific Solar Photovoltaic Market Analysis
12.1 Key Findings
12.2 Asia Pacific Solar Photovoltaic Market Attractiveness Index
12.3 Asia Pacific Solar Photovoltaic Market Size Estimation and Forecast
12.4 Asia Pacific Solar Photovoltaic Market Size Estimation and Forecast by Country
12.5 Asia Pacific Solar Photovoltaic Market Size Estimation and Forecast by Cell Type
12.6 Asia Pacific Solar Photovoltaic Market Size Estimation and Forecast by Component
12.7 Asia Pacific Solar Photovoltaic Market Size Estimation and Forecast by Material
12.8 Asia Pacific Solar Photovoltaic Market Size Estimation and Forecast by Installation Type
12.9 Asia Pacific Solar Photovoltaic Market Size Estimation and Forecast by Application
12.10 China Solar Photovoltaic Market Analysis
12.11 India Solar Photovoltaic Market Analysis
12.12 Japan Solar Photovoltaic Market Analysis
12.13 South Korea Solar Photovoltaic Market Analysis
12.14 Australia Solar Photovoltaic Market Analysis
12.15 Rest of Asia Pacific Solar Photovoltaic Market Analysis
13 Middle East & Africa Solar Photovoltaic Market Analysis
13.1 Key Findings
13.2 Middle East & Africa Solar Photovoltaic Market Attractiveness Index
13.3 Middle East & Africa Solar Photovoltaic Market Size Estimation and Forecast
13.4 Middle East & Africa Solar Photovoltaic Market Size Estimation and Forecast by Country
13.5 Middle East & Africa Solar Photovoltaic Market Size Estimation and Forecast by Cell Type
13.6 Middle East & Africa Solar Photovoltaic Market Size Estimation and Forecast by Component
13.7 Middle East & Africa Solar Photovoltaic Market Size Estimation and Forecast by Material
13.8 Middle East & Africa Solar Photovoltaic Market Size Estimation and Forecast by Installation Type
13.9 Middle East & Africa Solar Photovoltaic Market Size Estimation and Forecast by Application
13.10 GCC Solar Photovoltaic Market Analysis
13.11 South Africa Solar Photovoltaic Market Analysis
13.12 Rest of Middle East & Africa Solar Photovoltaic Market Analysis
14 Latin America Solar Photovoltaic Market Analysis
14.1 Key Findings
14.2 Latin America Solar Photovoltaic Market Attractiveness Index
14.3 Latin America Solar Photovoltaic Market Size Estimation and Forecast
14.4 Latin America Solar Photovoltaic Market Size Estimation and Forecast by Country
14.5 Latin America Solar Photovoltaic Market Size Estimation and Forecast by Cell Type
14.6 Latin America Solar Photovoltaic Market Size Estimation and Forecast by Component
14.7 Latin America Solar Photovoltaic Market Size Estimation and Forecast by Material
14.8 Latin America Solar Photovoltaic Market Size Estimation and Forecast by Installation Type
14.9 Latin America Solar Photovoltaic Market Size Estimation and Forecast by Application
14.10 Brazil Solar Photovoltaic Market Analysis
14.11 Mexico Solar Photovoltaic Market Analysis
14.12 Rest of Latin America Solar Photovoltaic Market Analysis
15 Company Profiles
15.1 Competitive Landscape, 2022
15.2 Strategic Outlook
15.2.1 Acquisitions as Key Business Strategy
15.2.2 Collaboration as Key Business Strategy
15.2.3 New Product Launch as Key Business Strategy
15.2.4 Investment as Key Business Strategy
15.2.5 Joint Venture as Key Business Strategy
15.3 Canadian Solar Inc.
15.3.1 Company Snapshot
15.3.2 Company Overview
15.3.3 Financial Analysis
15.3.3.1 Net Revenue, 2017-2021
15.3.3.2 R&D, 2017-2021
15.3.3.3 Regional Revenue Shares, 2021 (%)
15.3.3.4 Business Segment Revenue Shares, 2021 (%)
15.3.4 Product Benchmarking
15.3.5 Strategic Outlook
15.4 First Solar, Inc.
15.4.1 Company Snapshot
15.4.2 Company Overview
15.4.3 Financial Analysis
15.4.3.1 Net Revenue, 2018-2022
15.4.3.2 R&D, 2018-2022
15.4.3.3 Regional Revenue Shares, 2022
15.4.4 Product Benchmarking
15.4.5 Strategic Outlook
15.5 Hanwha Q Cells
15.5.1 Company Snapshot
15.5.2 Company Overview
15.5.3 Product Benchmarking
15.5.4 Strategic Outlook
15.6 Trina Solar Co., Ltd.
15.6.1 Company Snapshot
15.6.2 Company Overview
15.6.3 Product Benchmarking
15.6.4 Strategic Outlook
15.7 Yingli Green Energy Holding Company Limited
15.7.1 Company Snapshot
15.7.2 Company Overview
15.7.3 Financial Analysis
15.7.3.1 Net Revenue, 2018-2022
15.7.4 Product Benchmarking
15.7.5 Strategic Outlook
15.8 LG Electronics Inc.
15.8.1 Company Snapshot
15.8.2 Company Overview
15.8.3 Financial Analysis
15.8.3.1 Net Revenue, 2018-2022
15.8.3.2 R&D, 2018-2022
15.8.3.3 Regional Revenue Shares, 2022 (%)
15.8.3.4 Business Segment Revenue Shares, 2022 (%)
15.8.4 Product Benchmarking
15.9 JinkoSolar Holding Co., Ltd.
15.9.1 Company Snapshot
15.9.2 Company Overview
15.9.3 Financial Analysis
15.9.3.1 Net Revenue, 2017-2021
15.9.3.2 R&D, 2017-2021
15.9.3.3 Regional Revenue Shares, 2021 (%)
15.9.3.4 Business Segment Revenue Shares, 2021 (%)
15.9.4 Product Benchmarking
15.9.5 Strategic Outlook
15.10 JA Solar Holdings Co., Ltd.
15.10.1 Company Snapshot
15.10.2 Company Overview
15.10.3 Financial Analysis
15.10.3.1 Net Revenue, 2018-2022
15.10.4 Product Benchmarking
15.10.5 Strategic Outlook
15.11 LONGi Green Energy Technology
15.11.1 Company Snapshot
15.11.2 Company Overview
15.11.3 Product Benchmarking
15.11.4 Strategic Outlook
15.12 Suntech Power Holdings Co., Ltd.
15.12.1 Company Snapshot
15.12.2 Company Overview
15.12.3 Product Benchmarking
15.13 Sharp Corporation
15.13.1 Company Snapshot
15.13.2 Company Overview
15.13.3 Financial Analysis
15.13.3.1 Net Revenue, 2018-2022
15.13.3.2 R&D, 2018-2022
15.13.3.3 Regional Revenue Shares, 2022 (%)
15.13.3.4 Business Segment Revenue Shares, 2022 (%)
15.13.4 Product Benchmarking
15.13.5 Strategic Outlook
15.14 ABB Ltd.
15.14.1 Company Snapshot
15.14.2 Company Overview
15.14.3 Financial Analysis
15.14.3.1 Net Revenue, 2018-2022
15.14.3.2 R&D, 2018-2022
15.14.3.3 Business Segment Revenue Shares, 2022 (%)
15.14.4 Product Benchmarking
15.15 Eaton Corporation plc
15.15.1 Company Snapshot
15.15.2 Company Overview
15.15.3 Financial Analysis
15.15.3.1 Net Revenue, 2018-2022
15.15.3.2 R&D, 2018-2022
15.15.3.3 Regional Revenue Shares, 2022 (%)
15.15.3.4 Business Segment Revenue Shares, 2022 (%)
15.15.4 Product Benchmarking
15.15.5 Strategic Outlook
15.16 Waaree Energies Limited
15.16.1 Company Snapshot
15.16.2 Company Overview
15.16.3 Product Benchmarking
15.16.4 Strategic Outlook
15.17 EMMVEE Photovoltaic Power Private Limited
15.17.1 Company Snapshot
15.17.2 Company Overview
15.17.3 Product Benchmarking
16 Conclusion and Recommendations
16.1 Concluding Remarks from Visiongain
16.2 Recommendations for Market Players
List of Tables
Table 1 Solar Photovoltaic Market Snapshot, 2023 & 2033 (US$ billion, CAGR %)
Table 2 Global Solar Photovoltaic (PV) Market Forecast, 2023-2033 (US$ Bn, AGR (%), CAGR (%)) (V-Shaped Recovery Scenario)
Table 3 Global Solar Photovoltaic (PV) Market by Region, 2023-2033 (US$ Bn, AGR (%), CAGR (%)) (V-Shaped Recovery Scenario)
Table 4 Global Solar Photovoltaic (PV) Market Forecast, 2023-2033 (US$ Bn, AGR (%), CAGR (%)) (W-Shaped Recovery Scenario)
Table 5 Global Solar Photovoltaic (PV) Market by Region, 2023-2033 (US$ Bn, AGR (%), CAGR (%)) (W-Shaped Recovery Scenario)
Table 6 Global Solar Photovoltaic (PV) Market Forecast, 2023-2033 (US$ Bn, AGR (%), CAGR (%)) (U-Shaped Recovery Scenario)
Table 7 Global Solar Photovoltaic (PV) Market by Region, 2023-2033 (US$ Bn, AGR (%), CAGR (%)) (U-Shaped Recovery Scenario)
Table 8 Global Solar Photovoltaic (PV) Market Forecast, 2023-2033 (US$ Bn, AGR (%), CAGR (%)) (L-Shaped Recovery Scenario)
Table 9 Global Solar Photovoltaic (PV) Market by Region, 2023-2033 (US$ Bn, AGR (%), CAGR (%)) (L-Shaped Recovery Scenario)
Table 10 Global Solar Photovoltaic (PV) Market by Cell Type, 2023-2033 (US$ Bn, AGR (%), CAGR (%))
Table 11 Full-Cell PV Modules Market by Region, 2023-2033 (US$ Bn, AGR (%), CAGR (%))
Table 12 Half-Cell PV Modules Market by Region, 2023-2033 (US$ Bn, AGR (%), CAGR (%))
Table 13 Global Solar Photovoltaic (PV) Market by Component, 2023-2033 (US$ Bn, AGR (%), CAGR (%))
Table 14 Modules Market by Region, 2023-2033 (US$ Bn, AGR (%), CAGR (%))
Table 15 Inverters Market by Region, 2023-2033 (US$ Bn, AGR (%), CAGR (%))
Table 16 Balance of System (BOS) Market by Region, 2023-2033 (US$ Bn, AGR (%), CAGR (%))
Table 17 Global Solar Photovoltaic (PV) Market by Material, 2023-2033 (US$ Bn, AGR (%), CAGR (%))
Table 18 Crystalline Silicon (C-Si) Market by Region, 2023-2033 (US$ Bn, AGR (%), CAGR (%))
Table 19 Thin Film Market by Region, 2023-2033 (US$ Bn, AGR (%), CAGR (%))
Table 20 Copper Indium Gallium Selenide (CIGS) Market by Region, 2023-2033 (US$ Bn, AGR (%), CAGR (%))
Table 21 Cadmium Telluride (CDTE) Market by Region, 2023-2033 (US$ Bn, AGR (%), CAGR (%))
Table 22 Global Solar Photovoltaic (PV) Market by Installation Type, 2023-2033 (US$ Bn, AGR (%), CAGR (%))
Table 23 Ground-mounted Market by Region, 2023-2033 (US$ Bn, AGR (%), CAGR (%))
Table 24 Rooftops Market by Region, 2023-2033 (US$ Bn, AGR (%), CAGR (%))
Table 25 Windows Market by Region, 2023-2033 (US$ Bn, AGR (%), CAGR (%))
Table 26 Floating PV Market by Region, 2023-2033 (US$ Bn, AGR (%), CAGR (%))
Table 27 Other Installation Type Market by Region, 2023-2033 (US$ Bn, AGR (%), CAGR (%))
Table 28 Global Solar Photovoltaic (PV) Market by Application, 2023-2033 (US$ Bn, AGR (%), CAGR (%))
Table 29 Residential and Commercial Buildings Market by Region, 2023-2033 (US$ Bn, AGR (%), CAGR (%))
Table 30 Remote Power Systems Market by Region, 2023-2033 (US$ Bn, AGR (%), CAGR (%))
Table 31 Transportation Market by Region, 2023-2033 (US$ Bn, AGR (%), CAGR (%))
Table 32 Solar Farms Market by Region, 2023-2033 (US$ Bn, AGR (%), CAGR (%))
Table 33 Portable Electronic Devices Market by Region, 2023-2033 (US$ Bn, AGR (%), CAGR (%))
Table 34 Other Applications Market by Region, 2023-2033 (US$ Bn, AGR (%), CAGR (%))
Table 35 Global Solar Photovoltaic (PV) Market Forecast, 2023-2033 (US$ Bn, AGR (%), CAGR (%))
Table 36 Global Solar Photovoltaic (PV) Market Cumulative Installed Capacity, 2023-2033 (GW, AGR (%), CAGR (%))
Table 37 Global Solar Photovoltaic (PV) Market by Region, 2023-2033 (US$ Bn, AGR (%), CAGR (%))
Table 38 Global Solar Photovoltaic (PV) Market Cumulative Installed Capacity, by region, 2023-2033 (GW, AGR (%), CAGR (%))
Table 39 Global Solar Photovoltaic (PV) Market by Cell Type, 2023-2033 (US$ Bn, AGR (%), CAGR (%))
Table 40 Global Solar Photovoltaic (PV) Market by Component, 2023-2033 (US$ Bn, AGR (%), CAGR (%))
Table 41 Global Solar Photovoltaic (PV) Market by Material, 2023-2033 (US$ Bn, AGR (%), CAGR (%))
Table 42 Global Solar Photovoltaic (PV) Market by Installation Type, 2023-2033 (US$ Bn, AGR (%), CAGR (%))
Table 43 Global Solar Photovoltaic (PV) Market by Application, 2023-2033 (US$ Bn, AGR (%), CAGR (%))
Table 44 North America Solar Photovoltaic (PV) Market by Value, 2023-2033 (US$ Bn, AGR (%), CAGR (%))
Table 45 North America Solar Photovoltaic (PV) Market by Cumulative Installed Capacity, 2023-2033 (GW, AGR (%), CAGR (%))
Table 46 North America Solar Photovoltaic (PV) Market by Country, 2023-2033 (US$ Bn, AGR (%), CAGR (%))
Table 47 North America Solar Photovoltaic (PV) Market by Cumulative Installed Capacity, 2023-2033 (GW, AGR (%), CAGR (%))
Table 48 North America Solar Photovoltaic (PV) Market by Cell Type, 2023-2033 (US$ Bn, AGR (%), CAGR (%))
Table 49 North America Solar Photovoltaic (PV) Market by Component, 2023-2033 (US$ Bn, AGR (%), CAGR (%))
Table 50 North America Solar Photovoltaic (PV) Market by Material, 2023-2033 (US$ Bn, AGR (%), CAGR (%))
Table 51 North America Solar Photovoltaic (PV) Market by Installation Type, 2023-2033 (US$ Bn, AGR (%), CAGR (%))
Table 52 North America Solar Photovoltaic (PV) Market by Application, 2023-2033 (US$ Bn, AGR (%), CAGR (%))
Table 53 US Solar Photovoltaic (PV) Market by Value, 2023-2033 (US$ Bn, AGR (%), CAGR (%))
Table 54 US Solar Photovoltaic (PV) Market by Cumulative Installed Capacity, 2023-2033 (GW, AGR (%), CAGR (%))
Table 55 Canada Solar Photovoltaic (PV) Market by Value, 2023-2033 (US$ Bn, AGR (%), CAGR (%))
Table 56 Canada Solar Photovoltaic (PV) Market by Cumulative Installed Capacity, 2023-2033 (GW, AGR (%), CAGR (%))
Table 57 Europe Solar Photovoltaic (PV) Market by Value, 2023-2033 (US$ Bn, AGR (%), CAGR (%))
Table 58 Europe Solar Photovoltaic (PV) Market by Cumulative Installed Capacity, 2023-2033 (GW, AGR (%), CAGR (%))
Table 59 Europe Solar Photovoltaic (PV) Market by Country, 2023-2033 (US$ Bn, AGR (%), CAGR (%))
Table 60 Europe Solar Photovoltaic (PV) Market by Country, 2023-2033 (US$ Bn, AGR (%), CAGR (%))
Table 61 Europe Solar Photovoltaic (PV) Market by Cell Type, 2023-2033 (US$ Bn, AGR (%), CAGR (%))
Table 62 Europe Solar Photovoltaic (PV) Market by Component, 2023-2033 (US$ Bn, AGR (%), CAGR (%))
Table 63 Europe Solar Photovoltaic (PV) Market by Material, 2023-2033 (US$ Bn, AGR (%), CAGR (%))
Table 64 Europe Solar Photovoltaic (PV) Market by Installation Type, 2023-2033 (US$ Bn, AGR (%), CAGR (%))
Table 65 Europe Solar Photovoltaic (PV) Market by Application, 2023-2033 (US$ Bn, AGR (%), CAGR (%))
Table 66 Germany Solar Photovoltaic (PV) Market by Value, 2023-2033 (US$ Bn, AGR (%), CAGR (%))
Table 67 Germany Solar Photovoltaic (PV) Market by Cumulative Installed Capacity, 2023-2033 (GW, AGR (%), CAGR (%))
Table 68 UK Solar Photovoltaic (PV) Market by Value, 2023-2033 (US$ Bn, AGR (%), CAGR (%))
Table 69 UK Solar Photovoltaic (PV) Market by Cumulative Installed Capacity, 2023-2033 (GW, AGR (%), CAGR (%))
Table 70 France Solar Photovoltaic (PV) Market by Value, 2023-2033 (US$ Bn, AGR (%), CAGR (%))
Table 71 France Solar Photovoltaic (PV) Market by Cumulative Installed Capacity, 2023-2033 (GW, AGR (%), CAGR (%))
Table 72 Italy Solar Photovoltaic (PV) Market by Value, 2023-2033 (US$ Bn, AGR (%), CAGR (%))
Table 73 Italy Solar Photovoltaic (PV) Market by Cumulative Installed Capacity, 2023-2033 (GW, AGR (%), CAGR (%))
Table 74 Spain Solar Photovoltaic (PV) Market by Value, 2023-2033 (US$ Bn, AGR (%), CAGR (%))
Table 75 Spain Solar Photovoltaic (PV) Market by Cumulative Installed Capacity, 2023-2033 (GW, AGR (%), CAGR (%))
Table 76 Rest of Europe Solar Photovoltaic (PV) Market by Value, 2023-2033 (US$ Bn, AGR (%), CAGR (%))
Table 77 Rest of Europe Solar Photovoltaic (PV) Market by Cumulative Installed Capacity, 2023-2033 (GW, AGR (%), CAGR (%))
Table 78 Asia-Pacific Solar Photovoltaic (PV) Market by Value, 2023-2033 (US$ Bn, AGR (%), CAGR (%))
Table 79 Asia-Pacific Solar Photovoltaic (PV) Market by Cumulative Installed Capacity, 2023-2033 (GW, AGR (%), CAGR (%))
Table 80 Asia-Pacific Solar Photovoltaic (PV) Market by Country, 2023-2033 (US$ Bn, AGR (%), CAGR (%))
Table 81 Asia-Pacific Solar Photovoltaic (PV) Market Cumulative Installed Capacity, by Country, 2023-2033 (GW, AGR (%), CAGR (%))
Table 82 Asia-Pacific Solar Photovoltaic (PV) Market by Cell Type, 2023-2033 (US$ Bn, AGR (%), CAGR (%))
Table 83 Asia-Pacific Solar Photovoltaic (PV) Market by Component, 2023-2033 (US$ Bn, AGR (%), CAGR (%))
Table 84 Asia-Pacific Solar Photovoltaic (PV) Market by Material, 2023-2033 (US$ Bn, AGR (%), CAGR (%))
Table 85 Asia-Pacific Solar Photovoltaic (PV) Market by Installation Type, 2023-2033 (US$ Bn, AGR (%), CAGR (%))
Table 86 Asia-Pacific Solar Photovoltaic (PV) Market by Application, 2023-2033 (US$ Bn, AGR (%), CAGR (%))
Table 87 China Solar Photovoltaic (PV) Market by Value, 2023-2033 (US$ Bn, AGR (%), CAGR (%))
Table 88 China Solar Photovoltaic (PV) Market by Cumulative Installed Capacity, 2023-2033 (GW, AGR (%), CAGR (%))
Table 89 India Solar Photovoltaic (PV) Market by Value, 2023-2033 (US$ Bn, AGR (%), CAGR (%))
Table 90 India Solar Photovoltaic (PV) Market by Cumulative Installed Capacity, 2023-2033 (GW, AGR (%), CAGR (%))
Table 91 Japan Solar Photovoltaic (PV) Market by Value, 2023-2033 (US$ Bn, AGR (%), CAGR (%))
Table 92 Japan Solar Photovoltaic (PV) Market by Cumulative Installed Capacity, 2023-2033 (GW, AGR (%), CAGR (%))
Table 93 South Korea Solar Photovoltaic (PV) Market by Value, 2023-2033 (US$ Bn, AGR (%), CAGR (%))
Table 94 South Korea Solar Photovoltaic (PV) Market by Cumulative Installed Capacity, 2023-2033 (GW, AGR (%), CAGR (%))
Table 95 Australia Solar Photovoltaic (PV) Market by Value, 2023-2033 (US$ Bn, AGR (%), CAGR (%))
Table 96 Australia Solar Photovoltaic (PV) Market by Cumulative Installed Capacity, 2023-2033 (GW, AGR (%), CAGR (%))
Table 97 Rest of Asia-Pacific Solar Photovoltaic (PV) Market by Value, 2023-2033 (US$ Bn, AGR (%), CAGR (%))
Table 98 Rest of Asia-Pacific Solar Photovoltaic (PV) Market by Cumulative Installed Capacity, 2023-2033 (GW, AGR (%), CAGR (%))
Table 99 Middle East & Africa Solar Photovoltaic (PV) Market by Value, 2023-2033 (US$ Bn, AGR (%), CAGR (%))
Table 100 Middle East & Africa Solar Photovoltaic (PV) Market by Cumulative Installed Capacity, 2023-2033 (GW, AGR (%), CAGR (%))
Table 101 Middle East & Africa Solar Photovoltaic (PV) Market by Country, 2023-2033 (US$ Bn, AGR (%), CAGR (%))
Table 102 Middle East & Africa Solar Photovoltaic (PV) Market by Volume by Country, 2023-2033 (GW, AGR (%), CAGR (%))
Table 103 Middle East & Africa Solar Photovoltaic (PV) Market by Cell Type, 2023-2033 (US$ Bn, AGR (%), CAGR (%))
Table 104 Middle East & Africa Solar Photovoltaic (PV) Market by Component, 2023-2033 (US$ Bn, AGR (%), CAGR (%))
Table 105 Middle East & Africa Solar Photovoltaic (PV) Market by Material, 2023-2033 (US$ Bn, AGR (%), CAGR (%))
Table 106 Middle East & Africa Solar Photovoltaic (PV) Market by Installation Type, 2023-2033 (US$ Bn, AGR (%), CAGR (%))
Table 107 Middle East & Africa Solar Photovoltaic (PV) Market by Application, 2023-2033 (US$ Bn, AGR (%), CAGR (%))
Table 108 GCC Solar Photovoltaic (PV) Market by Value, 2023-2033 (US$ Bn, AGR (%), CAGR (%))
Table 109 GCC Solar Photovoltaic (PV) Market by Cumulative Installed Capacity, 2023-2033 (GW, AGR (%), CAGR (%))
Table 110 South Africa Solar Photovoltaic (PV) Market by Value, 2023-2033 (US$ Bn, AGR (%), CAGR (%))
Table 111 South Africa Solar Photovoltaic (PV) Market by Cumulative Installed Capacity, 2023-2033 (GW, AGR (%), CAGR (%))
Table 112 Rest of Middle East & Africa Solar Photovoltaic (PV) Market by Value, 2023-2033 (US$ Bn, AGR (%), CAGR (%))
Table 113 Rest of Middle East & Africa Solar Photovoltaic (PV) Market by Cumulative Installed Capacity, 2023-2033 (GW, AGR (%), CAGR (%))
Table 114 Latin America Solar Photovoltaic (PV) Market by Value, 2023-2033 (US$ Bn, AGR (%), CAGR (%))
Table 115 Latin America Solar Photovoltaic (PV) Market by Cumulative Installed Capacity, 2023-2033 (GW, AGR (%), CAGR (%))
Table 116 Latin America Solar Photovoltaic (PV) Market by Country, 2023-2033 (US$ Bn, AGR (%), CAGR (%))
Table 117 Latin America Solar Photovoltaic (PV) Market Cumulative Installed Capacity, by Country, 2023-2033 (GW, AGR (%), CAGR (%))
Table 118 Latin America Solar Photovoltaic (PV) Market by Cell Type, 2023-2033 (US$ Bn, AGR (%), CAGR (%))
Table 119 Latin America Solar Photovoltaic (PV) Market by Component, 2023-2033 (US$ Bn, AGR (%), CAGR (%))
Table 120 Latin America Solar Photovoltaic (PV) Market by Material, 2023-2033 (US$ Bn, AGR (%), CAGR (%))
Table 121 Latin America Solar Photovoltaic (PV) Market by Installation Type, 2023-2033 (US$ Bn, AGR (%), CAGR (%))
Table 122 Latin America Solar Photovoltaic (PV) Market by Application, 2023-2033 (US$ Bn, AGR (%), CAGR (%))
Table 123 Brazil Solar Photovoltaic (PV) Market by Value, 2023-2033 (US$ Bn, AGR (%), CAGR (%))
Table 124 Brazil Solar Photovoltaic (PV) Market by Cumulative Installed Capacity, 2023-2033 (GW, AGR (%), CAGR (%))
Table 125 Mexico Solar Photovoltaic (PV) Market by Value, 2023-2033 (US$ Bn, AGR (%), CAGR (%))
Table 126 Mexico Solar Photovoltaic (PV) Market by Cumulative Installed Capacity, 2023-2033 (GW, AGR (%), CAGR (%))
Table 127 Rest of Latin America Solar Photovoltaic (PV) Market by Value, 2023-2033 (US$ Bn, AGR (%), CAGR (%))
Table 128 Rest of Latin America Solar Photovoltaic (PV) Market by Cumulative Installed Capacity, 2023-2033 (GW, AGR (%), CAGR (%))
Table 129 Acquisitions as Key Business Strategy
Table 130 Collaborations as Key Business Strategy
Table 131 New Product Launch as Key Business Strategy
Table 132 Investment as Key Business Strategy
Table 133 Joint Venture as Key Business Strategy
Table 134 Canadian Solar Inc: Key Details, (CEO, HQ, Revenue, Founded, No. of Employees, Company Type, Website, Business Segment)
Table 135 Canadian Solar Inc: Product Benchmarking
Table 136 Canadian Solar Inc: Strategic Outlook
Table 137 First Solar, Inc.: Key Details, (CEO, HQ, Revenue, Founded, No. of Employees, Company Type, Website, Business Segment)
Table 138 First Solar, Inc: Product Benchmarking
Table 139 First Solar, Inc: Strategic Outlook
Table 140 Hanwha Q Cells: Key Details, (CEO, HQ, Revenue, Founded, No. of Employees, Company Type, Website, Business Segment)
Table 141 Hanwha Q Cells: Product Benchmarking
Table 142 Hanwha Q Cells: Strategic Outlook
Table 143 Trina Solar Co., Ltd.: Key Details, (CEO, HQ, Revenue, Founded, No. of Employees, Company Type, Website, Business Segment)
Table 144 Trina Solar Co., Ltd.: Product Benchmarking
Table 145 Trina Solar Co., Ltd.: Strategic Outlook
Table 146 Yingli Green Energy Holding Company Limited: Key Details, (CEO, HQ, Revenue, Founded, No. of Employees, Company Type, Website, Business Segment)
Table 147 Yingli Green Energy Holding Company Limited: Product Benchmarking
Table 148 Yingli Green Energy Holding Company Limited: Strategic Outlook
Table 149 LG Electronics Inc: Key Details, (CEO, HQ, Revenue, Founded, No. of Employees, Company Type, Website, Business Segment)
Table 150 LG Electronics Inc: Product Benchmarking
Table 151 JinkoSolar Holding Co., Ltd.: Key Details, (CEO, HQ, Revenue, Founded, No. of Employees, Company Type, Website, Business Segment)
Table 152 JinkoSolar Holding Co., Ltd.: Product Benchmarking
Table 153 JinkoSolar Holding Co., Ltd.: Strategic Outlook
Table 154 JA Solar Holdings Co., Ltd.: Key Details, (CEO, HQ, Revenue, Founded, No. of Employees, Company Type, Website, Business Segment)
Table 155 JA Solar Holdings Co., Ltd.: Product Benchmarking
Table 156 JA Solar Holdings Co., Ltd.: Strategic Outlook
Table 157 LONGi Green Energy Technology: Key Details, (CEO, HQ, Revenue, Founded, No. of Employees, Company Type, Website, Business Segment)
Table 158 LONGi Green Energy Technology: Product Benchmarking
Table 159 LONGi Green Energy Technology: Strategic Outlook
Table 160 Suntech Power Holdings Co., Ltd.: Key Details, (CEO, HQ, Revenue, Founded, No. of Employees, Company Type, Website, Business Segment)
Table 161 Suntech Power Holdings Co., Ltd.: Product Benchmarking
Table 162 Sharp Corporation: Key Details, (CEO, HQ, Revenue, Founded, No. of Employees, Company Type, Website, Business Segment)
Table 163 Sharp Corporation: Product Benchmarking
Table 164 Sharp Corporation: Strategic Outlook
Table 165 ABB Ltd: Key Details, (CEO, HQ, Revenue, Founded, No. of Employees, Company Type, Website, Business Segment)
Table 166 ABB Ltd: Product Benchmarking
Table 167 Eaton Corporation plc: Key Details, (CEO, HQ, Revenue, Founded, No. of Employees, Company Type, Website, Business Segment)
Table 168 Eaton Corporation plc: Product Benchmarking
Table 169 Eaton Corporation plc: Strategic Outlook
Table 170 Waaree Energies Ltd.: Key Details, (CEO, HQ, Revenue, Founded, No. of Employees, Company Type, Website, Business Segment)
Table 171 Waaree Energies Ltd.: Product Benchmarking
Table 172 Waaree Energies Ltd.: Strategic Outlook
Table 173 EMMVEE Photovoltaic Power Private Limited: Key Details, (CEO, HQ, Revenue, Founded, No. of Employees, Company Type, Website, Business Segment)
Table 174 EMMVEE Photovoltaic Power Private Limited: Product Benchmarking
List of Figures
Figure 1 Solar Photovoltaic Market Segmentation
Figure 2 Solar Photovoltaic Market by Cell Type: Market Attractiveness Index
Figure 3 Solar Photovoltaic Market by Cell Component: Market Attractiveness Index
Figure 4 Solar Photovoltaic Market by Material: Market Attractiveness Index
Figure 5 Solar Photovoltaic Market by Installation Type: Market Attractiveness Index
Figure 6 Solar Photovoltaic Market by Application: Market Attractiveness Index
Figure 7 Solar Photovoltaic Market Attractiveness Index by Region
Figure 8 Solar Photovoltaic Market: Market Dynamics
Figure 9 COVID Impact Analysis: Solar Photovoltaic Market Recovery Scenarios
Figure 10 Global Solar Photovoltaic (PV) Market Forecast, 2023-2033 (US$ Bn, AGR (%)) (V-Shaped Recovery Scenario)
Figure 11 Global Solar Photovoltaic (PV) Market by Region, 2023-2033 (US$ Bn, AGR (%)) (V-Shaped Recovery Scenario)
Figure 12 Global Solar Photovoltaic (PV) Market Forecast, 2023-2033 (US$ Bn, AGR (%)) (W-Shaped Recovery Scenario)
Figure 13 Global Solar Photovoltaic (PV) Market by Region, 2023-2033 (US$ Bn, AGR (%)) (W-Shaped Recovery Scenario)
Figure 14 Global Solar Photovoltaic (PV) Market Forecast, 2023-2033 (US$ Bn, AGR (%)) (U-Shaped Recovery Scenario)
Figure 15 Global Solar Photovoltaic (PV) Market by Region, 2023-2033 (US$ Bn, AGR (%)) (U-Shaped Recovery Scenario)
Figure 16 Global Solar Photovoltaic (PV) Market Forecast, 2023-2033 (US$ Bn, AGR (%)) (L-Shaped Recovery Scenario)
Figure 17 Global Solar Photovoltaic (PV) Market by Region, 2023-2033 (US$ Bn, AGR (%)) (L-Shaped Recovery Scenario)
Figure 18 Solar Photovoltaic Market: Porter’s Five Forces Analysis
Figure 19 Solar Photovoltaic Market: PEST Analysis
Figure 20 Solar Photovoltaic Market by Cell Type: Market Attractiveness Index
Figure 21 Global Solar Photovoltaic (PV) Market by Cell Type, 2023-2033 (US$ Bn, AGR (%))
Figure 22 Full-Cell PV Modules Market by Region, 2023-2033 (US$ Bn, AGR (%))
Figure 23 Full-Cell PV Modules Market Share Forecast by Region, 2023 & 2033 (%)
Figure 24 Half-Cell PV Modules Market by Region, 2023-2033 (US$ Bn, AGR (%))
Figure 25 Half-Cell PV Modules Market Share Forecast by Region, 2023 & 2033 (%)
Figure 26 Solar Photovoltaic Market by Cell Component: Market Attractiveness Index
Figure 27 Global Solar Photovoltaic (PV) Market by Component, 2023-2033 (US$ Bn, AGR (%))
Figure 28 Modules Market by Region, 2023-2033 (US$ Bn, AGR (%))
Figure 29 Modules Market Share Forecast by Region, 2023 & 2033 (%)
Figure 30 Inverters Market by Region, 2023-2033 (US$ Bn, AGR (%))
Figure 31 Inverters Market Share Forecast by Region, 2023 & 2033 (%)
Figure 32 Balance of System (BOS) Market by Region, 2023-2033 (US$ Bn, AGR (%))
Figure 33 Balance of System (BOS) Market Share Forecast by Region, 2023 & 2033 (%)
Figure 34 Solar Photovoltaic Market by Material: Market Attractiveness Index
Figure 35 Global Solar Photovoltaic (PV) Market by Material, 2023-2033 (US$ Bn, AGR (%))
Figure 36 Crystalline Silicon (C-Si) Market by Region, 2023-2033 (US$ Bn, AGR (%))
Figure 37 Crystalline Silicon (C-Si) Market Share Forecast by Region, 2023 & 2033 (%)
Figure 38 Thin Film Market by Region, 2023-2033 (US$ Bn, AGR (%))
Figure 39 Thin Film Market Share Forecast by Region, 2023 & 2033 (%)
Figure 40 Copper Indium Gallium Selenide (CIGS) Market by Region, 2023-2033 (US$ Bn, AGR (%))
Figure 41 Copper Indium Gallium Selenide (CIGS) Market Share Forecast by Region, 2023 & 2033 (%)
Figure 42 Cadmium Telluride (CDTE) Market by Region, 2023-2033 (US$ Bn, AGR (%))
Figure 43 Cadmium Telluride (CDTE) Market Share Forecast by Region, 2023 & 2033 (%)
Figure 44 Solar Photovoltaic Market by Installation Type: Market Attractiveness Index
Figure 45 Global Solar Photovoltaic (PV) Market by Installation Type, 2023-2033 (US$ Bn, AGR (%))
Figure 46 Ground-mounted Market by Region, 2023-2033 (US$ Bn, AGR (%))
Figure 47 Ground-mounted Market Share Forecast by Region, 2023 & 2033 (%)
Figure 48 Rooftops Market by Region, 2023-2033 (US$ Bn, AGR (%))
Figure 49 Rooftops Market Share Forecast by Region, 2023 & 2033 (%)
Figure 50 Windows Market by Region, 2023-2033 (US$ Bn, AGR (%))
Figure 51 Windows Market Share Forecast by Region, 2023 & 2033 (%)
Figure 52 Floating PV Market by Region, 2023-2033 (US$ Bn, AGR (%))
Figure 53 Floating PV Market Share Forecast by Region, 2023 & 2033 (%)
Figure 54 Other Installation Type Market by Region, 2023-2033 (US$ Bn, AGR (%))
Figure 55 Other Installation Type Market Share Forecast by Installation Type, 2023 & 2033 (%)
Figure 56 Solar Photovoltaic Market by Application: Market Attractiveness Index
Figure 57 Global Solar Photovoltaic (PV) Market by Application, 2023-2033 (US$ Bn, AGR (%))
Figure 58 Residential and Commercial Buildings Market by Region, 2023-2033 (US$ Bn, AGR (%))
Figure 59 Residential and Commercial Buildings Market by Region, 2023 & 2033 (%)
Figure 60 Remote Power Systems Market by Region, 2023-2033 (US$ Bn, AGR (%))
Figure 61 Remote Power Systems Market Share Forecast by Region, 2023 & 2033 (%)
Figure 62 Transportation Market by Region, 2023-2033 (US$ Bn, AGR (%))
Figure 63 Transportation Market Share Forecast by Application, 2023 & 2033 (%)
Figure 64 Solar Farms Market by Region, 2023-2033 (US$ Bn, AGR (%))
Figure 65 Solar Farms Market Share Forecast by Region, 2023 & 2033 (%)
Figure 66 Portable Electronic Devices Market by Region, 2023-2033 (US$ Bn, AGR (%))
Figure 67 Portable Electronic Devices Market Share Forecast by Region, 2023 & 2033 (%)
Figure 68 Other Applications Market by Region, 2023-2033 (US$ Bn, AGR (%))
Figure 69 Other Application Market Share Forecast by Region, 2023 & 2033 (%)
Figure 70 Global Solar Photovoltaic (PV) Market Forecast, 2023-2033 (US$ Bn, AGR (%))
Figure 71 Global Solar Photovoltaic (PV) Market Cumulative Installed Capacity, 2023-2033 (GW, AGR (%))
Figure 72 Global Solar Photovoltaic (PV) Market by Region, 2023-2033 (US$ Bn, AGR (%))
Figure 73 Global Solar Photovoltaic (PV) Market Cumulative Installed Capacity, by region, 2023-2033 (GW, AGR (%))
Figure 74 Global Solar Photovoltaic (PV) Market by Cell Type, 2023-2033 (US$ Bn, AGR (%))
Figure 75 Global Solar Photovoltaic (PV) Market by Component, 2023-2033 (US$ Bn, AGR (%))
Figure 76 Global Solar Photovoltaic (PV) Market by Material, 2023-2033 (US$ Bn, AGR (%))
Figure 77 Global Solar Photovoltaic (PV) Market by Installation Type, 2023-2033 (US$ Bn, AGR (%))
Figure 78 Global Solar Photovoltaic (PV) Market by Application, 2023-2033 (US$ Bn, AGR (%))
Figure 79 North America Solar Photovoltaic Market Attractiveness Index
Figure 80 North America Solar Photovoltaic (PV) Market by Value, 2023-2033 (US$ Bn, AGR (%))
Figure 81 North America Solar Photovoltaic (PV) Market by Cumulative Installed Capacity, 2023-2033 (GW, AGR (%))
Figure 82 North America Solar Photovoltaic (PV) Market by Country, 2023-2033 (US$ Bn, AGR (%))
Figure 83 North America Solar Photovoltaic (PV) Market by Cumulative Installed Capacity, 2023-2033 (GW, AGR (%))
Figure 84 North America Solar Photovoltaic (PV) Market Share Forecast by Country, 2023-2033 (%)
Figure 85 North America Solar Photovoltaic (PV) Market by Cell Type, 2023-2033 (US$ Bn, AGR (%))
Figure 86 North America Solar Photovoltaic (PV) Market Share Forecast by Cell Type, 2023-2033 (%)
Figure 87 North America Solar Photovoltaic (PV) Market by Component, 2023-2033 (US$ Bn, AGR (%))
Figure 88 North America Solar Photovoltaic (PV) Market Share Forecast by Component, 2023-2033 (%)
Figure 89 North America Solar Photovoltaic (PV) Market by Material, 2023-2033 (US$ Bn, AGR (%))
Figure 90 North America Solar Photovoltaic (PV) Market Share Forecast by Material, 2023-2033 (%)
Figure 91 North America Solar Photovoltaic (PV) Market by Installation Type, 2023-2033 (US$ Bn, AGR (%))
Figure 92 North America Solar Photovoltaic (PV) Market Share Forecast by Installation Type, 2023-2033 (%)
Figure 93 North America Solar Photovoltaic (PV) Market by Application, 2023-2033 (US$ Bn, AGR (%))
Figure 94 North America Solar Photovoltaic (PV) Market Share Forecast by Application, 2023-2033 (%)
Figure 95 US Solar Photovoltaic (PV) Market by Value, 2023-2033 (US$ Bn, AGR (%))
Figure 96 US Solar Photovoltaic (PV) Market by Cumulative Installed Capacity, 2023-2033 (GW, AGR (%))
Figure 97 Canada Solar Photovoltaic (PV) Market by Value, 2023-2033 (US$ Bn, AGR (%))
Figure 98 Canada Solar Photovoltaic (PV) Market by Cumulative Installed Capacity, 2023-2033 (GW, AGR (%))
Figure 99 Europe Solar Photovoltaic Market Attractiveness Index
Figure 100 Europe Solar Photovoltaic (PV) Market by Value, 2023-2033 (US$ Bn, AGR (%))
Figure 101 Europe Solar Photovoltaic (PV) Market by Cumulative Installed Capacity, 2023-2033 (GW, AGR (%))
Figure 102 Europe Solar Photovoltaic (PV) Market by Country, 2023-2033 (US$ Bn, AGR (%))
Figure 103 Europe Solar Photovoltaic (PV) Market by Country, 2023-2033 (US$ Bn, AGR (%))
Figure 104 Europe Solar Photovoltaic (PV) Market Share Forecast by Country, 2023-2033 (%)
Figure 105 Europe Solar Photovoltaic (PV) Market by Cell Type, 2023-2033 (US$ Bn, AGR (%))
Figure 106 Europe Solar Photovoltaic (PV) Market Share Forecast by Cell Type, 2023-2033 (%)
Figure 107 Europe Solar Photovoltaic (PV) Market by Component, 2023-2033 (US$ Bn, AGR (%))
Figure 108 Europe Solar Photovoltaic (PV) Market Share Forecast by Component, 2023-2033 (%)
Figure 109 Europe Solar Photovoltaic (PV) Market by Material, 2023-2033 (US$ Bn, AGR (%))
Figure 110 Europe Solar Photovoltaic (PV) Market Share Forecast by Material, 2023-2033 (%)
Figure 111 Europe Solar Photovoltaic (PV) Market Forecast by Region, 2022-2032 (US$ billion)
Figure 112 Europe Solar Photovoltaic (PV) Market Share Forecast by Installation Type, 2023-2033 (%)
Figure 113 Europe Market Forecast by Application, 2023-2033 (US$ billion)
Figure 114 Europe Solar Photovoltaic (PV) Market Share Forecast by Application, 2023-2033 (%)
Figure 115 Germany Solar Photovoltaic (PV) Market by Value, 2023-2033 (US$ Bn, AGR (%))
Figure 116 Germany Solar Photovoltaic (PV) Market by Cumulative Installed Capacity, 2023-2033 (GW, AGR (%))
Figure 117 UK Solar Photovoltaic (PV) Market by Value, 2023-2033 (US$ Bn, AGR (%))
Figure 118 UK Solar Photovoltaic (PV) Market by Cumulative Installed Capacity, 2023-2033 (GW, AGR (%))
Figure 119 France Solar Photovoltaic (PV) Market by Value, 2023-2033 (US$ Bn, AGR (%))
Figure 120 France Solar Photovoltaic (PV) Market by Cumulative Installed Capacity, 2023-2033 (GW, AGR (%))
Figure 121 Italy Solar Photovoltaic (PV) Market by Value, 2023-2033 (US$ Bn, AGR (%))
Figure 122 Italy Solar Photovoltaic (PV) Market by Cumulative Installed Capacity, 2023-2033 (GW, AGR (%))
Figure 123 Spain Solar Photovoltaic (PV) Market by Value, 2023-2033 (US$ Bn, AGR (%))
Figure 124 Spain Solar Photovoltaic (PV) Market by Cumulative Installed Capacity, 2023-2033 (GW, AGR (%))
Figure 125 Rest of Europe Solar Photovoltaic (PV) Market by Value, 2023-2033 (US$ Bn, AGR (%))
Figure 126 Rest of Europe Solar Photovoltaic (PV) Market by Cumulative Installed Capacity, 2023-2033 (GW, AGR (%))
Figure 127 Asia Pacific Solar Photovoltaic Market Attractiveness Index
Figure 128 Asia-Pacific Solar Photovoltaic (PV) Market Forecast by Region, 2022-2032 (US$ billion)
Figure 129 Asia-Pacific Solar Photovoltaic (PV) Market by Cumulative Installed Capacity, 2023-2033 (GW, AGR (%))
Figure 130 Asia-Pacific Solar Photovoltaic (PV) Market by Country, 2023-2033 (US$ Bn, AGR (%))
Figure 131 Asia-Pacific Solar Photovoltaic (PV) Market Cumulative Installed Capacity, by Country, 2023-2033 (GW, AGR (%))
Figure 132 Asia-Pacific Solar Photovoltaic (PV) Market Share Forecast by Country, 2023-2033 (%)
Figure 133 Asia-Pacific Market Forecast by Cell Type, 2022-2032 (US$ billion)
Figure 134 Asia-Pacific Solar Photovoltaic (PV) Market Share Forecast by Cell Type, 2023-2033 (%)
Figure 135 Asia-Pacific Solar Photovoltaic (PV) Market by Component, 2023-2033 (US$ Bn, AGR (%))
Figure 136 Asia-Pacific Solar Photovoltaic (PV) Market Share Forecast by Component, 2023-2033 (%)
Figure 137 Asia-Pacific Solar Photovoltaic (PV) Market by Material, 2023-2033 (US$ Bn, AGR (%))
Figure 138 Asia-Pacific Solar Photovoltaic (PV) Market Share Forecast by Material, 2023-2033 (%)
Figure 139 Asia-Pacific Solar Photovoltaic (PV) Market by Installation Type, 2023-2033 (US$ Bn, AGR (%))
Figure 140 Asia-Pacific Solar Photovoltaic (PV) Market Share Forecast by Installation Type, 2023-2033 (%)
Figure 141 Asia-Pacific Solar Photovoltaic (PV) Market by Application, 2023-2033 (US$ Bn, AGR (%))
Figure 142 Asia-Pacific Solar Photovoltaic (PV) Market Share Forecast by Application, 2023-2033 (%)
Figure 143 China Solar Photovoltaic (PV) Market by Value, 2023-2033 (US$ Bn, AGR (%))
Figure 144 China Solar Photovoltaic (PV) Market by Cumulative Installed Capacity, 2023-2033 (GW, AGR (%))
Figure 145 India Solar Photovoltaic (PV) Market by Value, 2023-2033 (US$ Bn, AGR (%))
Figure 146 India Solar Photovoltaic (PV) Market by Cumulative Installed Capacity, 2023-2033 (GW, AGR (%))
Figure 147 Japan Solar Photovoltaic (PV) Market by Value, 2023-2033 (US$ Bn, AGR (%))
Figure 148 Japan Solar Photovoltaic (PV) Market by Cumulative Installed Capacity, 2023-2033 (GW, AGR (%))
Figure 149 South Korea Solar Photovoltaic (PV) Market by Value, 2023-2033 (US$ Bn, AGR (%))
Figure 150 South Korea Solar Photovoltaic (PV) Market by Cumulative Installed Capacity, 2023-2033 (GW, AGR (%))
Figure 151 Australia Solar Photovoltaic (PV) Market by Value, 2023-2033 (US$ Bn, AGR (%))
Figure 152 Australia Solar Photovoltaic (PV) Market by Cumulative Installed Capacity, 2023-2033 (GW, AGR (%))
Figure 153 Rest of Asia-Pacific Solar Photovoltaic (PV) Market by Value, 2023-2033 (US$ Bn, AGR (%))
Figure 154 Rest of Asia-Pacific Solar Photovoltaic (PV) Market by Cumulative Installed Capacity, 2023-2033 (GW, AGR (%))
Figure 155 Middle East & Africa Solar Photovoltaic Market Attractiveness Index
Figure 156 Middle East & Africa Solar Photovoltaic (PV) Market by Value, 2023-2033 (US$ Bn, AGR (%))
Figure 157 Middle East & Africa Solar Photovoltaic (PV) Market by Cumulative Installed Capacity, 2023-2033 (GW, AGR (%))
Figure 158 Middle East & Africa Solar Photovoltaic (PV) Market by Country, 2023-2033 (US$ Bn, AGR (%))
Figure 159 Middle East & Africa Solar Photovoltaic (PV) Market by Volume by Country, 2023-2033 (GW, AGR (%))
Figure 160 Middle East & Africa Solar Photovoltaic (PV) Market Share Forecast by Country, 2023-2033 (%)
Figure 161 Middle East & Africa Solar Photovoltaic (PV) Market by Cell Type, 2023-2033 (US$ Bn, AGR (%))
Figure 162 Middle East & Africa Solar Photovoltaic (PV) Market Share Forecast by Cell Type, 2023-2033 (%)
Figure 163 Middle East & Africa Market Forecast by Component, 2022-2032 (US$ billion)
Figure 164 Middle East & Africa Solar Photovoltaic (PV) Market Share Forecast by Component, 2023-2033 (%)
Figure 165 Middle East & Africa Solar Photovoltaic (PV) Market by Material, 2023-2033 (US$ Bn, AGR (%))
Figure 166 Middle East & Africa Solar Photovoltaic (PV) Market Share Forecast by Material, 2023-2033 (%)
Figure 167 Middle East & Africa Solar Photovoltaic (PV) Market by Installation Type, 2023-2033 (US$ Bn, AGR (%))
Figure 168 Middle East & Africa Solar Photovoltaic (PV) Market Share Forecast by Installation Type, 2023-2033 (%)
Figure 169 Middle East & Africa Solar Photovoltaic (PV) Market by Application, 2023-2033 (US$ Bn, AGR (%))
Figure 170 Middle East & Africa Solar Photovoltaic (PV) Market Share Forecast by Application, 2023-2033 (%)
Figure 171 GCC Solar Photovoltaic (PV) Market by Value, 2023-2033 (US$ Bn, AGR (%))
Figure 172 GCC Solar Photovoltaic (PV) Market by Cumulative Installed Capacity, 2023-2033 (GW, AGR (%))
Figure 173 South Africa Solar Photovoltaic (PV) Market by Value, 2023-2033 (US$ Bn, AGR (%))
Figure 174 South Africa Solar Photovoltaic (PV) Market by Cumulative Installed Capacity, 2023-2033 (GW, AGR (%))
Figure 175 Rest of Middle East & Africa Solar Photovoltaic (PV) Market by Value, 2023-2033 (US$ Bn, AGR (%))
Figure 176 Rest of Middle East & Africa Solar Photovoltaic (PV) Market by Cumulative Installed Capacity, 2023-2033 (GW, AGR (%))
Figure 177 Latin America Solar Photovoltaic Market Attractiveness Index
Figure 178 Latin America Solar Photovoltaic (PV) Market by Value, 2023-2033 (US$ Bn, AGR (%))
Figure 179 Latin America Solar Photovoltaic (PV) Market by Cumulative Installed Capacity, 2023-2033 (GW, AGR (%))
Figure 180 Latin America Solar Photovoltaic (PV) Market by Country, 2023-2033 (US$ Bn, AGR (%))
Figure 181 Latin America Solar Photovoltaic (PV) Market Cumulative Installed Capacity, by Country, 2023-2033 (GW, AGR (%))
Figure 182 Latin America Solar Photovoltaic (PV) Market Share Forecast by Country, 2023-2033 (%)
Figure 183 Latin America Solar Photovoltaic (PV) Market by Cell Type, 2023-2033 (US$ Bn, AGR (%))
Figure 184 Latin America Solar Photovoltaic (PV) Market Share Forecast by Cello Type, 2023-2033 (%)
Figure 185 Latin America Solar Photovoltaic (PV) Market by Component, 2023-2033 (US$ Bn, AGR (%))
Figure 186 Latin America Solar Photovoltaic (PV) Market Share Forecast by Component, 2023-2033 (%)
Figure 187 Latin America Solar Photovoltaic (PV) Market by Material, 2023-2033 (US$ Bn, AGR (%))
Figure 188 Latin America Solar Photovoltaic (PV) Market Share Forecast by Material, 2023-2033 (%)
Figure 189 Latin America Solar Photovoltaic (PV) Market by Installation Type, 2023-2033 (US$ Bn, AGR (%))
Figure 190 Latin America Solar Photovoltaic (PV) Market Share Forecast by Installation Type, 2023-2033 (%)
Figure 191 Latin America Solar Photovoltaic (PV) Market by Application, 2023-2033 (US$ Bn, AGR (%))
Figure 192 Latin America Solar Photovoltaic (PV) Market Share Forecast by Application, 2023-2033 (%)
Figure 193 Brazil Solar Photovoltaic (PV) Market by Value, 2023-2033 (US$ Bn, AGR (%))
Figure 194 Brazil Solar Photovoltaic (PV) Market by Cumulative Installed Capacity, 2023-2033 (GW, AGR (%))
Figure 195 Mexico Solar Photovoltaic (PV) Market by Value, 2023-2033 (US$ Bn, AGR (%))
Figure 196 Mexico Solar Photovoltaic (PV) Market by Cumulative Installed Capacity, 2023-2033 (GW, AGR (%))
Figure 197 Rest of Latin America Solar Photovoltaic (PV) Market by Value, 2023-2033 (US$ Bn, AGR (%))
Figure 198 Rest of Latin America Solar Photovoltaic (PV) Market by Cumulative Installed Capacity, 2023-2033 (GW, AGR (%))
Figure 199 Solar Photovoltaic Market: Company Share, 2022
Figure 200 Canadian Solar Inc: Net Revenue, 2017-2021 (US$ million, AGR%)
Figure 201 Canadian Solar Inc: R&D, 2017-2021 (US$ million, AGR%)
Figure 202 Canadian Solar Inc: Regional Revenue Shares, 2021 (%)
Figure 203 Canadian Solar Inc: Business Segment Revenue Shares, 2021 (%)
Figure 204 First Solar, Inc: Net Revenue, 2018-2022 (US$ million, AGR%)
Figure 205 First Solar, Inc: R&D, 2018-2022 (US$ million, AGR%)
Figure 206 First Solar, Inc: Regional Revenue Shares, 2022
Figure 207 Yingli Green Energy Holding Company Limited: Net Revenue, 2018-2022 (US$ million, AGR%)
Figure 208 LG Electronics Inc: Net Revenue, 2018-2022 (US$ million, AGR%)
Figure 209 LG Electronics Inc: R&D, 2018-2022 (US$ million, AGR%)
Figure 210 LG Electronics Inc: Regional Revenue Shares, 2022 (%)
Figure 211 LG Electronics Inc: Business Segment Revenue Shares, 2022 (%)
Figure 212 JinkoSolar Holding Co., Ltd.: Net Revenue, 2017-2021 (US$ million, AGR%)
Figure 213 JinkoSolar Holding Co., Ltd.: R&D, 2017-2021 (US$ million, AGR%)
Figure 214 JinkoSolar Holding Co., Ltd.: Regional Revenue Shares, 2021 (%)
Figure 215 JinkoSolar Holding Co., Ltd.: Business Segment Revenue Shares, 2021 (%)
Figure 216 JA Solar Holdings Co., Ltd.: Net Revenue, 2018-2022 (US$ million, AGR%)
Figure 217 Sharp Corporation: Net Revenue, 2018-2022 (US$ million, AGR%)
Figure 218 Sharp Corporation: R&D, 2018-2022 (US$ million, AGR%)
Figure 219 Sharp Corporation: Regional Revenue Shares, 2022 (%)
Figure 220 Sharp Corporation: Business Segment Revenue Shares, 2022 (%)
Figure 221 ABB Ltd: Net Revenue 2018-2022 (US$ million, AGR%)
Figure 222 ABB Ltd: R&D, 2018-2022 (US$ million, AGR%)
Figure 223 ABB Ltd: Business Segment Revenue Shares, 2022 (%)
Figure 224 Eaton Corporation plc: Net Revenue, 2018-2022 (US$ million, AGR%)
Figure 225 Eaton Corporation plc: R&D, 2018-2022 (US$ million, AGR%)
Figure 226 Eaton Corporation plc: Regional Revenue Shares, 2022 (%)
Figure 227 Eaton Corporation plc: Business Segment Revenue Shares, 2022 (%)
ページTOPに戻る
Visiongain社のエネルギーと資源分野での最新刊レポート
本レポートと同じKEY WORD(solar)の最新刊レポート
よくあるご質問
Visiongain社はどのような調査会社ですか?
英国の調査会社ヴィジョンゲイン社(Visiongain)は、通信とエネルギーのほか、自動車や化学・医薬品、金属など、広範な市場を対象に調査を行っています。自動車市場については、市場全般に関する調査のほ... もっと見る
調査レポートの納品までの日数はどの程度ですか?
在庫のあるものは速納となりますが、平均的には 3-4日と見て下さい。
但し、一部の調査レポートでは、発注を受けた段階で内容更新をして納品をする場合もあります。
発注をする前のお問合せをお願いします。
注文の手続きはどのようになっていますか?
1)お客様からの御問い合わせをいただきます。
2)見積書やサンプルの提示をいたします。
3)お客様指定、もしくは弊社の発注書をメール添付にて発送してください。
4)データリソース社からレポート発行元の調査会社へ納品手配します。
5) 調査会社からお客様へ納品されます。最近は、pdfにてのメール納品が大半です。
お支払方法の方法はどのようになっていますか?
納品と同時にデータリソース社よりお客様へ請求書(必要に応じて納品書も)を発送いたします。
お客様よりデータリソース社へ(通常は円払い)の御振り込みをお願いします。
請求書は、納品日の日付で発行しますので、翌月最終営業日までの当社指定口座への振込みをお願いします。振込み手数料は御社負担にてお願いします。
お客様の御支払い条件が60日以上の場合は御相談ください。
尚、初めてのお取引先や個人の場合、前払いをお願いすることもあります。ご了承のほど、お願いします。
データリソース社はどのような会社ですか?
当社は、世界各国の主要調査会社・レポート出版社と提携し、世界各国の市場調査レポートや技術動向レポートなどを日本国内の企業・公官庁及び教育研究機関に提供しております。
世界各国の「市場・技術・法規制などの」実情を調査・収集される時には、データリソース社にご相談ください。
お客様の御要望にあったデータや情報を抽出する為のレポート紹介や調査のアドバイスも致します。
|
|

