フィルフィニッシュ製造市場レポート:2023-2033
Fill-Finish Manufacturing Market Report 2023-2033
レポート詳細
フィルフィニッシュ製造市場レポート 2023-2033 :本レポートは、新たな収益源の開拓を目指すリーディングカンパニーにとって、業界とその基礎となる力学をより深く理解する上で、非常に... もっと見る
※上記価格は部署ライセンス(Departmental licence)価格です。
その他の価格についてはデータリソースまでお問合せください。
日本語のページは自動翻訳を利用し作成しています。
実際のレポートは英文のみでご納品いたします。
サマリー
レポート詳細
フィルフィニッシュ製造市場レポート 2023-2033:本レポートは、新たな収益源の開拓を目指すリーディングカンパニーにとって、業界とその基礎となる力学をより深く理解する上で、非常に貴重なものとなるでしょう。また、異業種への進出や新地域での既存事業の拡大を目指す企業にとっても有益なレポートです。
完成品製造の展望は、将来に楽観的である
技術の進歩に伴い、この業界は今後も成長を続け、雇用機会の増加や経済の活性化をもたらすと予想されます。家具、家電、電子機器などの完成品の需要増がこの成長を後押ししており、また環境に配慮した製品の人気も高まっています。仕上げ加工メーカーは、自動化や持続可能な材料の使用など、製品を改良し効率を高めるために新しい技術や材料を取り入れています。
さらに、アジアを中心とした新興国での需要が増加し、仕上げ製造の世界市場は拡大しています。これは、メーカーにとって、事業拡大&新興国市場へのアクセスの機会を提供します。しかし、業界は競争の激化や消費者の嗜好の変化への適応の必要性などの課題にも直面しています。全体として、企業が新技術を採用し、消費者の要求に応え続ける限り、完成品製造業界は今後数年間、成長と繁栄を続けると予想されます。適切な戦略と投資により、仕上げ材製造業界の未来は明るいと言えるでしょう。
マーケットリサーチレポートを購入する前に、どのような質問をするべきか?
- フィルフィニッシュ製造市場はどのように進化しているのか?
- フィルフィニッシュ製造市場を牽引し、抑制しているものは何か?
- フィルフィニッシュ製造の各サブマーケットセグメントは予測期間中にどのように成長し、2033年にこれらのサブマーケットが占める売上はどの程度になるのか?
- 2023年から2033年にかけて、フィルフィニッシュ製造の各サブマーケットの市場シェアはどのように推移していくのでしょうか?
- 2023年から2033年にかけて、市場全体の主な牽引役となるのは何か?
- フィルフィニッシュ製造の主要市場はマクロ経済ダイナミクスに概ね追随するのか、それとも個々の国内市場が他を凌駕するのか?
- 2033年までに各国市場の市場シェアはどのように変化し、2033年に市場をリードするのはどの地域か?
- 主要プレイヤーは誰で、予測期間中の見通しはどうなっているのか?
- これらの主要企業のフィルフィニッシュ製造プロジェクトは何か?
- 2023年から2033年の間に、業界はどのように進化していくのでしょうか?現在および今後10年間に実施されるフィルフィニッシュ製造プロジェクトにはどのような意味があるのでしょうか?
- フィルフィニッシュ製造市場をさらに拡大するために、製品の商業化の必要性は高まっているのでしょうか?
- フィルフィニッシュ製造市場の方向性と、市場の最前線に立つためにはどうすればよいのか?
- 新製品やサービスラインに対する最適な投資オプションは何か?
- 企業を新たな成長軌道に乗せ、C-suiteに移行させるための重要な展望は何か?
このことが、現在、そして今後10年の間に、フィルフィニッシュ製造市場にどのような影響を与えるかを発見する必要があります。
- 308ページにわたる本レポートでは、124の表と158のチャート/グラフを独占的に提供します。
- 本レポートでは、業界における主要な収益性の高い分野を取り上げており、今すぐその分野をターゲットにすることができます。
- 世界、地域、国の売上高と成長率を詳細に分析しています。
- 競合他社が成功した主要なトレンド、変化、収益予測をハイライトしています。
本レポートは、フィルフィニッシュ製造市場が今後10年間にどのように発展するか、またCOVID-19の景気後退とバウンスの変動に合わせて、今日のあなたに伝えます。この市場は、過去10年間のどの時点よりも、今がより重要です。
2033年までの予測やその他の分析により、商業的な展望を明らかにする。
- 2033年までの収益予測に加え、直近の実績や成長率、市場シェアなど、本調査では
- ビジネスの展望や展開など、独自の分析がご覧いただけます。
- 定性的分析(市場力学、促進要因、機会、阻害要因、課題など)、コスト構造、フィルフィニッシュ製造価格上昇の影響、最近の動向をご覧いただけます。
本レポートでは、COVID-19が業界や貴社にどのような影響を与えるかについて、データ分析および貴重な知見を提供しています。COVID-19の4つの回収パターン、すなわち「V」、「L」、「W」、「U」の回収パターンとその影響について考察しています。
報告書の対象セグメント
製品
- インストゥルメント
- 消耗品
機器
・ システムタイプ
・ マシンタイプ
システムタイプ
- 統合システム
- スタンドアロン型システム
マシンタイプ
- 自動機
- 半自動機
- 手動機
エンドユーザー
- 製造受託機関(CMO)
- 製薬会社
- バイオ製薬会社
- その他のエンドユーザー
消耗品
- プレフィルドシリンジ
- プレフィルドバイヤル
- プレフィルドカートリッヂ
- プレフィルド包装
- その他消耗品
世界市場全体およびセグメントの収益予測に加え、4地域および主要20カ国市場の収益予測も掲載しています。
北米
- U.S.
- カナダ
欧州
- ドイツ
- イギリス
- フランス
- イタリア
- スペイン
- その他の欧州
アジア太平洋
- 中国
- 日本
- インド
- オーストラリア
- 韓国
- その他のアジア太平洋地域
ラテンアメリカ
- ブラジル
- メキシコ
- その他のラテンアメリカ地域
中近東・アフリカ
- GCC
- 南アフリカ
- その他の中東・アフリカ地域
2023年から2033年にかけてのフィルフィニッシュ製造市場の主要企業のプロファイルと、これらの企業のこのセグメントに焦点を当てた、いくつかの企業についても記載しています。
主要企業と市場成長の可能性
・ Aseptic Technologies
・ Bausch + Ströbel
・ Becton, Dickinson and Company (BD)
・ Gerresheimer AG
・ Groninger& Co. GmbH
・ I.M.A. Industria Macchine Automatiche S.P.A
・ Marchesini Group S.P.A.
・ Nipro Corporation
・ Optima Packaging Group GMBH
・ Schott AG
・ Steriline
・ Stevanato Group SpA
・ Syntegon Technology
・ Vanrx Pharmasystems Inc. (Cytiva)
・ West Pharmaceutical Services, Inc.
フィルフィニッシュ製造市場の世界全体の収益、金額ベースで2023年から2033年まで、市場は2023年に100億7730万米ドルを突破すると当作品は計算しています。2033年まで収益が大きく伸びることが予測されます。当社の調査では、最も大きな可能性を秘めた組織を特定します。彼らの能力、進歩、商業的な展望を発見し、あなたが一歩先を行くことを支援します。
フィルフィニッシュ製造市場、2023年から2033年までのレポートはどのように役立つのでしょうか?
まとめると、300ページを超えるレポートでは、以下のような知識を得ることができます。
- フィルフィニッシュ製造市場の2033年までの収益予測、製品、機器、システムタイプ、マシンタイプ、消耗品、エンドユーザー、企業規模の各予測を世界と地域レベルで掲載 - 業界の展望を発見し、投資と収益に最も有利な場所を見つけることができます。
- 4つの地域と20の主要国市場の2033年までの収益予測 - 北米、欧州、アジア太平洋、ラテンアメリカ、中東・アフリカのフィルフィニッシュ製造市場、2023年から2033年の市場予測をご覧いただけます。また、米国、カナダ、メキシコ、ブラジル、ドイツ、フランス、英国、イタリア、中国、インド、日本、オーストラリアなど、著名な経済圏の市場も予測しています。
- 既存企業および市場参入を目指す企業の展望 - フィルフィニッシュ製造市場に関わる主要企業15社の企業プロファイルを含む、2023年から2033年の市場。
独自の予測による定量・定性分析をご覧いただけます。私たちのレポートだけが持つ情報を入手し、貴重なビジネスインテリジェンスとして情報を得ることができます。
他にはない情報
私たちの新しいレポートがあれば、知識に遅れをとったり、チャンスを逃したりする可能性は低くなります。私たちの仕事があなたの調査、分析、意思決定にどのように役立つかをご覧ください。Visiongainの調査は、フィルフィニッシュ製造市場、2023年から2033年、市場をリードする企業のための商業分析を必要とするすべての人のためのものです。データ、トレンド、予測を見つけることができます。
ページTOPに戻る
目次
目次
1.レポート概要
1.1 研究の目的
1.2 フィルフィニッシュ製造市場の紹介
1.3 この報告書がもたらすもの
1.4 本レポートを読むべき理由
1.5 本分析レポートが回答する主な質問は以下の通りです。
1.6 本レポートは誰のためのものか?
1.7 方法論
1.8 市場の定義
1.8.1 市場評価・予測手法
1.8.2 データバリデーション
1.8.2.1 一次調査
1.8.2.2 セカンダリーリサーチ
1.9 よくある質問(FAQ)
1.10 関連するVisiongainのレポート
1.11 ビジョンゲインについて
2 エグゼクティブサマリー
3 市場の概要
3.1 主要な調査結果
3.2 マーケットダイナミクス
3.2.1 市場促進要因
3.2.1.1 フィルフィニッシュの製造工程における技術的進歩
3.2.1.2 非経口投与用プレフィルドシリンジの普及と生物製剤の需要増加
3.2.1.3 フィルフィニッシュサービスの需要の高まり
3.2.1.4 フィルフィニッシュアウトソーシングの需要の増加
3.2.2 市場の抑制要因
3.2.2.1 特定の治療領域に適したプレフィルドシリンジの設計選択は重要である
3.2.2.2 現在の医薬品充填ラインの利用率は、ガラス包装によって制限される可能性がある
3.2.3 世界市場におけるビジネスチャンス
3.2.3.1 効率的な製造のための投資と柔軟性の向上
3.2.3.2 プレフィルドシリンジの使用は、従来のプロセスの欠点により増加した。
3.2.3.3 医薬品フィルフィニッシュの生産性向上には新技術の導入が不可欠
3.2.4 世界市場における課題
3.3 世界市場向けSWOT分析
3.4 COVID-19の影響度分析
3.4.1 "V字回復"
3.4.2 "W字回復"
3.4.3 "U字回復"
3.4.4 "L字回復"
3.5 ポーターのファイブフォース分析
3.5.1 新規参入の脅威
3.5.2 サプライヤーのバーゲニングパワー
3.5.3 バイヤーのバーゲニングパワー
3.5.4 代替製品・代替サービスによる脅威
3.5.5 既存の競合他社間のライバル関係
3.6 PEST分析
3.6.1 政治的要因
3.6.2 経済的要因
3.6.3 社会的要因
3.6.4 技術的要因
3.6.5 環境要因
3.6.6 法的要因
4 フィルフィニッシュ製造市場分析:製品別
4.1 主要な調査結果
4.2 製品セグメント 市場吸引力指数
4.3 製品別市場分析シェア、2023年・2033年(%)
4.4 フィルフィニッシュ製造市場:製品別、2023-2033年 (US$ Mn)
4.5 インストゥルメント
4.5.1 地域別市場規模、2023-2033年(US$ mn)
4.5.2 2023年および2033年の地域別市場シェア(%)
4.6 消耗品
4.6.1 地域別市場規模、2023-2033年(US$ Mn)
4.6.2 2023年および2033年の地域別市場シェア(%)
5 フィルフィニッシュ製造市場分析:機器別
5.1 主な調査結果
5.2 機器セグメント。市場魅力度指数
5.3 2023年・2033年の機器別市場シェア(%)
5.4 インストゥルメント市場:タイプ別、2023-2033年(US$ Mn)
5.5 システムタイプ
5.5.1 地域別市場規模、2023-2033年(US$ Mn)
5.5.2 2023年および2033年の地域別市場シェア(%)
5.6 機械タイプ
5.6.1 地域別市場規模、2023-2033年(US$ Mn)
5.6.2 2023年および2033年の地域別市場シェア(%)
6 フィルフィニッシュ製造市場分析:システムタイプ別
6.1 主な調査結果
6.2 システムタイプ別セグメント。市場魅力度指数
6.3 システムタイプ別市場シェア、2023年&2033年(%)
6.4 システムタイプ別市場、2023-2033年(US$ Mn)
6.5 統合システム
6.5.1 地域別市場規模、2023-2033年(US$ Mn)
6.5.2 2023年&2033年地域別市場シェア(%)
6.6 スタンドアロン型システム
6.6.1 地域別市場規模、2023-2033年(US$ Mn)
6.6.2 2023年&2033年地域別市場シェア(%)
7 フィルフィニッシュの製造市場分析:機械タイプ別
7.1 主要な調査結果
7.2 マシンタイプセグメント 市場魅力度指数
7.3 機械タイプ別市場シェア、2023年・2033年(%)
7.4 マシンタイプ市場タイプ別、2023-2033年、(US$ Mn)
7.5 自動機
7.5.1 地域別市場規模、2023-2033年(US$ Mn)
7.5.2 2023年および2033年の地域別市場シェア(%)
7.6 半自動機
7.6.1 地域別市場規模、2023-2033年(US$ Mn)
7.6.2 2023年および2033年の地域別市場シェア(%)
7.7 手動機
7.7.1 地域別市場規模、2023-2033年(US$ Mn)
7.7.2 2023年および2033年の地域別市場シェア(%)
8 フィルフィニッシュ製造市場分析:エンドユーザー別
8.1 主要な調査結果
8.2 エンドユーザセグメント。市場魅力度指数
8.3 エンドユーザー別市場シェア、2023年・2033年 (%)
8.4 フィルフィニッシュ製造市場:エンドユーザー別、2023-2033年 (US$ Mn)
8.5 受託製造機関(CMO)
8.5.1 地域別市場規模、2023-2033年(US$ Mn)
8.5.2 2023年および2033年の地域別市場シェア(%)
8.6 製薬会社
8.6.1 地域別市場規模、2023-2033年(US$ Mn)
8.6.2 2023年および2033年の地域別市場シェア(%)
8.7 バイオ製薬会社
8.7.1 地域別市場規模、2023-2033年(US$ Mn)
8.7.2 2023年および2033年の地域別市場シェア(%)
8.8 その他のエンドユーザー
8.8.1 地域別市場規模、2023-2033年(US$ Mn)
8.8.2 2023年および2033年の地域別市場シェア(%)
9 フィルフィニッシュの製造市場分析:消耗品別
9.1 主要な調査結果
9.2 消耗品セグメント 市場魅力度指数
9.3 消耗品別市場シェア、2023年・2033年(%)
9.4 フィルフィニッシュ製造市場:消耗品別、2023-2033年 (US$ Mn)
9.5 プレフィルドシリンジ
9.5.1 地域別市場規模、2023-2033年(US$ Mn)
9.5.2 2023年および2033年の地域別市場シェア(%)
9.6 プレフィルドバイアル
9.6.1 地域別市場規模、2023-2033年(US$ Mn)
9.6.2 2023年および2033年の地域別市場シェア(%)
9.7 プレフィルドカートリッジ
9.7.1 地域別市場規模、2023-2033年(US$ Mn)
9.7.2 2023年および2033年の地域別市場シェア(%)
9.8 プレフィルド包装
9.8.1 地域別市場規模、2023-2033年(US$ Mn)
9.8.2 2023年および2033年の地域別市場シェア(%)
9.9 その他消耗品
9.9.1 地域別市場規模、2023-2033年(US$ Mn)
9.9.2 2023年および2033年の地域別市場シェア(%)
10 フィルフィニッシュ製造市場分析:地域別
10.1 キーファインディング
10.2 フィルフィニッシュ製造の地域別市場
11 北米のフィルフィニッシュ製造市場分析
11.1 キーファインディング
11.2 北米フィルフィニッシュ製造市場魅力度指数
11.3 2023-2033年の製品別市場規模の推定と予測(US$ Mn)
11.4 インストゥルメント別の市場規模の推定と予測、2023-2033年(US$ Mn)
11.5 システムタイプ別市場規模の推定と予測、2023-2033年(US$ Mn)
11.6 マシンタイプ別市場規模の推定と予測、2023-2033年 (US$ Mn)
11.7 エンドユーザー別市場規模の推定と予測、2023-2033年 (US$ Mn)
11.8 消耗品別の市場規模の推定と予測、2023-2033年 (US$ Mn)
11.9 国別市場推定・予測、2023-2033年(US$ Mn)
11.10 米国のフィルフィニッシュ製造市場分析
11.11 カナダのフィルフィニッシュ製造市場分析
12 欧州のフィルフィニッシュ製造市場分析
12.1 キーファインディング
12.2 欧州フィルフィニッシュ製造市場魅力度指数
12.3 製品別市場規模の推定と予測、2023-2033年(US$ Mn)
12.4 インストゥルメント別の市場規模の推定と予測、2023-2033年(US$ Mn)
12.5 システムタイプ別市場規模の推定と予測、2023-2033年(US$ Mn)
12.6 マシンタイプ別市場規模の推定と予測、2023-2033年(US$ Mn)
12.7 エンドユーザー別市場規模の推定と予測、2023-2033年 (US$ Mn)
12.8 消耗品別の市場規模の推定と予測、2023-2033年 (US$ Mn)
12.9 国別市場規模の推定と予測、2023-2033年(US$ Mn)
12.10 ドイツ フィルフィニッシュ製造市場分析
12.11 英国 フィルフィニッシュ製造市場分析
12.12 フランス フィルフィニッシュ製造市場分析
12.13 イタリア フィルフィニッシュの製造市場分析
12.14 スペイン フィルフィニッシュ製造市場分析
12.15 その他の欧州のフィルフィニッシュ製造市場分析
13 アジア太平洋地域のフィルフィニッシュ製造市場分析
13.1 キーファインディング
13.2 アジアのフィルフィニッシュ製造市場魅力度指数
13.3 製品別市場規模の推定と予測、2023-2033年(US$ Mn)
13.4 機器別市場規模の推定と予測、2023-2033年(US$ Mn)
13.5 システムタイプ別市場規模の推定と予測、2023-2033年(US$ Mn)
13.6 マシンタイプ別市場規模の推定と予測、2023-2033年 (US$ Mn)
13.7 エンドユーザー別市場規模の推定と予測、2023-2033年 (US$ Mn)
13.8 消耗品別の市場規模の推定と予測、2023-2033年 (US$ Mn)
13.9 国別市場規模の推定と予測、2023-2033年(US$ Mn)
13.10 中国 フィルフィニッシュ製造市場分析
13.11 インド フィルフィニッシュ製造市場分析
13.12 日本 フィルフィニッシュ製造市場分析
13.13 韓国 フィルフィニッシュの製造市場分析
13.14 オーストラリア フィルフィニッシュ製造市場分析
13.15 その他のアジア太平洋地域のフィルフィニッシュ製造市場分析
14 ラテンアメリカのフィルフィニッシュ製造市場分析
14.1 キーファインディング
14.2 ラテンアメリカのフィルフィニッシュ製造市場魅力度指数
14.3 製品別市場規模の推定と予測、2023-2033年(US$ Mn)
14.4 インストゥルメント別の市場規模の推定と予測、2023-2033年(US$ Mn)
14.5 システムタイプ別市場規模の推定と予測、2023-2033年(US$ Mn)
14.6 マシンタイプ別市場規模の推定と予測、2023-2033年(US$ Mn)
14.7 エンドユーザー別市場規模の推定と予測、2023-2033年 (US$ Mn)
14.8 消耗品別の市場規模の推定と予測、2023-2033年 (US$ Mn)
14.9 国別市場規模の推定と予測、2023-2033年(US$ Mn)
14.10 ブラジル フィルフィニッシュ製造市場分析
14.11 メキシコ フィルフィニッシュ製造市場分析
14.12 その他のラテンアメリカのフィルフィニッシュ製造市場分析
15 中東・アフリカのフィルフィニッシュ製造市場分析
15.1 キーファインディング
15.2 中東・アフリカ フィルフィニッシュ製造市場魅力度指数
15.3 製品別市場規模の推定と予測、2023-2033年(US$ Mn)
15.4 インストゥルメント別の市場規模の推定と予測、2023-2033年(US$ Mn)
15.5 システムタイプ別市場規模の推定と予測、2023-2033年(US$ Mn)
15.6 マシンタイプ別市場規模の推定と予測、2023-2033年 (US$ Mn)
15.7 エンドユーザー別市場規模の推定と予測、2023-2033年 (US$ Mn)
15.8 消耗品別の市場規模の推定と予測、2023-2033年 (US$ Mn)
15.9 国別市場規模の推定と予測、2023-2033年(US$ Mn)
15.10 GCCフィルフィニッシュの製造市場分析
15.11 南アフリカ フィルフィニッシュの製造市場分析
15.12 その他の中東・アフリカ フィルフィニッシュ製造市場分析
16 会社概要
16.1 競合他社の状況、2022年
16.2 Becton, Dickinson and Company (BD)
16.2.1 企業スナップショット
16.2.2 会社概要
16.2.3 財務分析
16.2.3.1 純収益、2017-2021年
16.2.3.2 売上総利益、2017-2021年
16.2.3.3 R&D、2017年~2021年
16.2.3.4 地理的収益シェア、2021年
16.2.4 製品ベンチマーキング
16.2.5 戦略的な展望
16.3 Nipro Corporation
16.3.1 企業スナップショット
16.3.2 会社概要
16.3.3 財務分析
16.3.3.1 純収益、2017-2021年
16.3.3.2 売上総利益、2017-2021年
16.3.3.3 r&d , 2017-2021
16.3.3.4 2021年の地域別売上高シェア
16.3.4 製品ベンチマーキング
16.3.5 戦略的な展望
16.4 Stevanato Group SpA
16.4.1 企業スナップショット
16.4.2 会社概要
16.4.3 製品ベンチマーキング
16.4.4 戦略的な展望
16.5 West Pharmaceutical Services ,Inc
16.5.1 企業スナップショット
16.5.2 会社概要
16.5.3 財務分析
16.5.3.1 純収益、2017-2021年
16.5.3.2 売上総利益、2017-2021年
16.5.3.3 r&d、2017年~2021年
16.5.3.4 地理的収益シェア、2021年
16.5.4 製品ベンチマーキング
16.5.5 戦略的な展望
16.6 Bausch + Ströbel
16.6.1 企業スナップショット
16.6.2 会社概要
16.6.3 製品ベンチマーキング
16.7 Gerresheimer AG
16.7.1 企業スナップショット
16.7.2 会社概要
16.7.3 財務分析
16.7.3.1 純収益、2017-2021年
16.7.3.2 地理的収益シェア、2021年
16.7.4 製品ベンチマーキング
16.7.5 戦略的な展望
16.8 Vanrx Pharmasystems Inc. (Cytiva)
16.8.1 企業スナップショット
16.8.2 会社概要
16.8.3 製品ベンチマーキング
16.9 Groninger& Co. GmbH
16.9.1 企業スナップショット
16.9.2 会社概要
16.9.3 製品ベンチマーキング
16.10 Syntegon Technology
16.10.1 企業スナップショット
16.10.2 会社概要
16.10.3 製品ベンチマーキング
16.10.4 戦略的な展望
16.11 Optima packaging group GMBH
16.11.1 企業スナップショット
16.11.2 会社概要
16.11.3 製品ベンチマーキング
16.12 Schott AG
16.12.1 企業スナップショット
16.12.2 会社概要
16.12.3 製品ベンチマーキング
16.12.4 戦略的な展望
16.13 Aseptic Technologies
16.13.1 企業スナップショット
16.13.2 会社概要
16.13.3 製品ベンチマーキング
16.14 Marchesini Group S.P.A.
16.14.1 企業スナップショット
16.14.2 会社概要
16.14.3 製品ベンチマーキング
16.14.4 戦略的な展望
16.15 Steriline
16.15.1 企業スナップショット
16.15.2 会社概要
16.15.3 製品ベンチマーキング
16.16 I.M.A. Industria Macchine Automatiche S.P.A.
16.16.1 会社概要
16.16.2 会社概要
16.16.3 財務分析
16.16.3.1 純収益、2017-2021年
16.16.3.2 売上総利益、2017-2021年
16.16.3.3 R&D、2017年~2021年
16.16.3.4 地理的な収益シェア、2021年
16.16.4 製品ベンチマーキング
17 結論と提言
17.1 ビジョンゲインからの結びの言葉
17.2 市場関係者への提言
表の一覧
Table 1 Fill Finish Manufacturing Market Snapshot, 2023 & 2033 (US$ million, CAGR %)
Table 2 Fill Finish Manufacturing Swot Analysis
Table 3 Fill Finish Manufacturing Market by Region, 2023-2033 (US$ Mn, AGR (%), CAGR (%)) (V-Shaped Recovery Scenario)
Table 4 Fill Finish Manufacturing Market by Region, 2023-2033 (US$ Mn, AGR (%), CAGR (%)) (W-Shaped Recovery Scenario)
Table 5 Fill Finish Manufacturing Market by Region, 2023-2033 (US$ Mn, AGR (%), CAGR (%)) (U-Shaped Recovery Scenario)
Table 6 Fill Finish Manufacturing Market by Region, 2023-2033 (US$ Mn, AGR (%), CAGR (%)) (L-Shaped Recovery Scenario)
Table 7 Fill Finish Manufacturing Market by Product, 2023-2033 (US$ Mn, AGR (%), CAGR (%))
Table 8 Instruments Market by Region, 2023-2033 (US$ Mn, AGR (%), CAGR (%))
Table 9 Consumables Market by Region, 2023-2033 (US$ Mn, AGR (%), CAGR (%))
Table 10 Instruments Market by Type, 2023-2033 (US$ Mn, AGR (%), CAGR (%))
Table 11 System Type Market by Region, 2023-2033 (US$ Mn, AGR (%), CAGR (%))
Table 12 Machine Type Market by Region, 2023-2033 (US$ Mn, AGR (%), CAGR (%))
Table 13 System Type Market by Type, 2023-2033 (US$ Mn, AGR (%), CAGR (%))
Table 14 Integrated Systems Market by Region, 2023-2033 (US$ Mn, AGR (%), CAGR (%))
Table 15 Standalone Systems Market by Region, 2023-2033 (US$ Mn, AGR (%), CAGR (%))
Table 16 Machine Type Market by Type, 2023-2033 (US$ Mn, AGR (%), CAGR (%))
Table 17 Automated Machines Market by Region, 2023-2033 (US$ Mn, AGR (%), CAGR (%))
Table 18 Semi-Automated Machines Market by Region, 2023-2033 (US$ Mn, AGR (%), CAGR (%))
Table 19 Global Fill Finish Manufacturing Manual Machines Market by Region, 2023-2033 (US$ Mn, AGR (%), CAGR (%))
Table 20 Fill Finish Manufacturing Market by End-User, 2023-2033 (US$ Mn, AGR (%), CAGR (%))
Table 21 Contract Manufacturing Organizations (CMOs) Market by Region, 2023-2033 (US$ Mn, AGR (%), CAGR (%))
Table 22 Pharmaceutical Companies Market by Region, 2023-2033 (US$ Mn, AGR (%), CAGR (%))
Table 23 Biopharmaceutical Companies Market by Region, 2023-2033 (US$ Mn, AGR (%), CAGR (%))
Table 24 Other End-users Market by Region, 2023-2033 (US$ Mn, AGR (%), CAGR (%))
Table 25 Fill Finish Manufacturing Market by Consumables, 2023-2033 (US$ Mn, AGR (%), CAGR (%))
Table 26 Global Prefilled Syringes Market by Region, 2023-2033 (US$ Mn, AGR (%), CAGR (%))
Table 27 Prefilled Vials Market by Region, 2023-2033 (US$ Mn, AGR (%), CAGR (%))
Table 28 Prefilled Cartridges Market by Region, 2023-2033 (US$ Mn, AGR (%), CAGR (%))
Table 29 Global Prefilled Packaging Market by Region, 2023-2033 (US$ Mn, AGR (%), CAGR (%))
Table 30 Other Consumables Market by Region, 2023-2033 (US$ Mn, AGR (%), CAGR (%))
Table 31 Fill Finish Manufacturing Market by Region, 2023-2033 (US$ Mn, AGR (%), CAGR (%))
Table 32 North America Fill Finish Manufacturing Market by Product, 2023-2033 (US$ Mn, AGR (%), CAGR (%))
Table 33 North America Fill Finish Manufacturing Market by Instruments, 2023-2033 (US$ Mn, AGR (%), CAGR (%))
Table 34 North America Fill Finish Manufacturing Instrument Market by System Type, 2023-2033 (US$ Mn, AGR (%), CAGR (%))
Table 35 North America Fill Finish Manufacturing Instrument Market by Machine Type, 2023-2033 (US$ Mn, AGR (%), CAGR (%))
Table 36 North America Fill Finish Manufacturing Market by End-User, 2023-2033 (US$ Mn, AGR (%), CAGR (%))
Table 37 North America Fill Finish Manufacturing Market by Consumables, 2023-2033 (US$ Mn, AGR (%), CAGR (%))
Table 38 North America Fill Finish Manufacturing Market by Country, 2023-2033 (US$ Mn, AGR (%), CAGR (%))
Table 39 U.S. Fill Finish Manufacturing Market by Value, 2023-2033 (US$ Mn, AGR (%), CAGR (%))
Table 40 Canada Fill Finish Manufacturing Market by Value, 2023-2033 (US$ Mn, AGR (%), CAGR (%))
Table 41 Europe Fill Finish Manufacturing Market by Product, 2023-2033 (US$ Mn, AGR (%), CAGR (%))
Table 42 Europe Fill Finish Manufacturing Market by Instruments, 2023-2033 (US$ Mn, AGR (%), CAGR (%))
Table 43 Europe Fill Finish Manufacturing Instrument Market by System Type, 2023-2033 (US$ Mn, AGR (%), CAGR (%))
Table 44 Europe Fill Finish Manufacturing Instrument Market by Machine Type, 2023-2033 (US$ Mn, AGR (%), CAGR (%))
Table 45 Europe Fill Finish Manufacturing Market by End-User, 2023-2033 (US$ Mn, AGR (%), CAGR (%))
Table 46 Europe Fill Finish Manufacturing Market by Consumables, 2023-2033 (US$ Mn, AGR (%), CAGR (%))
Table 47 Europe Fill Finish Manufacturing Market by Country, 2023-2033 (US$ Mn, AGR (%), CAGR (%))
Table 48 Germany Fill Finish Manufacturing Market by Value, 2023-2033 (US$ Mn, AGR (%), CAGR (%))
Table 49 UK Fill Finish Manufacturing Market by Value, 2023-2033 (US$ Mn, AGR (%), CAGR (%))
Table 50 France Fill Finish Manufacturing Market by Value, 2023-2033 (US$ Mn, AGR (%), CAGR (%))
Table 51 Italy Fill Finish Manufacturing Market by Value, 2023-2033 (US$ Mn, AGR (%), CAGR (%))
Table 52 Spain Fill Finish Manufacturing Market by Value, 2023-2033 (US$ Mn, AGR (%), CAGR (%))
Table 53 Rest of Europe Fill Finish Manufacturing Market by Value, 2023-2033 (US$ Mn, AGR (%), CAGR (%))
Table 54 Asia-Pacific Fill Finish Manufacturing Market by Product, 2023-2033 (US$ Mn, AGR (%), CAGR (%))
Table 55 Asia-Pacific Fill Finish Manufacturing Market by Instruments, 2023-2033 (US$ Mn, AGR (%), CAGR (%))
Table 56 Asia-Pacific Fill Finish Manufacturing Instrument Market by System Type, 2023-2033 (US$ Mn, AGR (%), CAGR (%))
Table 57 Asia-Pacific Fill Finish Manufacturing Instrument Market by Machine Type, 2023-2033 (US$ Mn, AGR (%), CAGR (%))
Table 58 Asia-Pacific Fill Finish Manufacturing Market by End-User, 2023-2033 (US$ Mn, AGR (%), CAGR (%))
Table 59 Asia-Pacific Fill Finish Manufacturing Market by Consumables, 2023-2033 (US$ Mn, AGR (%), CAGR (%))
Table 60 Asia-Pacific Fill Finish Manufacturing Market by Country, 2023-2033 (US$ Mn, AGR (%), CAGR (%))
Table 61 China Fill Finish Manufacturing Market by Value, 2023-2033 (US$ Mn, AGR (%), CAGR (%))
Table 62 India Fill Finish Manufacturing Market by Value, 2023-2033 (US$ Mn, AGR (%), CAGR (%))
Table 63 Japan Fill Finish Manufacturing Market by Value, 2023-2033 (US$ Mn, AGR (%), CAGR (%))
Table 64 South Korea Fill Finish Manufacturing Market by Value, 2023-2033 (US$ Mn, AGR (%), CAGR (%))
Table 65 Australia Fill Finish Manufacturing Market by Value, 2023-2033 (US$ Mn, AGR (%), CAGR (%))
Table 66 Rest of Asia-Pacific Fill Finish Manufacturing Market by Value, 2023-2033 (US$ Mn, AGR (%), CAGR (%))
Table 67 Latin America Fill Finish Manufacturing Market by Product, 2023-2033 (US$ Mn, AGR (%), CAGR (%))
Table 68 Latin America Fill Finish Manufacturing Market by Instruments, 2023-2033 (US$ Mn, AGR (%), CAGR (%))
Table 69 Latin America Fill Finish Manufacturing Instrument Market by System Type, 2023-2033 (US$ Mn, AGR (%), CAGR (%))
Table 70 Latin America Fill Finish Manufacturing Instrument Market by Machine Type, 2023-2033 (US$ Mn, AGR (%), CAGR (%))
Table 71 Latin America Fill Finish Manufacturing Market by End-User, 2023-2033 (US$ Mn, AGR (%), CAGR (%))
Table 72 Latin America Fill Finish Manufacturing Market by Consumables, 2023-2033 (US$ Mn, AGR (%), CAGR (%))
Table 73 Latin America Fill Finish Manufacturing Market by Country, 2023-2033 (US$ Mn, AGR (%), CAGR (%))
Table 74 Brazil Fill Finish Manufacturing Market by Value, 2023-2033 (US$ Mn, AGR (%), CAGR (%))
Table 75 Mexico Fill Finish Manufacturing Market by Value, 2023-2033 (US$ Mn, AGR (%), CAGR (%))
Table 76 Rest of Latin America Fill Finish Manufacturing Market by Value, 2023-2033 (US$ Mn, AGR (%), CAGR (%))
Table 77 Middle East & Africa Fill Finish Manufacturing Market by Product, 2023-2033 (US$ Mn, AGR (%), CAGR (%))
Table 78 Middle East & Africa Fill Finish Manufacturing Market by Instruments, 2023-2033 (US$ Mn, AGR (%), CAGR (%))
Table 79 Middle East & Africa Fill Finish Manufacturing Instrument Market by System Type, 2023-2033 (US$ Mn, AGR (%), CAGR (%))
Table 80 Middle East & Africa Fill Finish Manufacturing Instrument Market by Machine Type, 2023-2033 (US$ Mn, AGR (%), CAGR (%))
Table 81 Middle East & Africa Fill Finish Manufacturing Market by End-User, 2023-2033 (US$ Mn, AGR (%), CAGR (%))
Table 82 Middle East & Africa Fill Finish Manufacturing Market by Consumables, 2023-2033 (US$ Mn, AGR (%), CAGR (%))
Table 83 Middle East & Africa Fill Finish Manufacturing Market by Country, 2023-2033 (US$ Mn, AGR (%), CAGR (%))
Table 84 GCC Fill Finish Manufacturing Market by Value, 2023-2033 (US$ Mn, AGR (%), CAGR (%))
Table 85 South Africa Fill Finish Manufacturing Market by Value, 2023-2033 (US$ Mn, AGR (%), CAGR (%))
Table 86 Rest of Middle East & Africa Fill Finish Manufacturing Market by Value, 2023-2033 (US$ Mn, AGR (%), CAGR (%))
Table 87 BD: Key Details, (CEO, HQ, Revenue, Founded, No. of Employees, Company Type, Website, Business Segment)
Table 88 BD: Product Benchmarking
Table 89 BD: Strategic Outlook
Table 90 Nipro Corporation: Key Details, (CEO, HQ, Revenue, Founded, No. of Employees, Company Type, Website, Business Segment)
Table 91 Nipro Corporation: Product Benchmarking
Table 92 Nipro Corporation: Strategic Outlook
Table 93 Stevanato Group SpA: Key Details, (CEO, HQ, Revenue, Founded, No. of Employees, Company Type, Website, Business Segment)
Table 94 Stevanato Group SpA: Product Benchmarking
Table 95 Stevanato Group SpA: Strategic Outlook
Table 96 West Pharmaceutical Services, Inc: Key Details, (CEO, HQ, Revenue, Founded, No. of Employees, Company Type, Website, Business Segment)
Table 97 West Pharmaceutical Services, Inc: Product Benchmarking
Table 98 West Pharmaceutical Services, Inc: Strategic Outlook
Table 99 Bausch+Ströbe: Key Details, (CEO, HQ, Revenue, Founded, No. of Employees, Company Type, Website, Business Segment)
Table 100 Bausch+Ströbe: Product Benchmarking
Table 101 Gerresheimer AG: Key Details, (CEO, HQ, Revenue, Founded, No. of Employees, Company Type, Website, Business Segment)
Table 102 Gerresheimer AG: Product Benchmarking
Table 103 Gerresheimer AG: Strategic Outlook
Table 104 Vanrx Pharmasystems Inc: Key Details, (CEO, HQ, Revenue, Founded, No. of Employees, Company Type, Website, Business Segment)
Table 105 Vanrx Pharmasystems Inc: Product Benchmarking
Table 106 Groninger& Co. GmbH: Key Details, (CEO, HQ, Revenue, Founded, No. of Employees, Company Type, Website, Business Segment)
Table 107 Groninger& Co. GmbH: Product Benchmarking
Table 108 Syntegon Technology: Key Details, (CEO, HQ, Revenue, Founded, No. of Employees, Company Type, Website, Business Segment)
Table 109 Syntegon Technology: Product Benchmarking
Table 110 Syntegon Technology: Strategic Outlook
Table 111 OPTIMA packaging group GmbH: Key Details, (CEO, HQ, Revenue, Founded, No. of Employees, Company Type, Website, Business Segment)
Table 112 OPTIMA packaging group GmbH: Product Benchmarking
Table 113 Schott AG: Key Details, (CEO, HQ, Revenue, Founded, No. of Employees, Company Type, Website, Business Segment)
Table 114 Schott AG: Product Benchmarking
Table 115 Schott AG: Strategic Outlook
Table 116 Aseptic Technologies: Key Details, (CEO, HQ, Revenue, Founded, No. of Employees, Company Type, Website, Business Segment)
Table 117 Aseptic Technologies: Product Benchmarking
Table 118 Marchesini Group S.P.A.: Key Details, (CEO, HQ, Revenue, Founded, No. of Employees, Company Type, Website, Business Segment)
Table 119 Marchesini Group S.P.A.: Product Benchmarking
Table 120 Marchesini Group S.P.A.: Strategic Outlook
Table 121 Steriline: Key Details, (CEO, HQ, Revenue, Founded, No. of Employees, Company Type, Website, Business Segment)
Table 122 Steriline: Product Benchmarking
Table 123 I.M.A. Industria Macchine Automatiche S.P.A: Key Details, (CEO, HQ, Revenue, Founded, No. of Employees, Company Type, Website, Business Segment)
Table 124 I.M.A. Industria Macchine Automatiche S.P.A: Product Benchmarking
図の一覧
Figure 1 Fill Finish Manufacturing Market Segmentation
Figure 2 Global Fill Finish Manufacturing Market Forecast by Region: Market Attractiveness Index
Figure 3 Fill Finish Manufacturing Market by System Type: Market Attractiveness Index
Figure 4 Fill Finish Manufacturing Market by Machine Type: Market Attractiveness Index
Figure 5 Global Fill Finish Manufacturing Market by End-users: Market Attractiveness Index
Figure 6 Global Fill Finish Manufacturing Market by Consumables: Market Attractiveness Index
Figure 7 Fill Finish Manufacturing Market: Market Dynamics
Figure 8 Fill Finish Manufacturing Market by Region, 2023-2033 (US$ Mn, AGR (%)) (V-Shaped Recovery Scenario)
Figure 9 Fill Finish Manufacturing Market by Region, 2023-2033 (US$ Mn, AGR (%)) (W-Shaped Recovery Scenario)
Figure 10 Fill Finish Manufacturing Market by Region, 2023-2033 (US$ Mn, AGR (%)) (U-Shaped Recovery Scenario)
Figure 11 Fill Finish Manufacturing Market by Region, 2023-2033 (US$ Mn, AGR (%)) (L-Shaped Recovery Scenario)
Figure 12 Fill Finish Manufacturing Market: Porter’s Five Forces Analysis
Figure 13 Fill Finish Manufacturing Market: PESTLE Analysis
Figure 14 Fill Finish Manufacturing Market by Product: Market Attractiveness Index
Figure 15 Global Fill Finish Manufacturing Market Share by Product, 2023 & 2033 (%)
Figure 16 Fill Finish Manufacturing Market by Product, 2023-2033 (US$ Mn, AGR (%))
Figure 17 Instruments Market by Region, 2023-2033 (US$ Mn, AGR (%))
Figure 18 Instruments Market Share Forecast by Region, 2023 & 2033 (%)
Figure 19 Consumables Market by Region, 2023-2033 (US$ Mn, AGR (%))
Figure 20 Consumables Market Share Forecast by Region, 2023 & 2033 (%)
Figure 21 Fill Finish Manufacturing Market by Instrument: Market Attractiveness Index
Figure 1 Instrument Market by Type, 2023 & 2033 (Market Share (%))
Figure 2 Instruments Market by Type, 2023-2033 (US$ Mn, AGR (%))
Figure 3 System Type Market by Region, 2023-2033 (US$ Mn, AGR (%))
Figure 4 System Type Market Share Forecast by Region, 2023 & 2033 (%)
Figure 5 Machine Type Market by Region, 2023-2033 (US$ Mn, AGR (%))
Figure 6 Machine Type Market Share Forecast by Region, 2023 & 2033 (%)
Figure 22 Fill Finish Manufacturing Market by System Type: Market Attractiveness Index
Figure 7 Instrument Market Share by System Type, 2023 & 2033 (%)
Figure 8 System Type Market Forecast by Type, 2023-2033 (US$ Mn, AGR (%))
Figure 9 Integrated Systems Market by Region, 2023-2033 (US$ Mn, AGR (%))
Figure 10 Integrated Systems Market Share Forecast by Region, 2023 & 2033 (%)
Figure 11 Standalone Systems Market by Region, 2023-2033 (US$ Mn, AGR (%))
Figure 12 Standalone Systems Market Share Forecast by Region, 2023 & 2033 (%)
Figure 23 Fill Finish Manufacturing Market by Machine Type: Market Attractiveness Index
Figure 13 Instrument Market Share by Machine Type, 2023 & 2033 (%)
Figure 14 Global Fill Finish Manufacturing Instrument Market by Machine Type, 2023-2033 (US$ Mn, AGR (%))
Figure 15 Automated Machines Market by Region, 2023-2033 (US$ Mn, AGR (%))
Figure 16 Automated Machines Market Share Forecast by Region, 2023 & 2033 (%)
Figure 17 Semi-Automated Machines Market by Region, 2023-2033 (US$ Mn, AGR (%))
Figure 18 Semi-Automated Market Share Forecast by Region, 2023 & 2033 (%)
Figure 19 Manual Machines Market by Region, 2023-2033 (US$ Mn, AGR (%))
Figure 20 Manual Machines Market Share Forecast by Region, 2023 & 2033 (%)
Figure 24 Fill Finish Manufacturing Market by End-Users Market Attractiveness Index
Figure 21 Global Fill Finish Manufacturing Instrument Market Share by End Users, 2023 & 2033 (%)
Figure 22 Fill Finish Manufacturing Market by End-User, 2023-2033 (US$ Mn, AGR (%))
Figure 23 Contract Manufacturing Organizations (CMOs) Market by Region, 2023-2033 (US$ Mn, AGR (%))
Figure 24 Contract Manufacturing Organizations Market Share Forecast by Region, 2023 & 2033 (%)
Figure 25 Pharmaceutical Companies Market by Region, 2023-2033 (US$ Mn, AGR (%))
Figure 26 Pharmaceutical Companies Market Share Forecast by Region, 2023 & 2033 (%)
Figure 27 Biopharmaceutical Companies Market by Region, 2023-2033 (US$ Mn, AGR (%))
Figure 28 Biopharmaceutical Companies Market Share Forecast by Region, 2023 & 2033 (%)
Figure 29 Other End-users Market by Region, 2023-2033 (US$ Mn, AGR (%))
Figure 30 Other End-users Market Share Forecast by Region, 2023 & 2033 (%)
Figure 25 Fill Finish Manufacturing Market by Consumables Market Attractiveness Index
Figure 31 Consumables Market Share, 2023 & 2033 (%)
Figure 32 Fill Finish Manufacturing Market by Consumables, 2023-2033 (US$ Mn, AGR (%))
Figure 33 Global Prefilled Syringes Market by Region, 2023-2033 (US$ Mn, AGR (%))
Figure 34 Prefilled Syringes Market Share Forecast by Region, 2023 & 2033 (%)
Figure 35 Prefilled Vials Market by Region, 2023-2033 (US$ Mn, AGR (%))
Figure 36 Prefilled Vials Market Share Forecast by Region, 2023 & 2033 (%)
Figure 37 Prefilled Cartridges Market by Region, 2023-2033 (US$ Mn, AGR (%))
Figure 38 Prefilled Cartridges Market Share Forecast by Region, 2023 & 2033 (%)
Figure 39 Prefilled Packaging Market by Region, 2023-2033 (US$ Mn, AGR (%))
Figure 40 Prefilled Packaging Market Share Forecast by Region, 2023 & 2033 (%)
Figure 41 Other Consumables Market by Region, 2023-2033 (US$ Mn, AGR (%))
Figure 42 Other Consumable Market Share Forecast by Region, 2023 & 2033 (%)
Figure 43 Fill Finish Manufacturing Market Forecast by Region 2023, 2027, 2033 (Market Share %)
Figure 44 Fill Finish Manufacturing Market by Region, 2023-2033 (US$ Mn, AGR (%))
Figure 45 North America Fill Finish Manufacturing Market Attractiveness Index
Figure 46 North America Fill Finish Manufacturing Market by Product, 2023-2033 (US$ Mn, AGR (%))
Figure 47 North America Fill Finish Manufacturing Market Share Forecast by Product, 2023 & 2033 (%)
Figure 48 North America Fill Finish Manufacturing Market by Instruments, 2023-2033 (US$ Mn, AGR (%))
Figure 49 North America Fill Finish Manufacturing Market Share Forecast by Instruments, 2023 & 2033 (%)
Figure 50 North America Fill Finish Manufacturing Instrument Market by System Type, 2023-2033 (US$ Mn, AGR (%))
Figure 51 North America Fill Finish Manufacturing Market Share Forecast by System Type, 2023 & 2033 (%)
Figure 52 North America Fill Finish Manufacturing Instrument Market by Machine Type, 2023-2033 (US$ Mn, AGR (%))
Figure 53 North America Fill Finish Manufacturing Market Share Forecast by Machine Type, 2023 & 2033 (%)
Figure 54 North America Fill Finish Manufacturing Market by End-User, 2023-2033 (US$ Mn, AGR (%))
Figure 55 North America Fill Finish Manufacturing Market Share Forecast by End User, 2023 & 2033 (%)
Figure 56 North America Fill Finish Manufacturing Market by Consumables, 2023-2033 (US$ Mn, AGR (%))
Figure 57 North America Fill Finish Manufacturing Market Share Forecast by Consumables, 2023 & 2033 (%)
Figure 58 North America Fill Finish Manufacturing Market by Country, 2023-2033 (US$ Mn, AGR (%))
Figure 59 North America Fill Finish Manufacturing Market Share Forecast by Country, 2023 & 2033 (%)
Figure 60 U.S. Fill Finish Manufacturing Market by Value, 2023-2033 (US$ Mn, AGR (%))
Figure 61 Canada Fill Finish Manufacturing Market by Value, 2023-2033 (US$ Mn, AGR (%))
Figure 62 Europe Fill Finish Manufacturing Market Attractiveness Index
Figure 63 Europe Fill Finish Manufacturing Market by Product, 2023-2033 (US$ Mn, AGR (%))
Figure 64 Europe Fill Finish Manufacturing Market Share Forecast by Product, 2023 & 2033 (%)
Figure 65 Europe Fill Finish Manufacturing Market by Instruments, 2023-2033 (US$ Mn, AGR (%))
Figure 66 Europe Fill Finish Manufacturing Market Share Forecast by Instruments, 2023 & 2033 (%)
Figure 67 Europe Fill Finish Manufacturing Instrument Market by System Type, 2023-2033 (US$ Mn, AGR (%))
Figure 68 Europe Fill Finish Manufacturing Market Share Forecast by System Type, 2023 & 2033 (%)
Figure 69 Europe Fill Finish Manufacturing Instrument Market by Machine Type, 2023-2033 (US$ Mn, AGR (%))
Figure 70 Europe Fill Finish Manufacturing Market Share Forecast by Machine Type, 2023 & 2033 (%)
Figure 71 Europe Fill Finish Manufacturing Market by End-User, 2023-2033 (US$ Mn, AGR (%))
Figure 72 Europe Fill Finish Manufacturing Market Share Forecast by End User, 2023 & 2033 (%)
Figure 73 Europe Fill Finish Manufacturing Market by Consumables, 2023-2033 (US$ Mn, AGR (%))
Figure 74 Europe Fill Finish Manufacturing Market Share Forecast by Consumables, 2023 & 2033 (%)
Figure 75 Europe Fill Finish Manufacturing Market by Country, 2023-2033 (US$ Mn, AGR (%))
Figure 76 Europe Fill Finish Manufacturing Market Share Forecast by Country, 2023 & 2033 (%)
Figure 77 Germany Fill Finish Manufacturing Market by Value, 2023-2033 (US$ Mn, AGR (%))
Figure 78 UK Fill Finish Manufacturing Market by Value, 2023-2033 (US$ Mn, AGR (%))
Figure 79 France Fill Finish Manufacturing Market by Value, 2023-2033 (US$ Mn, AGR (%))
Figure 80 Italy Fill Finish Manufacturing Market by Value, 2023-2033 (US$ Mn, AGR (%))
Figure 81 Spain Fill Finish Manufacturing Market by Value, 2023-2033 (US$ Mn, AGR (%))
Figure 82 Rest of Europe Fill Finish Manufacturing Market by Value, 2023-2033 (US$ Mn, AGR (%))
Figure 83 Asia Fill Finish Manufacturing Market Attractiveness Index
Figure 84 Asia-Pacific Fill Finish Manufacturing Market by Product, 2023-2033 (US$ Mn, AGR (%))
Figure 85 Asia Pacific Fill Finish Manufacturing Market Share Forecast by Product, 2023 & 2033 (%)
Figure 86 Asia-Pacific Fill Finish Manufacturing Market by Instruments, 2023-2033 (US$ Mn, AGR (%))
Figure 87 Asia Pacific Fill Finish Manufacturing Market Share Forecast by Instruments, 2023 & 2033 (%)
Figure 88 Asia-Pacific Fill Finish Manufacturing Instrument Market by System Type, 2023-2033 (US$ Mn, AGR (%))
Figure 89 Asia Pacific Fill Finish Manufacturing Market Share Forecast by System Type, 2023 & 2033 (%)
Figure 90 Asia-Pacific Fill Finish Manufacturing Instrument Market by Machine Type, 2023-2033 (US$ Mn, AGR (%))
Figure 91 Asia Pacific Fill Finish Manufacturing Market Share Forecast by Machine Type, 2023 & 2033 (%)
Figure 92 Asia-Pacific Fill Finish Manufacturing Market by End-User, 2023-2033 (US$ Mn, AGR (%))
Figure 93 Asia Pacific Fill Finish Manufacturing Market Share Forecast by End User, 2023 & 2033 (%)
Figure 94 Asia-Pacific Fill Finish Manufacturing Market by Consumables, 2023-2033 (US$ Mn, AGR (%))
Figure 95 Asia Pacific Fill Finish Manufacturing Market Share Forecast by Consumables, 2023 & 2033 (%)
Figure 96 Asia-Pacific Fill Finish Manufacturing Market by Country, 2023-2033 (US$ Mn, AGR (%))
Figure 97 Asia Pacific Fill Finish Manufacturing Market Share Forecast by Country, 2023 & 2033 (%)
Figure 98 China Fill Finish Manufacturing Market by Value, 2023-2033 (US$ Mn, AGR (%))
Figure 99 India Fill Finish Manufacturing Market by Value, 2023-2033 (US$ Mn, AGR (%))
Figure 100 Japan Fill Finish Manufacturing Market by Value, 2023-2033 (US$ Mn, AGR (%))
Figure 101 South Korea Fill Finish Manufacturing Market by Value, 2023-2033 (US$ Mn, AGR (%))
Figure 102 Australia Fill Finish Manufacturing Market by Value, 2023-2033 (US$ Mn, AGR (%))
Figure 103 Rest of Asia-Pacific Fill Finish Manufacturing Market by Value, 2023-2033 (US$ Mn, AGR (%))
Figure 104 Latin America Fill Finish Manufacturing Market Attractiveness Index
Figure 105 Latin America Fill Finish Manufacturing Market by Product, 2023-2033 (US$ Mn, AGR (%))
Figure 106 Latin America Fill Finish Manufacturing Market Share Forecast by Product, 2023 & 2033 (%)
Figure 107 Latin America Fill Finish Manufacturing Market by Instruments, 2023-2033 (US$ Mn, AGR (%))
Figure 108 Latin America Fill Finish Manufacturing Market Share Forecast by Instruments, 2023 & 2033 (%)
Figure 109 Latin America Fill Finish Manufacturing Instrument Market by System Type, 2023-2033 (US$ Mn, AGR (%))
Figure 110 Latin America Fill Finish Manufacturing Market Share Forecast by Systems Type, 2023 & 2033 (%)
Figure 111 Latin America Fill Finish Manufacturing Instrument Market by Machine Type, 2023-2033 (US$ Mn, AGR (%))
Figure 112 Latin America Fill Finish Manufacturing Market Share Forecast by Machine Type, 2023 & 2033 (%)
Figure 113 Latin America Fill Finish Manufacturing Market by End-User, 2023-2033 (US$ Mn, AGR (%))
Figure 114 Latin America Fill Finish Manufacturing Market Share Forecast by End User, 2023 & 2033 (%)
Figure 115 Latin America Fill Finish Manufacturing Market by Consumables, 2023-2033 (US$ Mn, AGR (%))
Figure 116 Latin America Fill Finish Manufacturing Market Share Forecast by Consumables, 2023 & 2033 (%)
Figure 117 Latin America Fill Finish Manufacturing Market by Country, 2023-2033 (US$ Mn, AGR (%))
Figure 118 Latin America Fill Finish Manufacturing Market Share Forecast by Country, 2023 & 2033 (%)
Figure 119 Brazil Fill Finish Manufacturing Market by Value, 2023-2033 (US$ Mn, AGR (%))
Figure 120 Mexico Fill Finish Manufacturing Market by Value, 2023-2033 (US$ Mn, AGR (%))
Figure 121 Rest of Latin America Fill Finish Manufacturing Market by Value, 2023-2033 (US$ Mn, AGR (%))
Figure 122 Middle East & Africa Fill Finish Manufacturing Market Attractiveness Index
Figure 123 Middle East & Africa Fill Finish Manufacturing Market by Product, 2023-2033 (US$ Mn, AGR (%))
Figure 124 Middle East & Africa Fill Finish Manufacturing Market Share Forecast by Product, 2023 & 2033 (%)
Figure 125 Middle East & Africa Fill Finish Manufacturing Market by Instruments, 2023-2033 (US$ Mn, AGR (%))
Figure 126 Middle East & Africa Fill Finish Manufacturing Market Share Forecast by Instruments, 2023 & 2033 (%)
Figure 127 Middle East & Africa Fill Finish Manufacturing Instrument Market by System Type, 2023-2033 (US$ Mn, AGR (%))
Figure 128 Middle East & Africa Fill Finish Manufacturing Market Share Forecast by System Type, 2023 & 2033 (%)
Figure 129 Middle East & Africa Fill Finish Manufacturing Instrument Market by Machine Type, 2023-2033 (US$ Mn, AGR (%))
Figure 130 Middle East & Africa Fill Finish Manufacturing Market Share Forecast by Machine Type, 2023 & 2033 (%)
Figure 131 Middle East & Africa Fill Finish Manufacturing Market by End-User, 2023-2033 (US$ Mn, AGR (%))
Figure 132 Middle East & Africa Fill Finish Manufacturing Market Share Forecast by End User, 2023 & 2033 (%)
Figure 133 Middle East & Africa Fill Finish Manufacturing Market by Consumables, 2023-2033 (US$ Mn, AGR (%))
Figure 134 Middle East & Africa Fill Finish Manufacturing Market Share Forecast by Consumables, 2023 & 2033 (%)
Figure 135 Middle East & Africa Fill Finish Manufacturing Market by Country, 2023-2033 (US$ Mn, AGR (%))
Figure 136 Middle East & Africa Fill Finish Manufacturing Market Share Forecast by Country, 2023 & 2033 (%)
Figure 137 GCC Fill Finish Manufacturing Market by Value, 2023-2033 (US$ Mn, AGR (%))
Figure 138 South Africa Fill Finish Manufacturing Market by Value, 2023-2033 (US$ Mn, AGR (%))
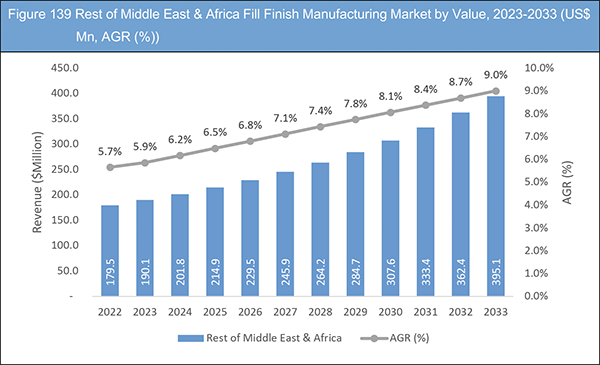
Figure 139 Rest of Middle East & Africa Fill Finish Manufacturing Market by Value, 2023-2033 (US$ Mn, AGR (%))
Figure 140 Fill Finish Manufacturing Market: Company Share/Ranking, 2022
Figure 141 BD: Net Revenue, 2017-2021 (US$ million, AGR%)
Figure 142 BD: Gross Profit, 2017-2021 (US$ million, AGR%)
Figure 143 BD: R&D, 2017-2021 (US$ million, AGR%)
Figure 144 BD: Geographical Share, 2021 (%)
Figure 145 Nipro Corporation: Net Revenue, 2017-2021 (US$ million, AGR%)
Figure 146 Nipro Corporation: Gross Profit, 2017-2021 (US$ million, AGR%)
Figure 147 Nipro Corporation: R&D, 2017-2021 (US$ million, AGR%)
Figure 148 Nipro Corporation: Geographical Share, 2021 (%)
Figure 149 West Pharmaceutical Services, Inc: Net Revenue, 2017-2021 (US$ million, AGR%)
Figure 150 West Pharmaceutical Services, Inc: Gross Profit, 2017-2021 (US$ million, AGR%)
Figure 151 West Pharmaceutical Services, Inc: R&D, 2017-2021 (US$ million, AGR%)
Figure 152 West Pharmaceutical Services, Inc.: Geographical Share, 2021 (%)
Figure 153 Gerresheimer AG: Net Revenue, 2017-2021 (US$ million, AGR%)
Figure 154 Gerresheimer AG.: Geographical Share, 2021 (%)
Figure 155 I.M.A. Industria Macchine Automatiche S.P.A: Net Revenue, 2017-2021 (US$ million, AGR%)
Figure 156 I.M.A. Industria Macchine Automatiche S.P.A: Gross Profit, 2017-2021 (US$ million, AGR%)
Figure 157 I.M.A. Industria Macchine Automatiche S.P.A: R&D, 2017-2021 (US$ million, AGR%)
Figure 158 I.M.A. Industria Macchine Automatiche S.P.A.: Geographical Share, 2021 (%)
ページTOPに戻る
Summary
Report Details
The Fill-Finish Manufacturing Market Report 2023-2033: This report will prove invaluable to leading firms striving for new revenue pockets if they wish to better understand the industry and its underlying dynamics. It will be useful for companies that would like to expand into different industries or to expand their existing operations in a new region.
Outlook for Finish Manufacturing is Optimistic for the Future
With advancements in technology, the industry is expected to continue to grow, resulting in increased job opportunities and a stronger economy. The increased demand for finished products, such as furniture, appliances, and electronics, is driving this growth, as well as the growing popularity of environmentally friendly products. Finish manufacturers are incorporating new techniques and materials to improve their products and increase efficiency, such as automation and the use of sustainable materials.
Additionally, the global market for finish manufacturing is expanding, with increasing demand in emerging economies, particularly in Asia. This provides an opportunity for manufacturers to expand their business & access emerging markets. However, the industry is facing challenges as well, such as increasing competition and the need to adapt to changing consumer preferences. Overall, the finish manufacturing industry is expected to continue to grow and thrive in the coming years, as long as companies continue to adopt new technologies and meet consumer demands. With the right strategies and investments, the future looks bright for the finish manufacturing industry.
What Questions Should You Ask before Buying a Market Research Report?
• How is the fill finish manufacturing market evolving?
• What is driving and restraining the fill finish manufacturing market?
• How will each fill finish manufacturing submarket segment grow over the forecast period and how much revenue will these submarkets account for in 2033?
• How will the market shares for each fill finish manufacturing submarket develop from 2023 to 2033?
• What will be the main driver for the overall market from 2023 to 2033?
• Will leading fill finish manufacturing markets broadly follow the macroeconomic dynamics, or will individual national markets outperform others?
• How will the market shares of the national markets change by 2033 and which geographical region will lead the market in 2033?
• Who are the leading players and what are their prospects over the forecast period?
• What are the fill finish manufacturing projects for these leading companies?
• How will the industry evolve during the period between 2023 and 2033? What are the implications of fill finish manufacturing projects taking place now and over the next 10 years?
• Is there a greater need for product commercialisation to further scale the fill finish manufacturing market?
• Where is the fill finish manufacturing market heading and how can you ensure you are at the forefront of the market?
• What are the best investment options for new product and service lines?
• What are the key prospects for moving companies into a new growth path and C-suite?
You need to discover how this will impact the fill finish manufacturing market today, and over the next 10 years:
• Our 308-page report provides 124 tables and 158 charts/graphs exclusively to you.
• The report highlights key lucrative areas in the industry so you can target them – NOW.
• It contains in-depth analysis of global, regional and national sales and growth.
• It highlights for you the key successful trends, changes and revenue projections made by your competitors.
This report tells you TODAY how the fill finish manufacturing market will develop in the next 10 years, and in line with the variations in COVID-19 economic recession and bounce. This market is more critical now than at any point over the last 10 years.
Forecasts to 2033 and other analyses reveal commercial prospects
• In addition to revenue forecasting to 2033, our new study provides you with recent results, growth rates, and market shares.
• You will find original analyses, with business outlooks and developments.
• Discover qualitative analyses (including market dynamics, drivers, opportunities, restraints and challenges), cost structure, impact of rising fill finish manufacturing prices and recent developments.
This report includes data analysis and invaluable insight into how COVID-19 will affect the industry and your company. Four COVID-19 recovery patterns and their impact, namely, “V”, “L”, “W” and “U” are discussed in this report.
Segments Covered in the Report
Product
• Instruments
• Consumables
Instruments
• System Type
• Machine Type
System Type
• Integrated Systems
• Standalone Systems
Machine Type
• Automated Machines
• Semi-Automated Machines
• Manual Machines
End-user
• Contract Manufacturing Organizations (CMOs)
• Pharmaceutical Companies
• Biopharmaceutical Companies
• Other End-User
Consumables
• Prefilled Syringes
• Prefilled Vials
• Prefilled Cartridges
• Prefilled Packaging
• Other Consumables
In addition to the revenue predictions for the overall world market and segments, you will also find revenue forecasts for four regional and 20 leading national markets:
North America
• U.S.
• Canada
Europe
• Germany
• United Kingdom
• France
• Italy
• Spain
• Rest of Europe
Asia Pacific
• China
• Japan
• India
• Australia
• South Korea
• Rest of Asia Pacific
Latin America
• Brazil
• Mexico
• Rest of Latin America
Middle East & Africa
• GCC
• South Africa
• Rest of Middle East & Africa
The report also includes profiles and for some of the leading companies in the Fill Finish Manufacturing Market, 2023 to 2033, with a focus on this segment of these companies’ operations.
Leading companies and the potential for market growth
• Aseptic Technologies
• Bausch + Ströbel
• Becton, Dickinson and Company (BD)
• Gerresheimer AG
• Groninger& Co. GmbH
• I.M.A. Industria Macchine Automatiche S.P.A
• Marchesini Group S.P.A.
• Nipro Corporation
• Optima Packaging Group GMBH
• Schott AG
• Steriline
• Stevanato Group SpA
• Syntegon Technology
• Vanrx Pharmasystems Inc. (Cytiva)
• West Pharmaceutical Services, Inc.
Overall world revenue for Fill Finish Manufacturing Market, 2023 to 2033 in terms of value the market will surpass US$10,077.3 million in 2023, our work calculates. We predict strong revenue growth through to 2033. Our work identifies which organizations hold the greatest potential. Discover their capabilities, progress, and commercial prospects, helping you stay ahead.
How will the Fill Finish Manufacturing Market, 2023 to 2033 report help you?
In summary, our 300+ page report provides you with the following knowledge:
• Revenue forecasts to 2033 for Fill Finish Manufacturing Market, 2023 to 2033 Market, with forecasts for product, instruments, system type, machine type, consumables, end-user and company size, each forecast at a global and regional level – discover the industry’s prospects, finding the most lucrative places for investments and revenues.
• Revenue forecasts to 2033 for four regional and 20 key national markets – See forecasts for the Fill Finish Manufacturing Market, 2023 to 2033 market in North America, Europe, Asia-Pacific, Latin America and Middle East & Africa. Also forecasted is the market in the US, Canada, Mexico, Brazil, Germany, France, UK, Italy, China, India, Japan, and Australia among other prominent economies.
• Prospects for established firms and those seeking to enter the market – including company profiles for 15 of the major companies involved in the Fill Finish Manufacturing Market, 2023 to 2033.
Find quantitative and qualitative analyses with independent predictions. Receive information that only our report contains, staying informed with invaluable business intelligence.
Information found nowhere else
With our new report, you are less likely to fall behind in knowledge or miss out on opportunities. See how our work could benefit your research, analyses, and decisions. Visiongain’s study is for everybody needing commercial analyses for the Fill Finish Manufacturing Market, 2023 to 2033, market-leading companies. You will find data, trends and predictions.
ページTOPに戻る
Table of Contents
Table of Contents
1. Report Overview
1.1 Objectives of the Study
1.2 Introduction to Fill Finish Manufacturing Market
1.3 What This Report Delivers
1.4 Why You Should Read This Report
1.5 Key Questions Answered by This Analytical Report Include:
1.6 Who is This Report For?
1.7 Methodology
1.8 Market Definitions
1.8.1 Market Evaluation & Forecasting Methodology
1.8.2 Data Validation
1.8.2.1 Primary Research
1.8.2.2 Secondary Research
1.9 Frequently Asked Questions (FAQs)
1.10 Associated Visiongain Reports
1.11 About Visiongain
2 Executive Summary
3 Market Overview
3.1 Key Findings
3.2 Market Dynamics
3.2.1 Market Driving Factors
3.2.1.1 Technological Advancements in Fill Finish Manufacturing Processes
3.2.1.2 Rising Adoption of Prefilled Syringes for Parenteral Administration and Elevated Demand for Biologics
3.2.1.3 Growing Demand for Fill-Finish Services
3.2.1.4 Increasing Demand for Fill Finish Outsourcing
3.2.2 Market Restraining Factors
3.2.2.1 Design Choice of Pre-Filled Syringe—Suitable for a Specific Therapeutic Area—is Critical
3.2.2.2 Current Pharmaceutical Filling Line Utilization Can Be Limited by Glass Packaging
3.2.3 Opportunities in the Global Market
3.2.3.1 Increasing Investment and Flexibility for Effective Manufacturing
3.2.3.2 Usage of Prefilled Syringe Has Risen Due to the Disadvantages in the Traditional Process
3.2.3.3 Future of Pharmaceutical Fill/Finish Productivity Demands the Adoption of New Technology
3.2.4 Challenges in the Global Market
3.3 SWOT Analysis for Global Market
3.4 COVID-19 Impact Analysis
3.4.1 “V-Shaped Recovery”
3.4.2 “W-Shaped Recovery”
3.4.3 “U-Shaped Recovery”
3.4.4 “L-Shaped Recovery”
3.5 Porter’s Five Forces Analysis
3.5.1 Threats of New Entrants
3.5.2 Bargaining Power of Suppliers
3.5.3 Bargaining Power of Buyers
3.5.4 Threats of Substitute Products or Services
3.5.5 Rivalry among the Existing Competitors
3.6 PEST Analysis
3.6.1 Political Factors
3.6.2 Economic Factors
3.6.3 Social Factors
3.6.4 Technological Factors
3.6.5 Environmental Factors
3.6.6 Legal Factors
4 Fill Finish Manufacturing Market Analysis by Product
4.1 Key Findings
4.2 Product Segment: Market Attractiveness Index
4.3 Market Analysis Share by Product, 2023 & 2033 (%)
4.4 Fill Finish Manufacturing Market by Product, 2023-2033 (US$ Mn)
4.5 Instruments
4.5.1 Market Size by Region, 2023-2033 (US$ mn)
4.5.2 Market Share by Region, 2023 & 2033 (%)
4.6 Consumables
4.6.1 Market Size by Region, 2023-2033 (US$ Mn)
4.6.2 Market Share by Region, 2023 & 2033 (%)
5 Fill Finish Manufacturing Market Analysis by Instruments
5.1 Key findings
5.2 Instrument Segment: Market Attractiveness Index
5.3 Market Share by Instruments, 2023 & 2033 (%)
5.4 Instrument Market by Type, 2023-2033 (US$ Mn)
5.5 System Type
5.5.1 Market Size by Region, 2023-2033 (US$ Mn)
5.5.2 Market Share by Region, 2023 & 2033 (%)
5.6 Machine Type
5.6.1 Market Size by Region, 2023-2033 (US$ Mn)
5.6.2 Market Share by Region, 2023 & 2033 (%)
6 Fill Finish Manufacturing Market Analysis by System Type
6.1 Key findings
6.2 System Type Segment: Market Attractiveness Index
6.3 Market Share by System Type, 2023 & 2033 (%)
6.4 System Type Market by Type, 2023-2033 (US$ Mn)
6.5 Integrated Systems
6.5.1 Market Size by Region, 2023-2033 (US$ Mn)
6.5.2 Market Share by Region, 2023 & 2033 (%)
6.6 Standalone Systems
6.6.1 Market Size by Region, 2023-2033 (US$ Mn)
6.6.2 Market Share by Region, 2023 & 2033 (%)
7 Fill Finish Manufacturing Market Analysis by Machine Type
7.1 Key findings
7.2 Machine Type Segment: Market Attractiveness Index
7.3 Machine Type Market Share by Type, 2023 & 2033 (%)
7.4 Machine Type Market by Type, 2023-2033, (US$ Mn)
7.5 Automated Machines
7.5.1 Market Size by Region, 2023-2033 (US$ Mn)
7.5.2 Market Share by Region, 2023 & 2033 (%)
7.6 Semi-Automated Machines
7.6.1 Market Size by Region, 2023-2033 (US$ Mn)
7.6.2 Market Share by Region, 2023 & 2033 (%)
7.7 Manual Machines
7.7.1 Market Size by Region, 2023-2033 (US$ Mn)
7.7.2 Market Share by Region, 2023 & 2033 (%)
8 Fill Finish Manufacturing Market Analysis by End Users
8.1 Key findings
8.2 End-Users Segment: Market Attractiveness Index
8.3 Market Share by End Users, 2023 & 2033 (%)
8.4 Fill Finish Manufacturing Market by End Users, 2023-2033 (US$ Mn)
8.5 Contract Manufacturing Organizations (CMOs)
8.5.1 Market Size by Region, 2023-2033 (US$ Mn)
8.5.2 Market Share by Region, 2023 & 2033 (%)
8.6 Pharmaceutical Companies
8.6.1 Market Size by Region, 2023-2033 (US$ Mn)
8.6.2 Market Share by Region, 2023 & 2033 (%)
8.7 Biopharmaceutical Companies
8.7.1 Market Size by Region, 2023-2033 (US$ Mn)
8.7.2 Market Share by Region, 2023 & 2033 (%)
8.8 Other End-users
8.8.1 Market Size by Region, 2023-2033 (US$ Mn)
8.8.2 Market Share by Region, 2023 & 2033 (%)
9 Fill Finish Manufacturing Market Analysis by Consumables
9.1 Key findings
9.2 Consumables Segment: Market Attractiveness Index
9.3 Market Share by Consumables, 2023 & 2033 (%)
9.4 Fill Finish Manufacturing Market by Consumables, 2023-2033 (US$ Mn)
9.5 Prefilled Syringes
9.5.1 Market Size by Region, 2023-2033 (US$ Mn)
9.5.2 Market Share by Region, 2023 & 2033 (%)
9.6 Prefilled Vials
9.6.1 Market Size by Region, 2023-2033 (US$ Mn)
9.6.2 Market Share by Region, 2023 & 2033 (%)
9.7 Prefilled Cartridges
9.7.1 Market Size by Region, 2023-2033 (US$ Mn)
9.7.2 Market Share by Region, 2023 & 2033 (%)
9.8 Prefilled Packaging
9.8.1 Market Size by Region, 2023-2033 (US$ Mn)
9.8.2 Market Share by Region, 2023 & 2033 (%)
9.9 Other Consumables
9.9.1 Market Size by Region, 2023-2033 (US$ Mn)
9.9.2 Market Share by Region, 2023 & 2033 (%)
10 Fill Finish Manufacturing Market Analysis by Region
10.1 Key Findings
10.2 Fill Finish Manufacturing Market by Region
11 North America Fill Finish Manufacturing Market Analysis
11.1 Key Findings
11.2 North America Fill Finish Manufacturing Market Attractiveness Index
11.3 Market Size Estimation and Forecast by Product, 2023-2033 (US$ Mn)
11.4 Market Size Estimation and Forecast by Instruments, 2023-2033 (US$ Mn)
11.5 Market Size Estimation and Forecast by System Type, 2023-2033 (US$ Mn)
11.6 Market Size Estimation and Forecast by Machine Type, 2023-2033 (US$ Mn)
11.7 Market Size Estimation and Forecast by End-User, 2023-2033 (US$ Mn)
11.8 Market Size Estimation and Forecast by Consumables, 2023-2033 (US$ Mn)
11.9 Market Estimation and Forecast by Country, 2023-2033 (US$ Mn)
11.10 U.S. Fill Finish Manufacturing Market Analysis
11.11 Canada Fill Finish Manufacturing Market Analysis
12 Europe Fill Finish Manufacturing Market Analysis
12.1 Key Findings
12.2 Europe Fill Finish Manufacturing Market Attractiveness Index
12.3 Market Size Estimation and Forecast by Product, 2023-2033 (US$ Mn)
12.4 Market Size Estimation and Forecast by Instruments, 2023-2033 (US$ Mn)
12.5 Market Size Estimation and Forecast by System Type, 2023-2033 (US$ Mn)
12.6 Market Size Estimation and Forecast by Machine Type, 2023-2033 (US$ Mn)
12.7 Market Size Estimation and Forecast by End-User, 2023-2033 (US$ Mn)
12.8 Market Size Estimation and Forecast by Consumables, 2023-2033 (US$ Mn)
12.9 Market Size Estimation and Forecast by Country, 2023-2033 (US$ Mn)
12.10 Germany Fill Finish Manufacturing Market Analysis
12.11 UK Fill Finish Manufacturing Market Analysis
12.12 France Fill Finish Manufacturing Market Analysis
12.13 Italy Fill Finish Manufacturing Market Analysis
12.14 Spain Fill Finish Manufacturing Market Analysis
12.15 Rest of Europe Fill Finish Manufacturing Market Analysis
13 Asia Pacific Fill Finish Manufacturing Market Analysis
13.1 Key Findings
13.2 Asia Fill Finish Manufacturing Market Attractiveness Index
13.3 Market Size Estimation and Forecast by Product, 2023-2033 (US$ Mn)
13.4 Market Size Estimation and Forecast by Instrument, 2023-2033 (US$ Mn)
13.5 Market Size Estimation and Forecast by System Type, 2023-2033 (US$ Mn)
13.6 Market Size Estimation and Forecast by Machine Type, 2023-2033 (US$ Mn)
13.7 Market Size Estimation and Forecast by End-User, 2023-2033 (US$ Mn)
13.8 Market Size Estimation and Forecast by Consumables, 2023-2033 (US$ Mn)
13.9 Market Size Estimation and Forecast by Country, 2023-2033 (US$ Mn)
13.10 China Fill Finish Manufacturing Market Analysis
13.11 India Fill Finish Manufacturing Market Analysis
13.12 Japan Fill Finish Manufacturing Market Analysis
13.13 South Korea Fill Finish Manufacturing Market Analysis
13.14 Australia Fill Finish Manufacturing Market Analysis
13.15 Rest of Asia Pacific Fill Finish Manufacturing Market Analysis
14 Latin America Fill Finish Manufacturing Market Analysis
14.1 Key Findings
14.2 Latin America Fill Finish Manufacturing Market Attractiveness Index
14.3 Market Size Estimation and Forecast by Product, 2023-2033 (US$ Mn)
14.4 Market Size Estimation and Forecast by Instruments, 2023-2033 (US$ Mn)
14.5 Market Size Estimation and Forecast by System Type, 2023-2033 (US$ Mn)
14.6 Market Size Estimation and Forecast by Machine Type, 2023-2033 (US$ Mn)
14.7 Market Size Estimation and Forecast by End-User, 2023-2033 (US$ Mn)
14.8 Market Size Estimation and Forecast by Consumables, 2023-2033 (US$ Mn)
14.9 Market Size Estimation and Forecast by Country, 2023-2033 (US$ Mn)
14.10 Brazil Fill Finish Manufacturing Market Analysis
14.11 Mexico Fill Finish Manufacturing Market Analysis
14.12 Rest of Latin America Fill Finish Manufacturing Market Analysis
15 Middle East & Africa Fill Finish Manufacturing Market Analysis
15.1 Key Findings
15.2 Middle East & Africa Fill Finish Manufacturing Market Attractiveness Index
15.3 Market Size Estimation and Forecast by Product, 2023-2033 (US$ Mn)
15.4 Market Size Estimation and Forecast by Instruments, 2023-2033 (US$ Mn)
15.5 Market Size Estimation and Forecast by System Type, 2023-2033 (US$ Mn)
15.6 Market Size Estimation and Forecast by Machine Type, 2023-2033 (US$ Mn)
15.7 Market Size Estimation and Forecast by End-User, 2023-2033 (US$ Mn)
15.8 Market Size Estimation and Forecast by Consumables, 2023-2033 (US$ Mn)
15.9 Market Size Estimation and Forecast by Country, 2023-2033 (US$ Mn)
15.10 GCC Fill Finish Manufacturing Market Analysis
15.11 South Africa Fill Finish Manufacturing Market Analysis
15.12 Rest of Middle East & Africa Fill Finish Manufacturing Market Analysis
16 Company Profiles
16.1 Competitive Landscape, 2022
16.2 Becton, Dickinson and Company (BD)
16.2.1 Company Snapshot
16.2.2 Company Overview
16.2.3 Financial Analysis
16.2.3.1 Net Revenue, 2017-2021
16.2.3.2 Gross Profit, 2017-2021
16.2.3.3 R&D, 2017-2021
16.2.3.4 Geographical Revenue Share, 2021
16.2.4 Product Benchmarking
16.2.5 Strategic Outlook
16.3 Nipro Corporation
16.3.1 Company Snapshot
16.3.2 Company Overview
16.3.3 Financial Analysis
16.3.3.1 Net Revenue, 2017-2021
16.3.3.2 Gross Profit, 2017-2021
16.3.3.3 R&D , 2017-2021
16.3.3.4 Geographical Revenue Share, 2021
16.3.4 Product Benchmarking
16.3.5 Strategic Outlook
16.4 Stevanato Group SpA
16.4.1 Company Snapshot
16.4.2 Company Overview
16.4.3 Product Benchmarking
16.4.4 Strategic Outlook
16.5 West Pharmaceutical Services ,Inc
16.5.1 Company Snapshot
16.5.2 Company Overview
16.5.3 Financial Analysis
16.5.3.1 Net Revenue, 2017-2021
16.5.3.2 Gross Profit, 2017-2021
16.5.3.3 R&D, 2017-2021
16.5.3.4 Geographical Revenue Share, 2021
16.5.4 Product Benchmarking
16.5.5 Strategic Outlook
16.6 Bausch + Ströbel
16.6.1 Company Snapshot
16.6.2 Company Overview
16.6.3 Product Benchmarking
16.7 Gerresheimer AG
16.7.1 Company Snapshot
16.7.2 Company Overview
16.7.3 Financial Analysis
16.7.3.1 Net Revenue, 2017-2021
16.7.3.2 Geographical Revenue Share, 2021
16.7.4 Product Benchmarking
16.7.5 Strategic Outlook
16.8 Vanrx Pharmasystems Inc. (Cytiva)
16.8.1 Company Snapshot
16.8.2 Company Overview
16.8.3 Product Benchmarking
16.9 Groninger& Co. GmbH
16.9.1 Company Snapshot
16.9.2 Company Overview
16.9.3 Product Benchmarking
16.10 Syntegon Technology
16.10.1 Company Snapshot
16.10.2 Company Overview
16.10.3 Product Benchmarking
16.10.4 Strategic Outlook
16.11 Optima packaging group GMBH
16.11.1 Company Snapshot
16.11.2 Company Overview
16.11.3 Product Benchmarking
16.12 Schott AG
16.12.1 Company Snapshot
16.12.2 Company Overview
16.12.3 Product Benchmarking
16.12.4 Strategic Outlook
16.13 Aseptic Technologies
16.13.1 Company Snapshot
16.13.2 Company Overview
16.13.3 Product Benchmarking
16.14 Marchesini Group S.P.A.
16.14.1 Company Snapshot
16.14.2 Company Overview
16.14.3 Product Benchmarking
16.14.4 Strategic Outlook
16.15 Steriline
16.15.1 Company Snapshot
16.15.2 Company Overview
16.15.3 Product Benchmarking
16.16 I.M.A. Industria Macchine Automatiche S.P.A
16.16.1 Company Snapshot
16.16.2 Company Overview
16.16.3 Financial Analysis
16.16.3.1 Net Revenue, 2017-2021
16.16.3.2 Gross Profit, 2017-2021
16.16.3.3 R&D, 2017-2021
16.16.3.4 Geographical Revenue Share, 2021
16.16.4 Product Benchmarking
17 Conclusion and Recommendations
17.1 Concluding Remarks from Visiongain
17.2 Recommendations for Market Players
List of Tables
Table 1 Fill Finish Manufacturing Market Snapshot, 2023 & 2033 (US$ million, CAGR %)
Table 2 Fill Finish Manufacturing Swot Analysis
Table 3 Fill Finish Manufacturing Market by Region, 2023-2033 (US$ Mn, AGR (%), CAGR (%)) (V-Shaped Recovery Scenario)
Table 4 Fill Finish Manufacturing Market by Region, 2023-2033 (US$ Mn, AGR (%), CAGR (%)) (W-Shaped Recovery Scenario)
Table 5 Fill Finish Manufacturing Market by Region, 2023-2033 (US$ Mn, AGR (%), CAGR (%)) (U-Shaped Recovery Scenario)
Table 6 Fill Finish Manufacturing Market by Region, 2023-2033 (US$ Mn, AGR (%), CAGR (%)) (L-Shaped Recovery Scenario)
Table 7 Fill Finish Manufacturing Market by Product, 2023-2033 (US$ Mn, AGR (%), CAGR (%))
Table 8 Instruments Market by Region, 2023-2033 (US$ Mn, AGR (%), CAGR (%))
Table 9 Consumables Market by Region, 2023-2033 (US$ Mn, AGR (%), CAGR (%))
Table 10 Instruments Market by Type, 2023-2033 (US$ Mn, AGR (%), CAGR (%))
Table 11 System Type Market by Region, 2023-2033 (US$ Mn, AGR (%), CAGR (%))
Table 12 Machine Type Market by Region, 2023-2033 (US$ Mn, AGR (%), CAGR (%))
Table 13 System Type Market by Type, 2023-2033 (US$ Mn, AGR (%), CAGR (%))
Table 14 Integrated Systems Market by Region, 2023-2033 (US$ Mn, AGR (%), CAGR (%))
Table 15 Standalone Systems Market by Region, 2023-2033 (US$ Mn, AGR (%), CAGR (%))
Table 16 Machine Type Market by Type, 2023-2033 (US$ Mn, AGR (%), CAGR (%))
Table 17 Automated Machines Market by Region, 2023-2033 (US$ Mn, AGR (%), CAGR (%))
Table 18 Semi-Automated Machines Market by Region, 2023-2033 (US$ Mn, AGR (%), CAGR (%))
Table 19 Global Fill Finish Manufacturing Manual Machines Market by Region, 2023-2033 (US$ Mn, AGR (%), CAGR (%))
Table 20 Fill Finish Manufacturing Market by End-User, 2023-2033 (US$ Mn, AGR (%), CAGR (%))
Table 21 Contract Manufacturing Organizations (CMOs) Market by Region, 2023-2033 (US$ Mn, AGR (%), CAGR (%))
Table 22 Pharmaceutical Companies Market by Region, 2023-2033 (US$ Mn, AGR (%), CAGR (%))
Table 23 Biopharmaceutical Companies Market by Region, 2023-2033 (US$ Mn, AGR (%), CAGR (%))
Table 24 Other End-users Market by Region, 2023-2033 (US$ Mn, AGR (%), CAGR (%))
Table 25 Fill Finish Manufacturing Market by Consumables, 2023-2033 (US$ Mn, AGR (%), CAGR (%))
Table 26 Global Prefilled Syringes Market by Region, 2023-2033 (US$ Mn, AGR (%), CAGR (%))
Table 27 Prefilled Vials Market by Region, 2023-2033 (US$ Mn, AGR (%), CAGR (%))
Table 28 Prefilled Cartridges Market by Region, 2023-2033 (US$ Mn, AGR (%), CAGR (%))
Table 29 Global Prefilled Packaging Market by Region, 2023-2033 (US$ Mn, AGR (%), CAGR (%))
Table 30 Other Consumables Market by Region, 2023-2033 (US$ Mn, AGR (%), CAGR (%))
Table 31 Fill Finish Manufacturing Market by Region, 2023-2033 (US$ Mn, AGR (%), CAGR (%))
Table 32 North America Fill Finish Manufacturing Market by Product, 2023-2033 (US$ Mn, AGR (%), CAGR (%))
Table 33 North America Fill Finish Manufacturing Market by Instruments, 2023-2033 (US$ Mn, AGR (%), CAGR (%))
Table 34 North America Fill Finish Manufacturing Instrument Market by System Type, 2023-2033 (US$ Mn, AGR (%), CAGR (%))
Table 35 North America Fill Finish Manufacturing Instrument Market by Machine Type, 2023-2033 (US$ Mn, AGR (%), CAGR (%))
Table 36 North America Fill Finish Manufacturing Market by End-User, 2023-2033 (US$ Mn, AGR (%), CAGR (%))
Table 37 North America Fill Finish Manufacturing Market by Consumables, 2023-2033 (US$ Mn, AGR (%), CAGR (%))
Table 38 North America Fill Finish Manufacturing Market by Country, 2023-2033 (US$ Mn, AGR (%), CAGR (%))
Table 39 U.S. Fill Finish Manufacturing Market by Value, 2023-2033 (US$ Mn, AGR (%), CAGR (%))
Table 40 Canada Fill Finish Manufacturing Market by Value, 2023-2033 (US$ Mn, AGR (%), CAGR (%))
Table 41 Europe Fill Finish Manufacturing Market by Product, 2023-2033 (US$ Mn, AGR (%), CAGR (%))
Table 42 Europe Fill Finish Manufacturing Market by Instruments, 2023-2033 (US$ Mn, AGR (%), CAGR (%))
Table 43 Europe Fill Finish Manufacturing Instrument Market by System Type, 2023-2033 (US$ Mn, AGR (%), CAGR (%))
Table 44 Europe Fill Finish Manufacturing Instrument Market by Machine Type, 2023-2033 (US$ Mn, AGR (%), CAGR (%))
Table 45 Europe Fill Finish Manufacturing Market by End-User, 2023-2033 (US$ Mn, AGR (%), CAGR (%))
Table 46 Europe Fill Finish Manufacturing Market by Consumables, 2023-2033 (US$ Mn, AGR (%), CAGR (%))
Table 47 Europe Fill Finish Manufacturing Market by Country, 2023-2033 (US$ Mn, AGR (%), CAGR (%))
Table 48 Germany Fill Finish Manufacturing Market by Value, 2023-2033 (US$ Mn, AGR (%), CAGR (%))
Table 49 UK Fill Finish Manufacturing Market by Value, 2023-2033 (US$ Mn, AGR (%), CAGR (%))
Table 50 France Fill Finish Manufacturing Market by Value, 2023-2033 (US$ Mn, AGR (%), CAGR (%))
Table 51 Italy Fill Finish Manufacturing Market by Value, 2023-2033 (US$ Mn, AGR (%), CAGR (%))
Table 52 Spain Fill Finish Manufacturing Market by Value, 2023-2033 (US$ Mn, AGR (%), CAGR (%))
Table 53 Rest of Europe Fill Finish Manufacturing Market by Value, 2023-2033 (US$ Mn, AGR (%), CAGR (%))
Table 54 Asia-Pacific Fill Finish Manufacturing Market by Product, 2023-2033 (US$ Mn, AGR (%), CAGR (%))
Table 55 Asia-Pacific Fill Finish Manufacturing Market by Instruments, 2023-2033 (US$ Mn, AGR (%), CAGR (%))
Table 56 Asia-Pacific Fill Finish Manufacturing Instrument Market by System Type, 2023-2033 (US$ Mn, AGR (%), CAGR (%))
Table 57 Asia-Pacific Fill Finish Manufacturing Instrument Market by Machine Type, 2023-2033 (US$ Mn, AGR (%), CAGR (%))
Table 58 Asia-Pacific Fill Finish Manufacturing Market by End-User, 2023-2033 (US$ Mn, AGR (%), CAGR (%))
Table 59 Asia-Pacific Fill Finish Manufacturing Market by Consumables, 2023-2033 (US$ Mn, AGR (%), CAGR (%))
Table 60 Asia-Pacific Fill Finish Manufacturing Market by Country, 2023-2033 (US$ Mn, AGR (%), CAGR (%))
Table 61 China Fill Finish Manufacturing Market by Value, 2023-2033 (US$ Mn, AGR (%), CAGR (%))
Table 62 India Fill Finish Manufacturing Market by Value, 2023-2033 (US$ Mn, AGR (%), CAGR (%))
Table 63 Japan Fill Finish Manufacturing Market by Value, 2023-2033 (US$ Mn, AGR (%), CAGR (%))
Table 64 South Korea Fill Finish Manufacturing Market by Value, 2023-2033 (US$ Mn, AGR (%), CAGR (%))
Table 65 Australia Fill Finish Manufacturing Market by Value, 2023-2033 (US$ Mn, AGR (%), CAGR (%))
Table 66 Rest of Asia-Pacific Fill Finish Manufacturing Market by Value, 2023-2033 (US$ Mn, AGR (%), CAGR (%))
Table 67 Latin America Fill Finish Manufacturing Market by Product, 2023-2033 (US$ Mn, AGR (%), CAGR (%))
Table 68 Latin America Fill Finish Manufacturing Market by Instruments, 2023-2033 (US$ Mn, AGR (%), CAGR (%))
Table 69 Latin America Fill Finish Manufacturing Instrument Market by System Type, 2023-2033 (US$ Mn, AGR (%), CAGR (%))
Table 70 Latin America Fill Finish Manufacturing Instrument Market by Machine Type, 2023-2033 (US$ Mn, AGR (%), CAGR (%))
Table 71 Latin America Fill Finish Manufacturing Market by End-User, 2023-2033 (US$ Mn, AGR (%), CAGR (%))
Table 72 Latin America Fill Finish Manufacturing Market by Consumables, 2023-2033 (US$ Mn, AGR (%), CAGR (%))
Table 73 Latin America Fill Finish Manufacturing Market by Country, 2023-2033 (US$ Mn, AGR (%), CAGR (%))
Table 74 Brazil Fill Finish Manufacturing Market by Value, 2023-2033 (US$ Mn, AGR (%), CAGR (%))
Table 75 Mexico Fill Finish Manufacturing Market by Value, 2023-2033 (US$ Mn, AGR (%), CAGR (%))
Table 76 Rest of Latin America Fill Finish Manufacturing Market by Value, 2023-2033 (US$ Mn, AGR (%), CAGR (%))
Table 77 Middle East & Africa Fill Finish Manufacturing Market by Product, 2023-2033 (US$ Mn, AGR (%), CAGR (%))
Table 78 Middle East & Africa Fill Finish Manufacturing Market by Instruments, 2023-2033 (US$ Mn, AGR (%), CAGR (%))
Table 79 Middle East & Africa Fill Finish Manufacturing Instrument Market by System Type, 2023-2033 (US$ Mn, AGR (%), CAGR (%))
Table 80 Middle East & Africa Fill Finish Manufacturing Instrument Market by Machine Type, 2023-2033 (US$ Mn, AGR (%), CAGR (%))
Table 81 Middle East & Africa Fill Finish Manufacturing Market by End-User, 2023-2033 (US$ Mn, AGR (%), CAGR (%))
Table 82 Middle East & Africa Fill Finish Manufacturing Market by Consumables, 2023-2033 (US$ Mn, AGR (%), CAGR (%))
Table 83 Middle East & Africa Fill Finish Manufacturing Market by Country, 2023-2033 (US$ Mn, AGR (%), CAGR (%))
Table 84 GCC Fill Finish Manufacturing Market by Value, 2023-2033 (US$ Mn, AGR (%), CAGR (%))
Table 85 South Africa Fill Finish Manufacturing Market by Value, 2023-2033 (US$ Mn, AGR (%), CAGR (%))
Table 86 Rest of Middle East & Africa Fill Finish Manufacturing Market by Value, 2023-2033 (US$ Mn, AGR (%), CAGR (%))
Table 87 BD: Key Details, (CEO, HQ, Revenue, Founded, No. of Employees, Company Type, Website, Business Segment)
Table 88 BD: Product Benchmarking
Table 89 BD: Strategic Outlook
Table 90 Nipro Corporation: Key Details, (CEO, HQ, Revenue, Founded, No. of Employees, Company Type, Website, Business Segment)
Table 91 Nipro Corporation: Product Benchmarking
Table 92 Nipro Corporation: Strategic Outlook
Table 93 Stevanato Group SpA: Key Details, (CEO, HQ, Revenue, Founded, No. of Employees, Company Type, Website, Business Segment)
Table 94 Stevanato Group SpA: Product Benchmarking
Table 95 Stevanato Group SpA: Strategic Outlook
Table 96 West Pharmaceutical Services, Inc: Key Details, (CEO, HQ, Revenue, Founded, No. of Employees, Company Type, Website, Business Segment)
Table 97 West Pharmaceutical Services, Inc: Product Benchmarking
Table 98 West Pharmaceutical Services, Inc: Strategic Outlook
Table 99 Bausch+Ströbe: Key Details, (CEO, HQ, Revenue, Founded, No. of Employees, Company Type, Website, Business Segment)
Table 100 Bausch+Ströbe: Product Benchmarking
Table 101 Gerresheimer AG: Key Details, (CEO, HQ, Revenue, Founded, No. of Employees, Company Type, Website, Business Segment)
Table 102 Gerresheimer AG: Product Benchmarking
Table 103 Gerresheimer AG: Strategic Outlook
Table 104 Vanrx Pharmasystems Inc: Key Details, (CEO, HQ, Revenue, Founded, No. of Employees, Company Type, Website, Business Segment)
Table 105 Vanrx Pharmasystems Inc: Product Benchmarking
Table 106 Groninger& Co. GmbH: Key Details, (CEO, HQ, Revenue, Founded, No. of Employees, Company Type, Website, Business Segment)
Table 107 Groninger& Co. GmbH: Product Benchmarking
Table 108 Syntegon Technology: Key Details, (CEO, HQ, Revenue, Founded, No. of Employees, Company Type, Website, Business Segment)
Table 109 Syntegon Technology: Product Benchmarking
Table 110 Syntegon Technology: Strategic Outlook
Table 111 OPTIMA packaging group GmbH: Key Details, (CEO, HQ, Revenue, Founded, No. of Employees, Company Type, Website, Business Segment)
Table 112 OPTIMA packaging group GmbH: Product Benchmarking
Table 113 Schott AG: Key Details, (CEO, HQ, Revenue, Founded, No. of Employees, Company Type, Website, Business Segment)
Table 114 Schott AG: Product Benchmarking
Table 115 Schott AG: Strategic Outlook
Table 116 Aseptic Technologies: Key Details, (CEO, HQ, Revenue, Founded, No. of Employees, Company Type, Website, Business Segment)
Table 117 Aseptic Technologies: Product Benchmarking
Table 118 Marchesini Group S.P.A.: Key Details, (CEO, HQ, Revenue, Founded, No. of Employees, Company Type, Website, Business Segment)
Table 119 Marchesini Group S.P.A.: Product Benchmarking
Table 120 Marchesini Group S.P.A.: Strategic Outlook
Table 121 Steriline: Key Details, (CEO, HQ, Revenue, Founded, No. of Employees, Company Type, Website, Business Segment)
Table 122 Steriline: Product Benchmarking
Table 123 I.M.A. Industria Macchine Automatiche S.P.A: Key Details, (CEO, HQ, Revenue, Founded, No. of Employees, Company Type, Website, Business Segment)
Table 124 I.M.A. Industria Macchine Automatiche S.P.A: Product Benchmarking
List of Figures
Figure 1 Fill Finish Manufacturing Market Segmentation
Figure 2 Global Fill Finish Manufacturing Market Forecast by Region: Market Attractiveness Index
Figure 3 Fill Finish Manufacturing Market by System Type: Market Attractiveness Index
Figure 4 Fill Finish Manufacturing Market by Machine Type: Market Attractiveness Index
Figure 5 Global Fill Finish Manufacturing Market by End-users: Market Attractiveness Index
Figure 6 Global Fill Finish Manufacturing Market by Consumables: Market Attractiveness Index
Figure 7 Fill Finish Manufacturing Market: Market Dynamics
Figure 8 Fill Finish Manufacturing Market by Region, 2023-2033 (US$ Mn, AGR (%)) (V-Shaped Recovery Scenario)
Figure 9 Fill Finish Manufacturing Market by Region, 2023-2033 (US$ Mn, AGR (%)) (W-Shaped Recovery Scenario)
Figure 10 Fill Finish Manufacturing Market by Region, 2023-2033 (US$ Mn, AGR (%)) (U-Shaped Recovery Scenario)
Figure 11 Fill Finish Manufacturing Market by Region, 2023-2033 (US$ Mn, AGR (%)) (L-Shaped Recovery Scenario)
Figure 12 Fill Finish Manufacturing Market: Porter’s Five Forces Analysis
Figure 13 Fill Finish Manufacturing Market: PESTLE Analysis
Figure 14 Fill Finish Manufacturing Market by Product: Market Attractiveness Index
Figure 15 Global Fill Finish Manufacturing Market Share by Product, 2023 & 2033 (%)
Figure 16 Fill Finish Manufacturing Market by Product, 2023-2033 (US$ Mn, AGR (%))
Figure 17 Instruments Market by Region, 2023-2033 (US$ Mn, AGR (%))
Figure 18 Instruments Market Share Forecast by Region, 2023 & 2033 (%)
Figure 19 Consumables Market by Region, 2023-2033 (US$ Mn, AGR (%))
Figure 20 Consumables Market Share Forecast by Region, 2023 & 2033 (%)
Figure 21 Fill Finish Manufacturing Market by Instrument: Market Attractiveness Index
Figure 1 Instrument Market by Type, 2023 & 2033 (Market Share (%))
Figure 2 Instruments Market by Type, 2023-2033 (US$ Mn, AGR (%))
Figure 3 System Type Market by Region, 2023-2033 (US$ Mn, AGR (%))
Figure 4 System Type Market Share Forecast by Region, 2023 & 2033 (%)
Figure 5 Machine Type Market by Region, 2023-2033 (US$ Mn, AGR (%))
Figure 6 Machine Type Market Share Forecast by Region, 2023 & 2033 (%)
Figure 22 Fill Finish Manufacturing Market by System Type: Market Attractiveness Index
Figure 7 Instrument Market Share by System Type, 2023 & 2033 (%)
Figure 8 System Type Market Forecast by Type, 2023-2033 (US$ Mn, AGR (%))
Figure 9 Integrated Systems Market by Region, 2023-2033 (US$ Mn, AGR (%))
Figure 10 Integrated Systems Market Share Forecast by Region, 2023 & 2033 (%)
Figure 11 Standalone Systems Market by Region, 2023-2033 (US$ Mn, AGR (%))
Figure 12 Standalone Systems Market Share Forecast by Region, 2023 & 2033 (%)
Figure 23 Fill Finish Manufacturing Market by Machine Type: Market Attractiveness Index
Figure 13 Instrument Market Share by Machine Type, 2023 & 2033 (%)
Figure 14 Global Fill Finish Manufacturing Instrument Market by Machine Type, 2023-2033 (US$ Mn, AGR (%))
Figure 15 Automated Machines Market by Region, 2023-2033 (US$ Mn, AGR (%))
Figure 16 Automated Machines Market Share Forecast by Region, 2023 & 2033 (%)
Figure 17 Semi-Automated Machines Market by Region, 2023-2033 (US$ Mn, AGR (%))
Figure 18 Semi-Automated Market Share Forecast by Region, 2023 & 2033 (%)
Figure 19 Manual Machines Market by Region, 2023-2033 (US$ Mn, AGR (%))
Figure 20 Manual Machines Market Share Forecast by Region, 2023 & 2033 (%)
Figure 24 Fill Finish Manufacturing Market by End-Users Market Attractiveness Index
Figure 21 Global Fill Finish Manufacturing Instrument Market Share by End Users, 2023 & 2033 (%)
Figure 22 Fill Finish Manufacturing Market by End-User, 2023-2033 (US$ Mn, AGR (%))
Figure 23 Contract Manufacturing Organizations (CMOs) Market by Region, 2023-2033 (US$ Mn, AGR (%))
Figure 24 Contract Manufacturing Organizations Market Share Forecast by Region, 2023 & 2033 (%)
Figure 25 Pharmaceutical Companies Market by Region, 2023-2033 (US$ Mn, AGR (%))
Figure 26 Pharmaceutical Companies Market Share Forecast by Region, 2023 & 2033 (%)
Figure 27 Biopharmaceutical Companies Market by Region, 2023-2033 (US$ Mn, AGR (%))
Figure 28 Biopharmaceutical Companies Market Share Forecast by Region, 2023 & 2033 (%)
Figure 29 Other End-users Market by Region, 2023-2033 (US$ Mn, AGR (%))
Figure 30 Other End-users Market Share Forecast by Region, 2023 & 2033 (%)
Figure 25 Fill Finish Manufacturing Market by Consumables Market Attractiveness Index
Figure 31 Consumables Market Share, 2023 & 2033 (%)
Figure 32 Fill Finish Manufacturing Market by Consumables, 2023-2033 (US$ Mn, AGR (%))
Figure 33 Global Prefilled Syringes Market by Region, 2023-2033 (US$ Mn, AGR (%))
Figure 34 Prefilled Syringes Market Share Forecast by Region, 2023 & 2033 (%)
Figure 35 Prefilled Vials Market by Region, 2023-2033 (US$ Mn, AGR (%))
Figure 36 Prefilled Vials Market Share Forecast by Region, 2023 & 2033 (%)
Figure 37 Prefilled Cartridges Market by Region, 2023-2033 (US$ Mn, AGR (%))
Figure 38 Prefilled Cartridges Market Share Forecast by Region, 2023 & 2033 (%)
Figure 39 Prefilled Packaging Market by Region, 2023-2033 (US$ Mn, AGR (%))
Figure 40 Prefilled Packaging Market Share Forecast by Region, 2023 & 2033 (%)
Figure 41 Other Consumables Market by Region, 2023-2033 (US$ Mn, AGR (%))
Figure 42 Other Consumable Market Share Forecast by Region, 2023 & 2033 (%)
Figure 43 Fill Finish Manufacturing Market Forecast by Region 2023, 2027, 2033 (Market Share %)
Figure 44 Fill Finish Manufacturing Market by Region, 2023-2033 (US$ Mn, AGR (%))
Figure 45 North America Fill Finish Manufacturing Market Attractiveness Index
Figure 46 North America Fill Finish Manufacturing Market by Product, 2023-2033 (US$ Mn, AGR (%))
Figure 47 North America Fill Finish Manufacturing Market Share Forecast by Product, 2023 & 2033 (%)
Figure 48 North America Fill Finish Manufacturing Market by Instruments, 2023-2033 (US$ Mn, AGR (%))
Figure 49 North America Fill Finish Manufacturing Market Share Forecast by Instruments, 2023 & 2033 (%)
Figure 50 North America Fill Finish Manufacturing Instrument Market by System Type, 2023-2033 (US$ Mn, AGR (%))
Figure 51 North America Fill Finish Manufacturing Market Share Forecast by System Type, 2023 & 2033 (%)
Figure 52 North America Fill Finish Manufacturing Instrument Market by Machine Type, 2023-2033 (US$ Mn, AGR (%))
Figure 53 North America Fill Finish Manufacturing Market Share Forecast by Machine Type, 2023 & 2033 (%)
Figure 54 North America Fill Finish Manufacturing Market by End-User, 2023-2033 (US$ Mn, AGR (%))
Figure 55 North America Fill Finish Manufacturing Market Share Forecast by End User, 2023 & 2033 (%)
Figure 56 North America Fill Finish Manufacturing Market by Consumables, 2023-2033 (US$ Mn, AGR (%))
Figure 57 North America Fill Finish Manufacturing Market Share Forecast by Consumables, 2023 & 2033 (%)
Figure 58 North America Fill Finish Manufacturing Market by Country, 2023-2033 (US$ Mn, AGR (%))
Figure 59 North America Fill Finish Manufacturing Market Share Forecast by Country, 2023 & 2033 (%)
Figure 60 U.S. Fill Finish Manufacturing Market by Value, 2023-2033 (US$ Mn, AGR (%))
Figure 61 Canada Fill Finish Manufacturing Market by Value, 2023-2033 (US$ Mn, AGR (%))
Figure 62 Europe Fill Finish Manufacturing Market Attractiveness Index
Figure 63 Europe Fill Finish Manufacturing Market by Product, 2023-2033 (US$ Mn, AGR (%))
Figure 64 Europe Fill Finish Manufacturing Market Share Forecast by Product, 2023 & 2033 (%)
Figure 65 Europe Fill Finish Manufacturing Market by Instruments, 2023-2033 (US$ Mn, AGR (%))
Figure 66 Europe Fill Finish Manufacturing Market Share Forecast by Instruments, 2023 & 2033 (%)
Figure 67 Europe Fill Finish Manufacturing Instrument Market by System Type, 2023-2033 (US$ Mn, AGR (%))
Figure 68 Europe Fill Finish Manufacturing Market Share Forecast by System Type, 2023 & 2033 (%)
Figure 69 Europe Fill Finish Manufacturing Instrument Market by Machine Type, 2023-2033 (US$ Mn, AGR (%))
Figure 70 Europe Fill Finish Manufacturing Market Share Forecast by Machine Type, 2023 & 2033 (%)
Figure 71 Europe Fill Finish Manufacturing Market by End-User, 2023-2033 (US$ Mn, AGR (%))
Figure 72 Europe Fill Finish Manufacturing Market Share Forecast by End User, 2023 & 2033 (%)
Figure 73 Europe Fill Finish Manufacturing Market by Consumables, 2023-2033 (US$ Mn, AGR (%))
Figure 74 Europe Fill Finish Manufacturing Market Share Forecast by Consumables, 2023 & 2033 (%)
Figure 75 Europe Fill Finish Manufacturing Market by Country, 2023-2033 (US$ Mn, AGR (%))
Figure 76 Europe Fill Finish Manufacturing Market Share Forecast by Country, 2023 & 2033 (%)
Figure 77 Germany Fill Finish Manufacturing Market by Value, 2023-2033 (US$ Mn, AGR (%))
Figure 78 UK Fill Finish Manufacturing Market by Value, 2023-2033 (US$ Mn, AGR (%))
Figure 79 France Fill Finish Manufacturing Market by Value, 2023-2033 (US$ Mn, AGR (%))
Figure 80 Italy Fill Finish Manufacturing Market by Value, 2023-2033 (US$ Mn, AGR (%))
Figure 81 Spain Fill Finish Manufacturing Market by Value, 2023-2033 (US$ Mn, AGR (%))
Figure 82 Rest of Europe Fill Finish Manufacturing Market by Value, 2023-2033 (US$ Mn, AGR (%))
Figure 83 Asia Fill Finish Manufacturing Market Attractiveness Index
Figure 84 Asia-Pacific Fill Finish Manufacturing Market by Product, 2023-2033 (US$ Mn, AGR (%))
Figure 85 Asia Pacific Fill Finish Manufacturing Market Share Forecast by Product, 2023 & 2033 (%)
Figure 86 Asia-Pacific Fill Finish Manufacturing Market by Instruments, 2023-2033 (US$ Mn, AGR (%))
Figure 87 Asia Pacific Fill Finish Manufacturing Market Share Forecast by Instruments, 2023 & 2033 (%)
Figure 88 Asia-Pacific Fill Finish Manufacturing Instrument Market by System Type, 2023-2033 (US$ Mn, AGR (%))
Figure 89 Asia Pacific Fill Finish Manufacturing Market Share Forecast by System Type, 2023 & 2033 (%)
Figure 90 Asia-Pacific Fill Finish Manufacturing Instrument Market by Machine Type, 2023-2033 (US$ Mn, AGR (%))
Figure 91 Asia Pacific Fill Finish Manufacturing Market Share Forecast by Machine Type, 2023 & 2033 (%)
Figure 92 Asia-Pacific Fill Finish Manufacturing Market by End-User, 2023-2033 (US$ Mn, AGR (%))
Figure 93 Asia Pacific Fill Finish Manufacturing Market Share Forecast by End User, 2023 & 2033 (%)
Figure 94 Asia-Pacific Fill Finish Manufacturing Market by Consumables, 2023-2033 (US$ Mn, AGR (%))
Figure 95 Asia Pacific Fill Finish Manufacturing Market Share Forecast by Consumables, 2023 & 2033 (%)
Figure 96 Asia-Pacific Fill Finish Manufacturing Market by Country, 2023-2033 (US$ Mn, AGR (%))
Figure 97 Asia Pacific Fill Finish Manufacturing Market Share Forecast by Country, 2023 & 2033 (%)
Figure 98 China Fill Finish Manufacturing Market by Value, 2023-2033 (US$ Mn, AGR (%))
Figure 99 India Fill Finish Manufacturing Market by Value, 2023-2033 (US$ Mn, AGR (%))
Figure 100 Japan Fill Finish Manufacturing Market by Value, 2023-2033 (US$ Mn, AGR (%))
Figure 101 South Korea Fill Finish Manufacturing Market by Value, 2023-2033 (US$ Mn, AGR (%))
Figure 102 Australia Fill Finish Manufacturing Market by Value, 2023-2033 (US$ Mn, AGR (%))
Figure 103 Rest of Asia-Pacific Fill Finish Manufacturing Market by Value, 2023-2033 (US$ Mn, AGR (%))
Figure 104 Latin America Fill Finish Manufacturing Market Attractiveness Index
Figure 105 Latin America Fill Finish Manufacturing Market by Product, 2023-2033 (US$ Mn, AGR (%))
Figure 106 Latin America Fill Finish Manufacturing Market Share Forecast by Product, 2023 & 2033 (%)
Figure 107 Latin America Fill Finish Manufacturing Market by Instruments, 2023-2033 (US$ Mn, AGR (%))
Figure 108 Latin America Fill Finish Manufacturing Market Share Forecast by Instruments, 2023 & 2033 (%)
Figure 109 Latin America Fill Finish Manufacturing Instrument Market by System Type, 2023-2033 (US$ Mn, AGR (%))
Figure 110 Latin America Fill Finish Manufacturing Market Share Forecast by Systems Type, 2023 & 2033 (%)
Figure 111 Latin America Fill Finish Manufacturing Instrument Market by Machine Type, 2023-2033 (US$ Mn, AGR (%))
Figure 112 Latin America Fill Finish Manufacturing Market Share Forecast by Machine Type, 2023 & 2033 (%)
Figure 113 Latin America Fill Finish Manufacturing Market by End-User, 2023-2033 (US$ Mn, AGR (%))
Figure 114 Latin America Fill Finish Manufacturing Market Share Forecast by End User, 2023 & 2033 (%)
Figure 115 Latin America Fill Finish Manufacturing Market by Consumables, 2023-2033 (US$ Mn, AGR (%))
Figure 116 Latin America Fill Finish Manufacturing Market Share Forecast by Consumables, 2023 & 2033 (%)
Figure 117 Latin America Fill Finish Manufacturing Market by Country, 2023-2033 (US$ Mn, AGR (%))
Figure 118 Latin America Fill Finish Manufacturing Market Share Forecast by Country, 2023 & 2033 (%)
Figure 119 Brazil Fill Finish Manufacturing Market by Value, 2023-2033 (US$ Mn, AGR (%))
Figure 120 Mexico Fill Finish Manufacturing Market by Value, 2023-2033 (US$ Mn, AGR (%))
Figure 121 Rest of Latin America Fill Finish Manufacturing Market by Value, 2023-2033 (US$ Mn, AGR (%))
Figure 122 Middle East & Africa Fill Finish Manufacturing Market Attractiveness Index
Figure 123 Middle East & Africa Fill Finish Manufacturing Market by Product, 2023-2033 (US$ Mn, AGR (%))
Figure 124 Middle East & Africa Fill Finish Manufacturing Market Share Forecast by Product, 2023 & 2033 (%)
Figure 125 Middle East & Africa Fill Finish Manufacturing Market by Instruments, 2023-2033 (US$ Mn, AGR (%))
Figure 126 Middle East & Africa Fill Finish Manufacturing Market Share Forecast by Instruments, 2023 & 2033 (%)
Figure 127 Middle East & Africa Fill Finish Manufacturing Instrument Market by System Type, 2023-2033 (US$ Mn, AGR (%))
Figure 128 Middle East & Africa Fill Finish Manufacturing Market Share Forecast by System Type, 2023 & 2033 (%)
Figure 129 Middle East & Africa Fill Finish Manufacturing Instrument Market by Machine Type, 2023-2033 (US$ Mn, AGR (%))
Figure 130 Middle East & Africa Fill Finish Manufacturing Market Share Forecast by Machine Type, 2023 & 2033 (%)
Figure 131 Middle East & Africa Fill Finish Manufacturing Market by End-User, 2023-2033 (US$ Mn, AGR (%))
Figure 132 Middle East & Africa Fill Finish Manufacturing Market Share Forecast by End User, 2023 & 2033 (%)
Figure 133 Middle East & Africa Fill Finish Manufacturing Market by Consumables, 2023-2033 (US$ Mn, AGR (%))
Figure 134 Middle East & Africa Fill Finish Manufacturing Market Share Forecast by Consumables, 2023 & 2033 (%)
Figure 135 Middle East & Africa Fill Finish Manufacturing Market by Country, 2023-2033 (US$ Mn, AGR (%))
Figure 136 Middle East & Africa Fill Finish Manufacturing Market Share Forecast by Country, 2023 & 2033 (%)
Figure 137 GCC Fill Finish Manufacturing Market by Value, 2023-2033 (US$ Mn, AGR (%))
Figure 138 South Africa Fill Finish Manufacturing Market by Value, 2023-2033 (US$ Mn, AGR (%))
Figure 139 Rest of Middle East & Africa Fill Finish Manufacturing Market by Value, 2023-2033 (US$ Mn, AGR (%))
Figure 140 Fill Finish Manufacturing Market: Company Share/Ranking, 2022
Figure 141 BD: Net Revenue, 2017-2021 (US$ million, AGR%)
Figure 142 BD: Gross Profit, 2017-2021 (US$ million, AGR%)
Figure 143 BD: R&D, 2017-2021 (US$ million, AGR%)
Figure 144 BD: Geographical Share, 2021 (%)
Figure 145 Nipro Corporation: Net Revenue, 2017-2021 (US$ million, AGR%)
Figure 146 Nipro Corporation: Gross Profit, 2017-2021 (US$ million, AGR%)
Figure 147 Nipro Corporation: R&D, 2017-2021 (US$ million, AGR%)
Figure 148 Nipro Corporation: Geographical Share, 2021 (%)
Figure 149 West Pharmaceutical Services, Inc: Net Revenue, 2017-2021 (US$ million, AGR%)
Figure 150 West Pharmaceutical Services, Inc: Gross Profit, 2017-2021 (US$ million, AGR%)
Figure 151 West Pharmaceutical Services, Inc: R&D, 2017-2021 (US$ million, AGR%)
Figure 152 West Pharmaceutical Services, Inc.: Geographical Share, 2021 (%)
Figure 153 Gerresheimer AG: Net Revenue, 2017-2021 (US$ million, AGR%)
Figure 154 Gerresheimer AG.: Geographical Share, 2021 (%)
Figure 155 I.M.A. Industria Macchine Automatiche S.P.A: Net Revenue, 2017-2021 (US$ million, AGR%)
Figure 156 I.M.A. Industria Macchine Automatiche S.P.A: Gross Profit, 2017-2021 (US$ million, AGR%)
Figure 157 I.M.A. Industria Macchine Automatiche S.P.A: R&D, 2017-2021 (US$ million, AGR%)
Figure 158 I.M.A. Industria Macchine Automatiche S.P.A.: Geographical Share, 2021 (%)
ページTOPに戻る
Visiongain社のヘルスケアと医薬・化学品分野での最新刊レポート
本レポートと同じKEY WORD()の最新刊レポート
- 本レポートと同じKEY WORDの最新刊レポートはありません。
よくあるご質問
Visiongain社はどのような調査会社ですか?
英国の調査会社ヴィジョンゲイン社(Visiongain)は、通信とエネルギーのほか、自動車や化学・医薬品、金属など、広範な市場を対象に調査を行っています。自動車市場については、市場全般に関する調査のほ... もっと見る
調査レポートの納品までの日数はどの程度ですか?
在庫のあるものは速納となりますが、平均的には 3-4日と見て下さい。
但し、一部の調査レポートでは、発注を受けた段階で内容更新をして納品をする場合もあります。
発注をする前のお問合せをお願いします。
注文の手続きはどのようになっていますか?
1)お客様からの御問い合わせをいただきます。
2)見積書やサンプルの提示をいたします。
3)お客様指定、もしくは弊社の発注書をメール添付にて発送してください。
4)データリソース社からレポート発行元の調査会社へ納品手配します。
5) 調査会社からお客様へ納品されます。最近は、pdfにてのメール納品が大半です。
お支払方法の方法はどのようになっていますか?
納品と同時にデータリソース社よりお客様へ請求書(必要に応じて納品書も)を発送いたします。
お客様よりデータリソース社へ(通常は円払い)の御振り込みをお願いします。
請求書は、納品日の日付で発行しますので、翌月最終営業日までの当社指定口座への振込みをお願いします。振込み手数料は御社負担にてお願いします。
お客様の御支払い条件が60日以上の場合は御相談ください。
尚、初めてのお取引先や個人の場合、前払いをお願いすることもあります。ご了承のほど、お願いします。
データリソース社はどのような会社ですか?
当社は、世界各国の主要調査会社・レポート出版社と提携し、世界各国の市場調査レポートや技術動向レポートなどを日本国内の企業・公官庁及び教育研究機関に提供しております。
世界各国の「市場・技術・法規制などの」実情を調査・収集される時には、データリソース社にご相談ください。
お客様の御要望にあったデータや情報を抽出する為のレポート紹介や調査のアドバイスも致します。
|
|

