臨床試験用品市場レポート:2023-2033
Clinical Trial Supplies Market Report 2023-2033
レポート詳細
臨床試験用品市場レポート 2023-2033 :本レポートは、新たな収益の柱を目指すリーディングカンパニーが、業界とその背景にあるダイナミクスをより深く理解する上で、非常に有益なものと... もっと見る
※上記価格は部署ライセンス(Departmental licence)価格です。
その他の価格についてはデータリソースまでお問合せください。
日本語のページは自動翻訳を利用し作成しています。
実際のレポートは英文のみでご納品いたします。

|

|
サマリー
レポート詳細
臨床試験用品市場レポート 2023-2033:本レポートは、新たな収益の柱を目指すリーディングカンパニーが、業界とその背景にあるダイナミクスをより深く理解する上で、非常に有益なものとなるでしょう。また、異業種への進出や新地域での既存事業の拡大を目指す企業にとっても有用なレポートです。
臨床試験アウトソーシングの需要増が臨床試験用品市場の需要増を牽引
大手・中堅製薬企業が治験をアウトソーシングする要因として、ダウンサイジングやコスト削減が重要視されています。CROは、規制プロセスや業務ノウハウの経験がない市場において特定の治療法に関する専門知識を持ち、業務量が増加した際にマンパワーを他の業務に活用することができるからです。さらに、臨床試験のプロセスの複雑化とコストの増加により、製薬メーカーはコストと時間を削減するために、臨床試験用品を外注し、研究施設に供給することを余儀なくされています。臨床供給企業は、臨床試験中の臨床消耗品の強固なサプライチェーン構築を支援するため、データ共有に注力しています。この要因は、予測期間を通じて臨床試験用品市場の収益成長に好影響を与えると思われます。
複数の国で保管施設を利用できないことが、拡大する臨床試験用品市場の妨げになる可能性があります。
臨床材料によっては、特定の気候条件下で保管する必要があり、臨床試験を実施するためには、このような設備が不可欠となります。しかし、メキシコやブラジルなどの国では、臨床材料保管施設やインフラが整っていないため、治験薬供給サービスが市場に受け入れられる妨げになる可能性があります。例えば、コールドチェーンの重要な構成要素が物を保管する場合、温度管理された施設に保管しなければならないかどうかを早期に判断することが重要である。冷蔵倉庫から臨床現場への臨床材料の輸送は困難であり、このことがこの市場の収益成長をある程度制限すると予測されます。
マーケットリサーチレポートを購入する前に、どのような質問をすべきでしょうか?
- 臨床試験用品市場はどのように進化しているのか?
- 臨床試験用品市場の推進要因と抑制要因は何か?
- 各臨床試験用品サブマーケットセグメントは予測期間中にどのように成長し、これらのサブマーケットが2033年に占める収益はどの程度になるのでしょうか?
- 2023年から2033年にかけて、各臨床試験用品サブマーケットの市場シェアはどのように推移するのか?
- 2023年から2033年にかけて、市場全体の主な推進力は何になるのでしょうか?
- 主要な臨床試験用品市場はマクロ経済のダイナミクスに広く追随するのか、それとも個々の国内市場が他を凌駕するのか?
- 2033年までに国内市場のシェアはどのように変化し、どの地域が2033年の市場をリードするのか?
- 主要プレイヤーは誰か、また予測期間中の見通しは?
- これらのリーディング企業の臨床試験用品プロジェクトはどのようなものですか?
- 2023年から2033年の間に、業界はどのように進化するのか?現在および今後10年間に実施される臨床試験用品プロジェクトにはどのような意味があるのか?
- 臨床試験用品市場の規模をさらに拡大するために、製品の商業化の必要性が高まっているのか?
- 臨床試験用品市場はどこへ向かい、どのようにすれば市場の最前線に立つことができるのか?
- 新製品やサービスラインに対する最適な投資オプションは何か?
- 企業を新たな成長軌道に乗せ、C-suiteに移行させるための重要な展望とは?
このことが、現在、そして今後10年間の治験薬市場にどのような影響を与えるかを見極める必要があります。
- 423ページにわたる本レポートでは、187の表と272のグラフを独占的に提供します。
- このレポートでは、業界における主要な収益性の高い分野をハイライトしているため、今すぐその分野をターゲットにすることができます。
- 世界、地域、国別の売上高と成長率を詳細に分析しています。
- 競合他社が成功した主要なトレンド、変化、収益予測をハイライトしています。
本レポートは、臨床試験用品市場が今後10年間にどのように発展し、COVID-19の景気後退と回復の変動に伴ってどのように変化するかを教えてくれます。この市場は、過去10年間のどの時点よりも今が重要なのです。
2033年までの予測やその他の分析により、商業的な展望が見えてきた
- 2033年までの収益予測に加え、直近の実績、成長率、市場シェアもご覧いただけます。
- ビジネスの展望や展開など、独自の分析もご覧いただけます。
- 定性的分析(市場力学、促進要因、機会、阻害要因、課題など)、コスト構造、臨床試験供給品価格上昇の影響、最近の動向などをご覧いただけます。
本レポートでは、COVID-19が業界と貴社にどのような影響を与えるかについて、データ分析と貴重な洞察を掲載しています。本レポートでは、COVID-19の4つの回収パターンとその影響、すなわち「V」、「L」、「W」、「U」について論じています。
報告書の対象セグメント
所在地
- オフショア臨床サイト
- 国内臨床サイト
タイプ
- 低分子製品
- 生物学的製剤
- 医療機器
サービス
・ 製造
- IMPおよびIND
- プラセボ
- アッセイ・テストキット
- その他
・ 物流・配送
- コールドチェーン
- 非コールドチェーン
・ 保管・貯蔵
・パッケージング・ラベリング
・ コンパレーターの調達
・ その他のCTSサービス
治療領域
- 腫瘍
- 中枢神経系および精神障害
- 心血管系疾患(CVD)
- 感染症
- 免疫疾患
- 血液疾患
- 代謝性疾患
- 消化器系疾患
- その他の治療領域
フェーズ
- フェーズI
- フェーズII
- フェーズIII
- フェーズIV
エンドユーザー
- 研究開発受託機関
- 製薬会社、バイオテクノロジー会社
- 医療機器メーカー
- その他のエンドユーザー
世界市場全体とセグメントの収益予測に加え、5つの地域と23の主要国市場の収益予測も掲載しています。
北米
- アメリカ
- カナダ
欧州
- ドイツ
- 英国
- フランス
- イタリア
- スペイン
- ロシア
- その他の欧州
アジア太平洋地域
- 中国
- インド
- 日本
- 韓国
- オーストラリア
- その他のアジア太平洋地域
ラテンアメリカ
- ブラジル
- メキシコ
- その他のラテンアメリカ地域
MEA
- 南アフリカ共和国
- サウジアラビア
- トルコ
- UAE
- その他のMEA
レポートには、臨床試験用品市場の主要企業のプロファイルと2023年から2033年までの、これらの企業のこのセグメントを中心とした情報も含まれています。
主要企業と市場成長の可能性
・ ADAllen Pharma
・ AmerisourceBergen Corporation
・ Ancillare
・ Biocair
・ Catalent, Inc.
・ Clinigen Group plc
・ Coghlan Group
・ COREX Logistics
・ DHL
・ Durbin
・ Endpoint Clinical
・ Eurofins Scientific SE
・ Inizio (UDG Healthcare plc)
・ IQVIA Inc.
・ KLIFO
・ Liveo Research
・ Lonza
・ Marken (A UPS Company)
・ Movianto
・ Myonex
・ N-SIDE
・ Parexel
・ PCI Pharma Services
・ Piramal Pharma Solutions
・ Recipharm AB
・ Rubicon Research Pvt S.A.
・ Seveillar Clinical Supplies Services
・ Sharp Corporation
・ SIRO Clinpharm
・ Thermo Fisher Scientific Inc.
臨床試験用品市場の世界全体の収益、2023年から2033年まで、金額ベースで2023年に28億1920万米ドルを突破すると、我々の仕事は計算しています。2033年まで力強い収益成長が予測されます。この調査では、最も大きな可能性を秘めた企業を特定しています。彼らの能力、進歩、商業的展望を知ることで、一歩先を行くことができます。
臨床試験用品市場、2023年から2033年までのレポートはどのようにあなたのお役に立ちますか?
420ページを超えるレポートでは、要約すると以下のような知識を得ることができます。
- 臨床試験用品市場の2023年から2033年までの収益予測。場所、タイプ、サービス、治療分野、フェーズ、エンドユーザー別に、それぞれ世界と地域レベルで予測 - 投資と収益に最も有利な場所を見つけ、業界の展望を見出すことができます。
- 5つの地域と19の主要国市場の2033年までの収益予測 - 臨床試験用品市場、2023年から2033年までの北米、ヨーロッパ、アジア太平洋、ラテンアメリカ、MEAの市場の予測をご覧ください。また、米国、カナダ、メキシコ、ブラジル、ドイツ、フランス、イギリス、イタリア、中国、インド、日本、オーストラリアなどの主要経済圏の市場も予測されています。
- 既存企業および市場参入を目指す企業の展望 - 臨床試験用品市場に関わる主要企業30社の企業プロファイルを含む、2023年から2033年までの市場。
定量的・定性的な分析と独自の予測をご覧いただけます。私たちのレポートだけが持つ情報を入手し、貴重なビジネスインテリジェンスを得ることができます。
他にはない情報
私たちの新しいレポートがあれば、知識の遅れを取り戻し、チャンスを逃す可能性が低くなります。私たちの研究が貴社の研究、分析、意思決定にどのように役立つかをご覧ください。Visiongainの研究は、臨床試験用品市場、2023年から2033年、市場をリードする企業のための商業分析を必要とするすべての人のためのものです。データ、トレンド、予測を見つけることができます。
ページTOPに戻る
目次
目次
1.レポートの概要
1.1 調査の目的
1.2 臨床試験用品市場の紹介
1.3 本レポートが提供するもの
1.4 本レポートを読むべき理由
1.5 本分析レポートが回答する主な疑問点
1.6 本レポートは誰のためのものなのか?
1.7 方法論
1.7.1 市場の定義
1.7.2 市場評価・予測手法
1.7.3 データの検証
1.7.3.1 一次調査
1.7.3.2 セカンダリーリサーチ
1.8 よくある質問(FAQ)
1.9 関連するVisiongainのレポート
1.10 Visiongainについて
2 エグゼクティブサマリー
3 市場概要
3.1 主要な調査結果
3.2 マーケットダイナミクス
3.2.1 市場の推進要因
3.2.1.1 治験のアウトソーシングに対する需要の増加
3.2.1.2 生物製剤の需要増加によるコールドチェーンサプライの成長促進
3.2.1.3 新薬開発への投資の増加
3.2.1.4 技術進歩が市場拡大を促進
3.2.2 市場の抑制要因
3.2.2.1 各国における保管施設の利用可能性
3.2.2.2 コンパレータの調達不足
3.2.2.3 医薬品開発に伴う高コスト
3.2.3 市場機会
3.2.3.1 新興国における市場機会の増加
3.2.3.2 高コストの削減が市場成長を促進する見込み
3.2.3.3 技術的ソリューションの統合
3.3 COVID-19影響度分析
3.4 PEST分析
3.4.1 政治的要因
3.4.2 経済的要因
3.4.3 社会的要因
3.4.4 技術的要因
4 臨床試験用品市場分析:所在地別
4.1 主な調査結果
4.2 所在地別セグメント市場魅力度指数
4.3 臨床試験用品の立地別市場規模の推定と予測
4.4 オフショア臨床サイト
4.4.1 地域別市場規模、2023年〜2033年 (US$ Mn)
4.4.2 地域別市場シェア、2023年&2033年(%)
4.5 国内臨床サイト
4.5.1 地域別市場規模、2023年~2033年 (US$ Mn)
4.5.2 地域別市場シェア、2023年&2033年(%)
5 臨床試験用品市場分析:タイプ別
5.1 主な調査結果
5.2 タイプ別セグメント市場魅力度指数
5.3 臨床試験用品のタイプ別市場規模の推定と予測
5.4 低分子製品
5.4.1 地域別市場規模、2023年〜2033年 (US$ Mn)
5.4.2 地域別市場シェア、2023年&2033年(%)
5.5 生物学的製剤
5.5.1 地域別市場規模、2023年~2033年 (US$ Mn)
5.5.2 地域別市場シェア、2023年&2033年(%)
5.6 医療機器
5.6.1 地域別市場規模、2023年~2033年 (US$ Mn)
5.6.2 地域別市場シェア、2023年&2033年(%)
6 臨床試験用品市場分析:サービス別
6.1 主な調査結果
6.2 サービスセグメント市場魅力度指数
6.3 サービス別臨床試験用品市場規模の推定と予測
6.4 製造業
6.4.1 地域別市場規模、2023年〜2033年 (US$ Mn)
6.4.2 地域別市場シェア、2023年&2033年(%)
6.4.3 IMPとIND
6.4.4 地域別市場規模、2023年~2033年 (US$ Mn)
6.4.5 地域別市場シェア、2023年&2033年(%)
6.4.6 プラセボ
6.4.7 地域別市場規模、2023年~2033年 (US$ Mn)
6.4.8 地域別市場シェア、2023年&2033年(%)
6.4.9 アッセイ・テストキット
6.4.10 地域別市場規模、2023年~2033年 (US$ Mn)
6.4.11 地域別市場シェア、2023年&2033年(%)
6.4.12 その他
6.4.13 地域別市場規模、2023年~2033年 (US$ Mn)
6.4.14 地域別市場シェア、2023年&2033年(%)
6.5 ロジスティクス&ディストリビューション
6.5.1 地域別市場規模、2023年~2033年 (US$ Mn)
6.5.2 地域別市場シェア、2023年&2033年(%)
6.5.3 コールドチェーン物流
6.5.4 地域別市場規模、2023年~2033年 (US$ Mn)
6.5.5 地域別市場シェア、2023年&2033年(%)
6.5.6 非コールドチェーン
6.5.7 地域別市場規模、2023年~2033年 (US$ Mn)
6.5.8 地域別市場シェア、2023年&2033年(%)
6.6 保管・保存
6.6.1 地域別市場規模、2023年~2033年 (US$ Mn)
6.6.2 地域別市場シェア、2023年&2033年(%)
6.7 パッケージング・ラベリング
6.7.1 地域別市場規模、2023年~2033年 (US$ Mn)
6.7.2 地域別市場シェア、2023年&2033年(%)
6.8 コンパレータソーシング
6.8.1 地域別市場規模、2023年~2033年 (US$ Mn)
6.8.2 地域別市場シェア、2023年&2033年(%)
6.9 その他のCTSサービス
6.9.1 地域別市場規模、2023年〜2033年 (US$ Mn)
6.9.2 地域別市場シェア、2023年&2033年(%)
7 臨床試験用品市場分析:治療分野別
7.1 主要な調査結果
7.2 治療分野セグメント市場魅力度指数
7.3 治療分野別の臨床試験用品市場規模の推定と予測
7.4 オンコロジー
7.4.1 地域別市場規模、2023年〜2033年 (US$ Mn)
7.4.2 地域別市場シェア、2023年&2033年(%)
7.5 中枢神経系及び精神障害
7.5.1 地域別市場規模、2023年~2033年 (US$ Mn)
7.5.2 地域別市場シェア、2023年&2033年(%)
7.6 心血管疾患(CVD)
7.6.1 地域別市場規模、2023年〜2033年 (US$ Mn)
7.6.2 地域別市場シェア、2023年&2033年(%)
7.7 感染症
7.7.1 地域別市場規模、2023年~2033年 (US$ Mn)
7.7.2 地域別市場シェア、2023年&2033年(%)
7.8 免疫系疾患
7.8.1 地域別市場規模、2023年~2033年 (US$ Mn)
7.8.2 地域別市場シェア、2023年&2033年(%)
7.9 血液疾患
7.9.1 地域別市場規模、2023年〜2033年 (US$ Mn)
7.9.2 地域別市場シェア、2023年&2033年(%)
7.10 代謝性疾患
7.10.1 地域別市場規模、2023年~2033年 (US$ Mn)
7.10.2 地域別市場シェア、2023年&2033年(%)
7.11 消化器系疾患
7.11.1 地域別市場規模、2023年〜2033年 (US$ Mn)
7.11.2 地域別市場シェア、2023年&2033年(%)
7.12 その他の治療領域
7.12.1 地域別市場規模、2023年~2033年 (US$ Mn)
7.12.2 地域別市場シェア、2023年&2033年(%)
8 臨床試験用品市場分析:フェーズ別
8.1 主な調査結果
8.2 フェーズセグメント市場魅力度指数
8.3 フェーズ別臨床試験用品市場規模推定・予測
8.4 フェーズI
8.4.1 地域別市場規模、2023年~2033年 (US$ Mn)
8.4.2 地域別市場シェア、2023年&2033年(%)
8.5 フェーズ-II
8.5.1 地域別市場規模、2023年~2033年 (US$ Mn)
8.5.2 地域別市場シェア、2023年&2033年(%)
8.6 フェーズIII
8.6.1 地域別市場規模、2023年~2033年 (US$ Mn)
8.6.2 地域別市場シェア、2023年&2033年(%)
8.7 Phase-IV
8.7.1 地域別市場規模、2023年~2033年 (US$ Mn)
8.7.2 地域別市場シェア、2023年&2033年(%)
9 臨床試験用品市場分析:エンドユーザー別
9.1 主な調査結果
9.2 エンドユーザーセグメント市場魅力度指数
9.3 臨床試験用品のエンドユーザー別市場規模の推定と予測
9.4 受託研究機関
9.4.1 地域別市場規模、2023-2033 (US$ Mn)
9.4.2 地域別市場シェア、2023年&2033年(%)
9.5 製薬会社・バイオテクノロジー企業
9.5.1 地域別市場規模、2023年~2033年 (US$ Mn)
9.5.2 地域別市場シェア、2023年&2033年(%)
9.6 医療機器企業
9.6.1 地域別市場規模、2023年~2033年 (US$ Mn)
9.6.2 地域別市場シェア、2023年&2033年(%)
9.7 その他のエンドユーザー
9.7.1 地域別市場規模、2023年〜2033年 (US$ Mn)
9.7.2 地域別市場シェア、2023年&2033年(%)
10 臨床試験用品市場分析:地域別
10.1 主な調査結果
10.2 地域別市場規模の推定と予測
11 北米の臨床試験用品市場分析
11.1 主な調査結果
11.2 北米の臨床試験用品市場の魅力度指数
11.3 北米の臨床試験用品国別市場、2023年、2028年&2033年(US$ bn)
11.4 北米の臨床試験用品の国別市場規模予測・予想
11.5 北米の臨床試験用品市場の場所別市場規模予測・予想
11.6 北米の臨床試験用品の市場規模予測・タイプ別予測
11.7 北米の臨床試験用品の市場規模予測・予想:サービス別
11.7.1 北米の臨床試験用品市場 製造別市場規模予測・予測
11.7.2 北米の治験薬市場のロジスティクス・流通別市場規模予測・予測
11.8 北米の臨床試験用品市場の治療分野別市場規模予測・予測
11.9 北米の臨床試験用品市場のフェーズ別市場規模予測・予測
11.10 北米の臨床試験用品市場のエンドユーザー別市場規模予測・予測
11.11 米国の臨床試験用品の市場分析
11.12 カナダの臨床試験用品の市場分析
12 欧州の臨床試験用品市場分析
12.1 主な調査結果
12.2 欧州の臨床試験用品市場の魅力度指数
12.3 欧州の臨床試験用品国別市場 2023年、2028年&2033年 (US$ bn)
12.4 欧州の臨床試験用品の国別市場規模予測・予想
12.5 欧州の臨床試験用品市場 所在地別市場規模予測・予測
12.6 欧州の臨床試験用品の市場規模予測・タイプ別予測
12.7 欧州の臨床試験用品の市場規模予測・サービス別予測
12.7.1 欧州の臨床試験用品の製造業別市場規模の推定と予測
12.7.2 欧州の臨床試験用品市場 ロジスティック&ディストリビューション別市場規模予測・予測
12.8 欧州の臨床試験用品の治療分野別市場規模予測・予測
12.9 欧州臨床試験用品市場のフェーズ別市場規模予測・予測
12.10 欧州の臨床試験用品の市場規模予測・エンドユーザー別予測
12.11 ドイツの臨床試験用品の市場分析
12.12 イギリスの臨床試験用品の市場分析
12.13 フランスの臨床試験用品の市場分析
12.14 イタリアの臨床試験用品の市場分析
12.15 スペイン臨床試験用品市場の分析
12.16 ロシア臨床試験用品市場の分析
12.17 その他の欧州の臨床試験用品市場の分析
13 アジア太平洋地域の臨床試験用品市場分析
13.1 主な調査結果
13.2 アジア太平洋地域の臨床試験用品の市場魅力度指数
13.3 アジア太平洋地域の臨床試験用品の国別市場、2023年、2028年&2033年(US$ bn)
13.4 アジア太平洋地域の臨床試験用品の国別市場規模の推定と予測
13.5 アジア太平洋地域の臨床試験用品の場所別市場規模の推定と予測
13.6 アジア太平洋地域の臨床試験用品の市場規模予測・種類別予測
13.7 アジア太平洋地域の臨床試験用品の市場規模予測・サービス別予測
13.7.1 アジア太平洋地域の臨床試験用品の製造業別市場規模予測・予測
13.7.2 アジア太平洋地域の臨床試験用品のロジスティクス・流通別市場規模の推計と予測
13.8 アジア太平洋地域の臨床試験用品の治療分野別市場規模予測・予想
13.9 アジア太平洋地域の臨床試験用品のフェーズ別市場規模予測・予測
13.10 アジア太平洋地域の臨床試験用品の市場規模予測・エンドユーザー別予測
13.11 中国の臨床試験用品の市場分析
13.12 インドの臨床試験用品の市場分析
13.13 日本の臨床試験用品市場の分析
13.14 韓国の臨床試験用品市場の分析
13.15 オーストラリアの臨床試験用品市場の分析
13.16 その他のアジア太平洋地域の臨床試験用品市場の分析
14 ラテンアメリカの臨床試験用品の市場分析
14.1 主な調査結果
14.2 ラテンアメリカの臨床試験用品市場の魅力度指数
14.3 ラテンアメリカの臨床試験用品国別市場、2023年、2028年&2033年(US$ bn)
14.4 ラテンアメリカの臨床試験用品の国別市場規模の推定と予測
14.5 ラテンアメリカの臨床試験用品市場の場所別市場規模予測・予想
14.6 ラテンアメリカの臨床試験用品の市場規模予測・タイプ別予測
14.7 ラテンアメリカの臨床試験用品の市場規模予測・予想:サービス別
14.7.1 ラテンアメリカの臨床試験用品市場の製造別市場規模の推定と予測
14.7.2 ラテンアメリカの臨床試験用品市場のロジスティック&ディストリビューション別市場規模の推定と予測
14.8 ラテンアメリカの臨床試験用品市場の治療分野別市場規模予測・予想
14.9 ラテンアメリカの臨床試験用品市場のフェーズ別市場規模予測・予測
14.10 ラテンアメリカの臨床試験用品市場のエンドユーザー別市場規模予測・予想
14.11 ブラジル臨床試験用品市場分析
14.12 メキシコの臨床試験用品市場の分析
14.13 その他のラテンアメリカの臨床試験用品市場の分析
15 MEAの臨床試験用品市場分析
15.1 主な調査結果
15.2 MEA臨床試験用品市場の魅力度指数
15.3 MEA臨床試験用品国別市場、2023年、2028年&2033年(US$ bn)
15.4 MEA臨床試験用品の国別市場規模の推定と予測
15.5 MEA臨床試験用品市場の場所別市場規模予測・予想
15.6 MEA臨床試験用品の市場規模予測・タイプ別予測
15.7 MEA臨床試験用品市場のサービス別市場規模予測・予想
15.7.1 MEA臨床試験用品市場の製造業別市場規模の推定と予測
15.7.2 MEA臨床試験用品市場のロジスティクス・流通別市場規模予測・予測
15.8 MEA臨床試験用品市場の治療分野別市場規模予測・予想
15.9 MEA臨床試験用品市場のフェーズ別市場規模予測・予測
15.10 MEA臨床試験用品のエンドユーザー別市場規模予測・予想
15.11 南アフリカの臨床試験用品の市場分析
15.12 サウジアラビアの臨床試験用品の市場分析
15.13 トルコの臨床試験用品の市場分析
15.14 UAE臨床試験用品の市場分析
15.15 MEAのその他の地域の臨床試験用品市場の分析
16 主要企業のプロフィール
16.1 競合状況、2021年
16.2 戦略的な展望
16.3 Thermo Fisher Scientific Inc.
16.3.1 企業スナップショット
16.3.2 会社概要
16.3.3 財務分析
16.3.3.1 純収益、2017-2021年
16.3.3.2 R&D、2017年-2021年
16.3.3.3 売上総利益、2017年~2021年
16.3.3.4 地域別市場シェア、2021年
16.3.4 製品ベンチマーク
16.3.5 戦略的な展望
16.4 Catalent, Inc.
16.4.1 企業スナップショット
16.4.2 会社概要
16.4.3 財務分析
16.4.3.1 純収益、2017-2021年
16.4.3.2 ebitda、2017-2021年
16.4.3.3 純利益、2017年-2021年
16.4.3.4 地域別市場シェア、2021年
16.4.4 製品ベンチマーク
16.4.5 戦略的な展望
16.5 Piramal Pharma Solutions
16.5.1 企業スナップショット
16.5.2 会社概要
16.5.3 ベンチマーキング
16.5.4 戦略的展望
16.6 Eurofins Scientific SE
16.6.1 企業スナップショット
16.6.2 会社概要
16.6.3 財務分析
16.6.3.1 純収益、2017年-2021年
16.6.3.2 営業利益、2017年-2021年
16.6.3.3 ebitda、2017-2021年
16.6.3.4 純利益、2017年-2021年
16.6.3.5 地域別市場シェア、2021年
16.6.4 製品ベンチマーク
16.7 Lonza
16.7.1 企業スナップショット
16.7.2 会社概要
16.7.3 財務分析
16.7.3.1 純収益、2017年-2021年
16.7.3.2 ebit、2017年-2021年
16.7.3.3 売上総利益、2017年-2021年
16.7.4 製品ベンチマーク
16.7.5 戦略的な展望
16.8 Clinigen Group plc
16.8.1 企業スナップショット
16.8.2 会社概要
16.8.3 財務分析
16.8.3.1 純収益、2017年-2021年
16.8.3.2 ebitda、2017年-2021年
16.8.3.3 当期純利益、2017年-2021年
16.8.4 製品ベンチマーク
16.8.5 戦略的な展望
16.9 AmerisourceBergen Corporation
16.9.1 企業スナップショット
16.9.2 会社概要
16.9.3 財務分析
16.9.3.1 純収益、2017年-2021年
16.9.3.2 営業利益、2017年-2021年
16.9.3.3 ebitda、2017-2021年
16.9.3.4 純利益、2017-2021年
16.9.4 製品ベンチマーク
16.9.5 戦略的な展望
16.10 DHL
16.10.1 企業スナップショット
16.10.2 会社概要
16.10.3 財務分析
16.10.3.1 純収益、2017年-2021年
16.10.3.2 ebitda、2017-2021年
16.10.3.3 売上総利益、2017年-2021年
16.10.3.4 純利益、2017-2021年
16.10.3.5 営業利益、2017年-2021年
16.10.3.6 地域別市場シェア、2017年-2021年
16.10.4 製品ベンチマーク
16.10.5 戦略的展望
16.11 Sharp Corporation
16.11.1 企業スナップショット
16.11.2 会社概要
16.11.3 財務分析
16.11.3.1 純収益、2017-2021年
16.11.3.2 ebitda、2017-2021年
16.11.3.3 当期純利益、2017年-2021年
16.11.3.4 営業利益、2017年-2021年
16.11.3.5 売上総利益、2017年-2021年
16.11.4 製品ベンチマーク
16.11.5 戦略的な展望
16.12 IQVIA Inc.
16.12.1 企業スナップショット
16.12.2 会社概要
16.12.3 財務分析
16.12.3.1 純収益、2017-2021年
16.12.3.2 ebitda、2017年-2021年
16.12.3.3 売上総利益、2017年-2021年
16.12.3.4 純利益、2017-2021年
16.12.3.5 営業利益、2017年-2021年
16.12.3.6 地域別マーケットシェア、2017年-2021年
16.12.4 製品ベンチマーク
16.12.5 戦略的な展望
16.13 Parexel
16.13.1 企業スナップショット
16.13.2 会社概要
16.13.3 ベンチマーキング
16.13.4 戦略的展望
16.14 Biocair
16.14.1 企業スナップショット
16.14.2 会社概要
16.14.3 製品ベンチマーク
16.14.4 戦略的展望
16.15 Liveo Research
16.15.1 企業スナップショット
16.15.2 会社概要
16.15.3 製品ベンチマーク
16.15.4 戦略的展望
16.16 Marken (A UPS Company)
16.16.1 企業スナップショット
16.16.2 会社概要
16.16.3 製品ベンチマーク
16.16.4 戦略的展望
16.17 PCI Pharma Services
16.17.1 企業スナップショット
16.17.2 会社概要
16.17.3 製品ベンチマーク
16.17.4 戦略的展望
16.18 Ancillare
16.18.1 企業スナップショット
16.18.2 会社概要
16.18.3 製品ベンチマーク
16.18.4 戦略的展望
16.19 N-SIDE
16.19.1 企業スナップショット
16.19.2 会社概要
16.19.3 ベンチマーキング
16.19.4 戦略的展望
16.20 Rubicon Research Pvt S.A.
16.20.1 企業スナップショット
16.20.2 会社概要
16.20.3 製品ベンチマーク
16.20.4 戦略的展望
16.21 Myonex
16.21.1 企業スナップショット
16.21.2 会社概要
16.21.3 ベンチマーキング
16.21.4 戦略的展望
16.22 Endpoint Clinical
16.22.1 企業スナップショット
16.22.2 会社概要
16.22.3 ベンチマーキング
16.22.4 戦略的展望
16.23 Recipharm AB
16.23.1 企業スナップショット
16.23.2 会社概要
16.23.3 ベンチマーキング
16.23.4 戦略的展望
16.24 COREX Logistics
16.24.1 企業スナップショット
16.24.2 会社概要
16.24.3 ベンチマーキング
16.25 Movianto
16.25.1 企業スナップショット
16.25.2 会社概要
16.25.3 ベンチマーキング
16.26 Durbin
16.26.1 企業スナップショット
16.26.2 会社概要
16.26.3 ベンチマーキング
16.27 SIRO Clinpharm
16.27.1 企業スナップショット
16.27.2 会社概要
16.27.3 ベンチマーキング
16.28 Inizio (UDG Healthcare plc)
16.28.1 企業スナップショット
16.28.2 会社概要
16.28.3 ベンチマーキング
16.29 KLIFO
16.29.1 企業スナップショット
16.29.2 会社概要
16.29.3 ベンチマーキング
16.30 ADAllen Pharma
16.30.1 企業スナップショット
16.30.2 会社概要
16.30.3 ベンチマーキング
16.31 Seveillar Clinical Supplies Services
16.31.1 企業スナップショット
16.31.2 会社概要
16.31.3 ベンチマーキング
16.32 Coghlan Group
16.32.1 企業スナップショット
16.32.2 会社概要
16.32.3 製品ベンチマーク
16.32.4 戦略的な展望
17 結論と提言
17.1 ヴィジョンゲインからの結論
17.2 市場関係者への提言
17.2.1 契約内容を把握する
17.2.2 明確な役割と責任の確立
17.2.3 共生的な関係の構築
表の一覧
Table 1 Clinical Trial Supplies Market Snapshot, 2023 & 2033 (US$ million, CAGR %)
Table 2 Global Clinical Trial Supplies Market Forecast by Location, 2023-2033 (US$ Mn, AGR%, CAGR%)
Table 3 Offshore Clinical Site Segment Market Forecast by Region, 2023-2033 (US$ Mn, AGR%, CAGR%)
Table 4 Domestic Clinical Site Segment Market Forecast by Region, 2023-2033 (US$ Mn, AGR%, CAGR%)
Table 5 Global Clinical Trial Supplies Market Forecast by Type, 2023-2033 (US$ Mn, AGR%, CAGR%)
Table 6 Small Molecule Products Segment Market Forecast by Region, 2023-2033 (US$ Mn, AGR%, CAGR %)
Table 7 Biologic Products Segment Market Forecast by Region, 2023-2033 (US$ Mn, AGR%, CAGR%)
Table 8 Medical Devices Segment Market Forecast by Region, 2023-2033 (US$ Mn, AGR%, CAGR %)
Table 9 Global Clinical Trial Supplies Market Forecast by Services, 2023-2033 (US$ Mn, AGR%, CAGR%)
Table 10 Manufacturing Segment Market Forecast by Region, 2023-2033 (US$ Mn, AGR%, CAGR %)
Table 11 IMPs and INDs Segment Market Forecast by Region, 2023-2033 (US$ Mn, AGR%, CAGR%)
Table 12 Placebos Segment Market Forecast by Region, 2023-2033 (US$ Mn, AGR%, CAGR%)
Table 13 Assays and Testkits Segment Market Forecast by Region, 2023-2033 (US$ Mn, AGR%, CAGR%)
Table 14 Others Segment Market Forecast by Region, 2023-2033 (US$ Mn, AGR%, CAGR%)
Table 15 Logistics & Distribution Segment Market Forecast by Region, 2023-2033 (US$ Mn, AGR%, CAGR%)
Table 16 Cold Chain Distribution Segment Market Forecast by Region, 2023-2033 (US$ Mn, AGR%, CAGR%)
Table 17 Non-cold Chain Segment Market Forecast by Region, 2023-2033 (US$ Mn, AGR%, CAGR%)
Table 18 Storage & Retention Segment Market Forecast by Region, 2023-2033 (US$ Mn, AGR%, CAGR%)
Table 19 Packaging and Labeling Segment Market Forecast by Region, 2023-2033 (US$ Mn, AGR%, CAGR%)
Table 20 Comparator Sourcing Segment Market Forecast by Region, 2023-2033 (US$ Mn, AGR%, CAGR%)
Table 21 Other CTS Services Segment Market Forecast by Region, 2023-2033 (US$ Mn, AGR%, CAGR%)
Table 22 Global Clinical Trial Supplies Market Forecast by Therapeutic Areas, 2023-2033 (US$ Mn, AGR%, CAGR%)
Table 23 Oncology Segment Market Forecast by Region, 2023-2033 (US$ Mn, AGR%, CAGR%)
Table 24 CNS and Mental Disorders Segment Market Forecast by Region, 2023-2033 (US$ Mn, AGR%, CAGR%)
Table 25 Cardiovascular Disease (CVD) Segment Market Forecast by Region, 2023-2033 (US$ Mn, AGR%, CAGR%)
Table 26 Infectious Disease Segment Market Forecast by Region, 2023-2033 (US$ Mn, AGR%, CAGR%)
Table 27 Immunology Disease Segment Market Forecast by Region, 2023-2033 (US$ Mn, AGR%, CAGR%)
Table 28 Blood Disorders Segment Market Forecast by Region, 2023-2033 (US$ Mn, AGR%, CAGR %)
Table 29 Metabolic Disorders Segment Market Forecast by Region, 2023-2033 (US$ Mn, AGR%, CAGR%)
Table 30 Digestive Disorders Segment Market Forecast by Region, 2023-2033 (US$ Mn, AGR%, CAGR%)
Table 31 Other Therapeutic Areas Segment Market Forecast by Region, 2023-2033 (US$ Mn, AGR%, CAGR %)
Table 32 Global Clinical Trial Supplies Market Forecast by Phase, 2023-2033 (US$ Mn, AGR%, CAGR%)
Table 33 Phase-I Segment Market Forecast by Region, 2023-2033 (US$ Mn, AGR%, CAGR%)
Table 34 Phase-II Segment Market Forecast by Region, 2023-2033 (US$ Mn, AGR%, CAGR%)
Table 35 Phase-III Segment Market Forecast by Region, 2023-2033 (US$ Mn, AGR%, CAGR%)
Table 36 Phase-IV Segment Market Forecast by Region, 2023-2033 (US$ Mn, AGR%, CAGR%)
Table 37 Global Clinical Trial Supplies Market Forecast by End-User, 2023-2033 (US$ Mn, AGR%, CAGR %)
Table 38 Contract Research Organizations Segment Market Forecast by Region, 2023-2033 (US$ Mn, AGR%, CAGR%)
Table 39 Pharmaceutical and Biotechnology Companies Segment Market Forecast by Region, 2023-2033 (US$ Mn, AGR%, CAGR%)
Table 40 Medical Device Companies Segment Market Forecast by Region, 2023-2033 (US$ Mn, AGR%, CAGR %)
Table 41 Other End-Users Segment Market Forecast by Region, 2023-2033 (US$ Mn, AGR%, CAGR%)
Table 42 Global Clinical Trial Supplies Market Forecast by Region 2023-2033 (US$ Mn, AGR%, CAGR%)
Table 43 North America Clinical Trial Supplies Market Forecast by Country, 2023-2033 (US$ Mn, AGR%, CAGR%)
Table 44 North America Clinical Trial Supplies Market Forecast by Location, 2023-2033 (US$ Mn, AGR%, CAGR%)
Table 45 North America Clinical Trial Supplies Market Forecast by Type, 2023-2033 (US$ Mn, AGR%, CAGR%)
Table 46 North America Clinical Trial Supplies Market Forecast by Services, 2023-2033 (US$ Mn, AGR%, CAGR%)
Table 47 North America Clinical Trial Supplies Market Forecast by Manufacturing, 2023-2033 (US$ Mn, AGR%, CAGR%)
Table 48 North America Clinical Trial Supplies Market Forecast by Logistics & Distribution, 2023-2033 (US$ Mn, AGR%, CAGR%)
Table 49 North America Clinical Trial Supplies Market Forecast by Therapeutic Areas, 2023-2033 (US$ Mn, AGR%, CAGR%)
Table 50 North America Clinical Trial Supplies Market Forecast by Phase, 2023-2033 (US$ Mn, AGR%, CAGR%)
Table 51 North America Clinical Trial Supplies Market Forecast by End-User, 2023-2033 (US$ Mn, AGR%, CAGR%)
Table 52 U.S. Clinical Trial Supplies Market Forecast, 2023-2033 (US$ Mn, AGR%, CAGR %)
Table 53 Canada Clinical Trial Supplies Market Forecast, 2023-2033 (US$ Mn, AGR%, CAGR%)
Table 54 Europe Clinical Trial Supplies Market Forecast by Country, 2023-2033 (US$ Mn, AGR%, CAGR%)
Table 55 Europe Clinical Trial Supplies Market Forecast by Location, 2023-2033 (US$ Mn, AGR%, CAGR%)
Table 56 Europe Clinical Trial Supplies Market Forecast by Type, 2023-2033 (US$ Mn, AGR%, CAGR%)
Table 57 Europe Clinical Trial Supplies Market Forecast by Services, 2023-2033 (US$ Mn, AGR%, CAGR%)
Table 58 Europe Clinical Trial Supplies Market Forecast by Manufacturing, 2023-2033 (US$ Mn, AGR%, CAGR%)
Table 59 Europe Clinical Trial Supplies Market Forecast by Logistics & Distribution, 2023-2033 (US$ Mn, AGR%, CAGR%)
Table 60 Europe Clinical Trial Supplies Market Forecast by Therapeutic Areas, 2023-2033 (US$ Mn, AGR%, CAGR%)
Table 61 Europe Clinical Trial Supplies Market Forecast by Phase, 2023-2033 (US$ Mn, AGR%, CAGR%)
Table 62 Europe Clinical Trial Supplies Market Forecast by End-User, 2023-2033 (US$ Mn, AGR%, CAGR%)
Table 63 Germany Clinical Trial Supplies Market Forecast, 2023-2033 (US$ Mn, AGR%, CAGR%)
Table 64 UK Clinical Trial Supplies Market Forecast, 2023-2033 (US$ Mn, AGR%, CAGR%)
Table 65 France Clinical Trial Supplies Market Forecast, 2023-2033 (US$ Mn, AGR%, CAGR%)
Table 66 Italy Clinical Trial Supplies Market Forecast, 2023-2033 (US$ Mn, AGR%, CAGR%)
Table 67 Spain Clinical Trial Supplies Market Forecast, 2023-2033 (US$ Mn, AGR%, CAGR%)
Table 68 Russia Clinical Trial Supplies Market Forecast, 2023-2033 (US$ Mn, AGR%, CAGR%)
Table 69 Rest of Europe Clinical Trial Supplies Market Forecast, 2023-2033 (US$ Mn, AGR%, CAGR%)
Table 70 Asia Pacific Clinical Trial Supplies Market Forecast by Country, 2023-2033 (US$ Mn, AGR%, CAGR%)
Table 71 Asia Pacific Clinical Trial Supplies Market Forecast by Location, 2023-2033 (US$ Mn, AGR%, CAGR%)
Table 72 Asia Pacific Clinical Trial Supplies Market Forecast by Type, 2023-2033 (US$ Mn, AGR%, CAGR%)
Table 73 Asia Pacific Clinical Trial Supplies Market Forecast by Services, 2023-2033 (US$ Mn, AGR%, CAGR%)
Table 74 Asia Pacific Clinical Trial Supplies Market Forecast by Manufacturing, 2023-2033 (US$ Mn, AGR%, CAGR%)
Table 75 Asia Pacific Clinical Trial Supplies Market Forecast by Logistics & Distribution, 2023-2033 (US$ Mn, AGR%, CAGR%)
Table 76 Asia Pacific Clinical Trial Supplies Market Forecast by Therapeutic Areas, 2023-2033 (US$ Mn, AGR%, CAGR%)
Table 77 Asia Pacific Clinical Trial Supplies Market Forecast by Phase, 2023-2033 (US$ Mn, AGR%, CAGR%)
Table 78 Asia Pacific Clinical Trial Supplies Market Forecast by End-User, 2023-2033 (US$ Mn, AGR%, CAGR%)
Table 79 China Clinical Trial Supplies Market Forecast, 2023-2033 (US$ Mn, AGR%, CAGR%)
Table 80 India Clinical Trial Supplies Market Forecast, 2023-2033 (US$ Mn, AGR%, CAGR%)
Table 81 Japan Clinical Trial Supplies Market Forecast, 2023-2033 (US$ Mn, AGR%, CAGR%)
Table 82 South Korea Clinical Trial Supplies Market Forecast, 2023-2033 (US$ Mn, AGR%, CAGR%)
Table 83 Australia Clinical Trial Supplies Market Forecast, 2023-2033 (US$ Mn, AGR%, CAGR%)
Table 84 Rest of Asia-Pacific Clinical Trial Supplies Market Forecast, 2023-2033 (US$ Mn, AGR%, CAGR%)
Table 85 Latin America Clinical Trial Supplies Market Forecast by Country, 2023-2033 (US$ Mn, AGR%, CAGR%)
Table 86 Latin America Clinical Trial Supplies Market Forecast by Location, 2023-2033 (US$ Mn, AGR%, CAGR%)
Table 87 Latin America Clinical Trial Supplies Market Forecast by Type, 2023-2033 (US$ Mn, AGR%, CAGR%)
Table 88 Latin America Clinical Trial Supplies Market Forecast by Services, 2023-2033 (US$ Mn, AGR%, CAGR%)
Table 89 Latin America Clinical Trial Supplies Market Forecast by Manufacturing, 2023-2033 (US$ Mn, AGR%, CAGR%)
Table 90 Latin America Clinical Trial Supplies Market Forecast by Logistics & Distribution, 2023-2033 (US$ Mn, AGR%, CAGR%)
Table 91 Latin America Clinical Trial Supplies Market Forecast by Therapeutic Areas, 2023-2033 (US$ Mn, AGR%, CAGR%)
Table 92 Latin America Clinical Trial Supplies Market Forecast by Phase, 2023-2033 (US$ Mn, AGR%, CAGR%)
Table 93 Latin America Clinical Trial Supplies Market Forecast by End-User, 2023-2033 (US$ Mn, AGR%, CAGR%)
Table 94 Brazil Clinical Trial Supplies Market Forecast, 2023-2033 (US$ Mn, AGR%, CAGR%)
Table 95 Mexico Clinical Trial Supplies Market Forecast, 2023-2033 (US$ Mn, AGR%, CAGR%)
Table 96 Rest of Latin America Clinical Trial Supplies Market Forecast, 2023-2033 (US$ Mn, AGR%, CAGR%)
Table 97 MEA Clinical Trial Supplies Market Forecast by Country, 2023-2033 (US$ Mn, AGR%, CAGR%)
Table 98 MEA Clinical Trial Supplies Market Forecast by Location, 2023-2033 (US$ Mn, AGR%, CAGR%)
Table 99 MEA Clinical Trial Supplies Market Forecast by Type, 2023-2033 (US$ Mn, AGR%, CAGR%)
Table 100 MEA Clinical Trial Supplies Market Forecast by Services, 2023-2033 (US$ Mn, AGR%, CAGR%)
Table 101 MEA Clinical Trial Supplies Market Forecast by Manufacturing, 2023-2033 (US$ Mn, AGR%, CAGR%)
Table 102 MEA Clinical Trial Supplies Market Forecast by Logistics & Distribution, 2023-2033 (US$ Mn, AGR%, CAGR%)
Table 103 MEA Clinical Trial Supplies Market Forecast by Therapeutic Areas, 2023-2033 (US$ Mn, AGR%, CAGR%)
Table 104 MEA Clinical Trial Supplies Market Forecast by Phase, 2023-2033 (US$ Mn, AGR%, CAGR%)
Table 105 MEA Clinical Trial Supplies Market Forecast by End-User, 2023-2033 (US$ Mn, AGR%, CAGR%)
Table 106 South Africa Clinical Trial Supplies Market Forecast, 2023-2033 (US$ Mn, AGR%, CAGR%)
Table 107 Saudi Arabia Clinical Trial Supplies Market Forecast, 2023-2033 (US$ Mn, AGR%, CAGR%)
Table 108 Turkey Clinical Trial Supplies Market Forecast, 2023-2033 (US$ Mn, AGR%, CAGR%)
Table 109 UAE Clinical Trial Supplies Market Forecast, 2023-2033 (US$ Mn, AGR%, CAGR%)
Table 110 Rest of MEA Clinical Trial Supplies Market Forecast, 2023-2033 (US$ Mn, AGR%, CAGR%)
Table 111 Strategic Outlook
Table 112 Thermo Fisher Scientific Inc.: Key Details, (CEO, HQ, Revenue, Founded, No. of Employees, Company Type, Website, Business Segment)
Table 113 Thermo Fisher Scientific Inc.: Product Benchmarking
Table 1 Thermo Fisher Scientific Inc.: Strategic Outlook
Table 114 Catalent, Inc.: Key Details, (CEO, HQ, Revenue, Founded, No. of Employees, Company Type, Website, Business Segment)
Table 115 Catalent, Inc.: Product Benchmarking
Table 116 Catalent, Inc.: Strategic Outlook
Table 117 Piramal Pharma Solutions: Key Details, (CEO, HQ, Revenue, Founded, No. of Employees, Company Type, Website, Business Segment)
Table 118 Piramal Pharma Solutions: Product Benchmarking
Table 119 Piramal Pharma Solutions: Strategic Outlook
Table 120 Eurofins Scientific SE: Key Details, (CEO, HQ, Revenue, Founded, No. of Employees, Company Type, Website, Business Segment)
Table 121 Eurofins Scientific SE: Product Benchmarking
Table 122 Lonza: Key Details, (CEO, HQ, Revenue, Founded, No. of Employees, Company Type, Website, Business Segment)
Table 123 Lonza: Product Benchmarking
Table 124 Lonza: Strategic Outlook
Table 125 Clinigen Group plc: Key Details, (CEO, HQ, Revenue, Founded, No. of Employees, Company Type, Website, Business Segment)
Table 126 Clinigen Group plc: Product Benchmarking
Table 2 Clinigen Group plc: Strategic Outlook
Table 127 AmerisourceBergen Corporation: Key Details, (CEO, HQ, Revenue, Founded, No. of Employees, Company Type, Website, Business Segment)
Table 128 AmerisourceBergen Corporation: Product Benchmarking
Table 3 AmerisourceBergen Corporation: Strategic Outlook
Table 129 DHL: Key Details, (CEO, HQ, Revenue, Founded, No. of Employees, Company Type, Website, Business Segment)
Table 130 DHL: Product Benchmarking
Table 131 DHL: Strategic Outlook
Table 132 Sharp Corporation: Key Details, (CEO, HQ, Revenue, Founded, No. of Employees, Company Type, Website, Business Segment)
Table 133 Sharp Corporation: Product Benchmarking
Table 4 Sharp Corporation: Strategic Outlook
Table 134 IQVIA Inc.: Key Details, (CEO, HQ, Revenue, Founded, No. of Employees, Company Type, Website, Business Segment)
Table 135 IQVIA Inc.: Product Benchmarking
Table 136 IQVIA Inc.: Strategic Outlook
Table 137 Parexel: Key Details, (CEO, HQ, Revenue, Founded, No. of Employees, Company Type, Website, Business Segment)
Table 138 Parexel: Product Benchmarking
Table 139 Parexel: Strategic Outlook
Table 140 Biocair: Key Details, (CEO, HQ, Revenue, Founded, No. of Employees, Company Type, Website, Business Segment)
Table 141 Biocair: Product Benchmarking
Table 142 Biocair: Strategic Outlook
Table 143 Liveo Research: Key Details, (CEO, HQ, Revenue, Founded, No. of Employees, Company Type, Website, Business Segment)
Table 144 Liveo Research: Product Benchmarking
Table 145 Liveo Research: Strategic Outlook
Table 146 Marken (A UPS Company): Key Details, (CEO, HQ, Revenue, Founded, No. of Employees, Company Type, Website, Business Segment)
Table 147 Marken (A UPS Company): Product Benchmarking
Table 148 Marken (A UPS Company): Strategic Outlook
Table 149 PCI Pharma Services: Key Details, (CEO, HQ, Revenue, Founded, No. of Employees, Company Type, Website, Business Segment)
Table 150 PCI Pharma Services: Product Benchmarking
Table 151 PCI Pharma Services: Strategic Outlook
Table 152 Ancillare: Key Details, (CEO, HQ, Revenue, Founded, No. of Employees, Company Type, Website, Business Segment)
Table 153 Ancillare: Product Benchmarking
Table 154 Ancillare: Strategic Outlook
Table 155 N-SIDE: Key Details, (CEO, HQ, Revenue, Founded, No. of Employees, Company Type, Website, Business Segment)
Table 156 N-SIDE: Product Benchmarking
Table 157 N-SIDE: Strategic Outlook
Table 158 Rubicon Research Pvt S.A.: Key Details, (CEO, HQ, Revenue, Founded, No. of Employees, Company Type, Website, Business Segment)
Table 159 Rubicon Research Pvt S.A.: Product Benchmarking
Table 160 Rubicon Research Pvt S.A.: Strategic Outlook
Table 161 Myonex: Key Details, (CEO, HQ, Revenue, Founded, No. of Employees, Company Type, Website, Business Segment)
Table 162 Myonex: Product Benchmarking
Table 163 Myonex: Strategic Outlook
Table 164 Endpoint Clinical: Key Details, (CEO, HQ, Revenue, Founded, No. of Employees, Company Type, Website, Business Segment)
Table 165 Endpoint Clinical: Product Benchmarking
Table 166 Endpoint Clinical: Strategic Outlook
Table 167 Recipharm AB: Key Details, (CEO, HQ, Revenue, Founded, No. of Employees, Company Type, Website, Business Segment)
Table 168 Recipharm AB: Product Benchmarking
Table 5 Recipharm AB: Strategic Outlook
Table 169 COREX Logistics: Key Details, (CEO, HQ, Revenue, Founded, No. of Employees, Company Type, Website, Business Segment)
Table 170 COREX Logistics: Product Benchmarking
Table 171 Movianto: Key Details, (CEO, HQ, Revenue, Founded, No. of Employees, Company Type, Website, Business Segment)
Table 172 Movianto: Product Benchmarking
Table 173 Durbin: Key Details, (CEO, HQ, Revenue, Founded, No. of Employees, Company Type, Website, Business Segment)
Table 174 Durbin: Product Benchmarking
Table 175 SIRO Clinpharm: Key Details, (CEO, HQ, Revenue, Founded, No. of Employees, Company Type, Website, Business Segment)
Table 176 SIRO Clinpharm: Product Benchmarking
Table 177 Inizio (UDG Healthcare plc): Key Details, (CEO, HQ, Revenue, Founded, No. of Employees, Company Type, Website, Business Segment)
Table 178 Inizio (UDG Healthcare plc): Product Benchmarking
Table 179 KLIFO: Key Details, (CEO, HQ, Revenue, Founded, No. of Employees, Company Type, Website, Business Segment)
Table 180 KLIFO: Product Benchmarking
Table 181 ADAllen Pharma: Key Details, (CEO, HQ, Revenue, Founded, No. of Employees, Company Type, Website, Business Segment)
Table 182 ADAllen Pharma: Product Benchmarking
Table 183 Seveillar Clinical Supplies Services: Key Details, (CEO, HQ, Revenue, Founded, No. of Employees, Company Type, Website, Business Segment)
Table 184 Seveillar Clinical Supplies Services: Product Benchmarking
Table 185 Coghlan Group: Key Details, (CEO, HQ, Revenue, Founded, No. of Employees, Company Type, Website, Business Segment)
Table 186 Coghlan Group: Product Benchmarking
Table 187 Coghlan Group: Strategic Outlook
図の一覧
Figure 1 Clinical Trial Supplies Market Segmentation
Figure 2 Clinical Trial Supplies Market by Location: Market Attractiveness Index
Figure 3 Clinical Trial Supplies Market by Type: Market Attractiveness Index
Figure 4 Clinical Trial Supplies Market by Services: Market Attractiveness Index
Figure 5 Clinical Trial Supplies Market by Therapeutic Areas: Market Attractiveness Index
Figure 6 Clinical Trial Supplies Market by Phase: Market Attractiveness Index
Figure 7 Clinical Trial Supplies Market by End-User: Market Attractiveness Index
Figure 8 Clinical Trial Supplies Market Attractiveness Index by Region
Figure 9 Clinical Trial Supplies Market: Market Dynamics
Figure 10 COVID Impact Analysis: Clinical Trial Supplies Market Recovery Scenarios
Figure 11 Clinical Trial Supplies Market by Region, 2023-2033 (US$ Mn, AGR (%), CAGR (%)): “V” Shaped Recovery Scenario
Figure 12 Clinical Trial Supplies Market by Region, 2023-2033 (US$ Mn, AGR (%), CAGR (%)): “V” Shaped Recovery
Figure 13 Clinical Trial Supplies Market by Region, 2023-2033 (US$ Mn, AGR (%), CAGR (%)): “U” Shaped Recovery Scenario
Figure 14 Clinical Trial Supplies Market by Region, 2023-2033 (US$ Mn, AGR (%), CAGR (%)): “U” Shaped Recovery
Figure 15 Clinical Trial Supplies Market by Region, 2023-2033 (US$ Mn, AGR (%), CAGR (%)): “W” Shaped Recovery Scenario
Figure 16 Clinical Trial Supplies Market by Region, 2023-2033 (US$ Mn, AGR (%), CAGR (%)): “W” Shaped Recovery
Figure 17 Clinical Trial Supplies Market by Region, 2023-2033 (US$ Mn, AGR (%), CAGR (%)): “L” Shaped Recovery Scenario
Figure 18 Clinical Trial Supplies Market by Region, 2023-2033 (US$ Mn, AGR (%), CAGR (%)): “L” Shaped Recovery
Figure 19 Clinical Trial Supplies Market: PEST Analysis
Figure 20 Clinical Trial Supplies Market by Location: Market Attractiveness Index
Figure 21 Clinical Trial Supplies Market Forecast by Location, 2023-2033 (US$ million)
Figure 22 Clinical Trial Supplies Market Share Forecast by Location, 2023, 2028, 2033 (%)
Figure 23 Offshore Clinical Site Market Forecast by Region, 2023-2033 (US$ million)
Figure 24 Offshore Clinical Site Market Share Forecast by Region, 2023 & 2033 (%)
Figure 25 Offshore Clinical Site Market Forecast by Region, 2023-2033 (US$ million)
Figure 26 Offshore Clinical Site Market Share Forecast by Region, 2023 & 2033 (%)
Figure 27 Clinical Trial Supplies Market by Type: Market Attractiveness Index
Figure 28 Clinical Trial Supplies Market Forecast by Type, 2023-2033 (US$ million)
Figure 29 Clinical Trial Supplies Market Share Forecast by Type, 2023, 2028, 2033 (%)
Figure 30 Small Molecule Products Market Forecast by Region, 2023-2033 (US$ million)
Figure 31 Small Molecule Products Market Share Forecast by Region, 2023 & 2033 (%)
Figure 32 Biologic Products Market Forecast by Region, 2023-2033 (US$ million)
Figure 33 Biologic Products Market Share Forecast by Region, 2023 & 2033 (%)
Figure 34 Medical Devices Market Forecast by Region, 2023-2033 (US$ million)
Figure 35 Medical Devices Market Share Forecast by Region, 2023 & 2033 (%)
Figure 36 Clinical Trial Supplies Market by Services: Market Attractiveness Index
Figure 37 Clinical Trial Supplies Market Forecast by Services, 2023-2033 (US$ million)
Figure 38 Clinical Trial Supplies Market Share Forecast by Services, 2023, 2028, 2033 (%)
Figure 39 Manufacturing Market Forecast by Region, 2023-2033 (US$ million)
Figure 40 Manufacturing Market Share Forecast by Region, 2023 & 2033 (%)
Figure 41 IMPs and INDs Market Forecast by Region, 2023-2033 (US$ million)
Figure 42 IMPs and INDs Market Share Forecast by Region, 2023 & 2033 (%)
Figure 43 Placebos Market Forecast by Region, 2023-2033 (US$ million)
Figure 44 Placebos Market Share Forecast by Region, 2023 & 2033 (%)
Figure 45 Assays and Testkits Market Forecast by Region, 2023-2033 (US$ million)
Figure 46 Assays and Testkits Market Share Forecast by Region, 2023 & 2033 (%)
Figure 47 Others Market Forecast by Region, 2023-2033 (US$ million)
Figure 48 Others Market Share Forecast by Region, 2023 & 2033 (%)
Figure 49 Logistics & Distribution Market Forecast by Region, 2023-2033 (US$ million)
Figure 50 Logistics & Distribution Market Share Forecast by Region, 2023 & 2033 (%)
Figure 51 Cold Chain Distribution Market Forecast by Region, 2023-2033 (US$ million)
Figure 52 Cold Chain Distribution Market Share Forecast by Region, 2023 & 2033 (%)
Figure 53 Non-cold Chain Market Forecast by Region, 2023-2033 (US$ million)
Figure 54 Non-cold Chain Market Share Forecast by Region, 2023 & 2033 (%)
Figure 55 Logistics & Distribution Market Forecast by Region, 2023-2033 (US$ million)
Figure 56 Storage & Retention Market Share Forecast by Region, 2023 & 2033 (%)
Figure 57 Packaging and Labeling Market Forecast by Region, 2023-2033 (US$ million)
Figure 58 Packaging and Labeling Market Share Forecast by Region, 2023 & 2033 (%)
Figure 59 Comparator Sourcing Market Forecast by Region, 2023-2033 (US$ million)
Figure 60 Comparator Sourcing Market Share Forecast by Region, 2023 & 2033 (%)
Figure 61 Other CTS Services Market Forecast by Region, 2023-2033 (US$ million)
Figure 62 Other CTS Services Market Share Forecast by Region, 2023 & 2033 (%)
Figure 63 Clinical Trial Supplies Market by Therapeutic Areas: Market Attractiveness Index
Figure 64 Clinical Trial Supplies Market Forecast by Therapeutic Areas, 2023-2033 (US$ million)
Figure 65 Clinical Trial Supplies Market Share Forecast by Therapeutic Areas, 2023, 2028, 2033 (%)
Figure 66 Oncology Market Forecast by Region, 2023-2033 (US$ million)
Figure 67 Oncology Market Share Forecast by Region, 2023 & 2033 (%)
Figure 68 CNS and Mental Disorders Market Forecast by Region, 2023-2033 (US$ million)
Figure 69 CNS and Mental Disorders Market Share Forecast by Region, 2023 & 2033 (%)
Figure 70 Cardiovascular Disease (CVD) Market Forecast by Region, 2023-2033 (US$ million)
Figure 71 Cardiovascular Disease (CVD) Market Share Forecast by Region, 2023 & 2033 (%)
Figure 72 Cardiovascular Disease (CVD) Market Forecast by Region, 2023-2033 (US$ million)
Figure 73 Cardiovascular Disease (CVD) Market Share Forecast by Region, 2023 & 2033 (%)
Figure 74 Oncology Market Forecast by Region, 2023-2033 (US$ million)
Figure 75 Oncology Market Share Forecast by Region, 2023 & 2033 (%)
Figure 76 Blood Disorders Market Forecast by Region, 2023-2033 (US$ million)
Figure 77 Blood Disorders Market Share Forecast by Region, 2023 & 2033 (%)
Figure 78 Metabolic Disorders Market Forecast by Region, 2023-2033 (US$ million)
Figure 79 Metabolic Disorders Market Share Forecast by Region, 2023 & 2033 (%)
Figure 80 Metabolic Disorders Market Forecast by Region, 2023-2033 (US$ million)
Figure 81 Digestive Disorders Market Share Forecast by Region, 2023 & 2033 (%)
Figure 82 Other Therapeutic Areas Market Forecast by Region, 2023-2033 (US$ million)
Figure 83 Other Therapeutic Areas Market Share Forecast by Region, 2023 & 2033 (%)
Figure 84 Clinical Trial Supplies Market by Phase: Market Attractiveness Index
Figure 85 Clinical Trial Supplies Market Forecast by Phase, 2023-2033 (US$ million)
Figure 86 Clinical Trial Supplies Market Share Forecast by Phase, 2023, 2028, 2033 (%)
Figure 87 Phase-I Market Forecast by Region, 2023-2033 (US$ million)
Figure 88 Phase-I Market Share Forecast by Region, 2023 & 2033 (%)
Figure 89 Phase-II Market Forecast by Region, 2023-2033 (US$ million)
Figure 90 Phase-II Market Share Forecast by Region, 2023 & 2033 (%)
Figure 91 Phase-III Market Forecast by Region, 2023-2033 (US$ million)
Figure 92 Phase-III Market Share Forecast by Region, 2023 & 2033 (%)
Figure 93 Phase-IV Market Forecast by Region, 2023-2033 (US$ million)
Figure 94 Phase-IV Market Share Forecast by Region, 2023 & 2033 (%)
Figure 95 Clinical Trial Supplies Market by End-User: Market Attractiveness Index
Figure 96 Clinical Trial Supplies Market Forecast by End-User, 2023-2033 (US$ million)
Figure 97 Clinical Trial Supplies Market Share Forecast by End-User, 2023, 2028, 2033 (%)
Figure 98 Phase-I Market Forecast by Region, 2023-2033 (US$ million)
Figure 99 Phase-I Market Share Forecast by Region, 2023 & 2033 (%)
Figure 100 Pharmaceutical and Biotechnology Companies Market Forecast by Region, 2023-2033 (US$ million)
Figure 101 Pharmaceutical and Biotechnology Companies Market Share Forecast by Region, 2023 & 2033 (%)
Figure 102 Medical Device Companies Market Forecast by Region, 2023-2033 (US$ million)
Figure 103 Medical Device Companies Market Share Forecast by Region, 2023 & 2033 (%)
Figure 104 Medical Device Companies Market Forecast by Region, 2023-2033 (US$ million)
Figure 105 Other End-Users Market Share Forecast by Region, 2023 & 2033 (%)
Figure 106 Clinical Trial Supplies Market Forecast by Region 2023, 2028, 2033 (Revenue, CAGR%)
Figure 107 Clinical Trial Supplies Market Share Forecast by Region 2023, 2028, 2033(%)
Figure 108 Clinical Trial Supplies Market by Region, 2023-2033 (US$ Mn)
Figure 109 North America Clinical Trial Supplies Market Attractiveness Index
Figure 110 North America Clinical Trial Supplies Market by Region, 2023, 2028 & 2033 (US$ million)
Figure 111 North America Clinical Trial Supplies Market Forecast by Country, 2023-2033 (US$ million)
Figure 112 North America Clinical Trial Supplies Market Share Forecast by Country, 2023 & 2033 (%)
Figure 113 North America Clinical Trial Supplies Market Forecast by Location, 2023-2033 (US$ million)
Figure 114 North America Clinical Trial Supplies Market Share Forecast by Location, 2023 & 2033 (%)
Figure 115 North America Clinical Trial Supplies Market Forecast by Type, 2023-2033 (US$ million)
Figure 116 North America Clinical Trial Supplies Market Share Forecast by Type, 2023 & 2033 (%)
Figure 117 North America Clinical Trial Supplies Market Forecast by Services, 2023-2033 (US$ million)
Figure 118 North America Clinical Trial Supplies Market Share Forecast by Services, 2023 & 2033 (%)
Figure 119 North America Clinical Trial Supplies Market Forecast by Manufacturing, 2023-2033 (US$ million)
Figure 120 North America Clinical Trial Supplies Market Share Forecast by Manufacturing, 2023 & 2033 (%)
Figure 121 North America Clinical Trial Supplies Market Forecast by Logistics & Distribution, 2023-2033 (US$ million)
Figure 122 North America Clinical Trial Supplies Market Share Forecast by Logistics & Distribution, 2023 & 2033 (%)
Figure 123 North America Clinical Trial Supplies Market Forecast by Therapeutic Areas, 2023-2033 (US$ million)
Figure 124 North America Clinical Trial Supplies Market Share Forecast by Therapeutic Areas, 2023 & 2033 (%)
Figure 125 North America Clinical Trial Supplies Market Forecast by Phase, 2023-2033 (US$ million)
Figure 126 North America Clinical Trial Supplies Market Share Forecast by Phase, 2023 & 2033 (%)
Figure 127 North America Clinical Trial Supplies Market Forecast by End-User, 2023-2033 (US$ million)
Figure 128 North America Clinical Trial Supplies Market Share Forecast by Phase, 2023 & 2033 (%)
Figure 129 U.S. Clinical Trial Supplies Market Forecast, 2023-2033 (US$ million, AGR %)
Figure 130 Canada Clinical Trial Supplies Market Forecast, 2023-2033 (US$ million, AGR %)
Figure 131 Europe Clinical Trial Supplies Market Attractiveness Index
Figure 132 Europe Clinical Trial Supplies Market by Region, 2023, 2028 & 2033 (US$ million)
Figure 133 Europe Clinical Trial Supplies Market Forecast by Country, 2023-2033 (US$ million)
Figure 134 Europe Clinical Trial Supplies Market Share Forecast by Country, 2023 & 2033 (%)
Figure 135 Europe Clinical Trial Supplies Market Forecast by Location, 2023-2033 (US$ million)
Figure 136 Europe Clinical Trial Supplies Market Share Forecast by Location, 2023 & 2033 (%)
Figure 137 Europe Clinical Trial Supplies Market Forecast by Type, 2023-2033 (US$ million)
Figure 138 Europe Clinical Trial Supplies Market Share Forecast by Type, 2023 & 2033 (%)
Figure 139 Europe Clinical Trial Supplies Market Forecast by Services, 2023-2033 (US$ million)
Figure 140 Europe Clinical Trial Supplies Market Share Forecast by Services, 2023 & 2033 (%)
Figure 141 Europe Clinical Trial Supplies Market Forecast by Manufacturing, 2023-2033 (US$ million)
Figure 142 Europe Clinical Trial Supplies Market Share Forecast by Manufacturing, 2023 & 2033 (%)
Figure 143 Europe Clinical Trial Supplies Market Forecast by Logistics & Distribution, 2023-2033 (US$ million)
Figure 144 Europe Clinical Trial Supplies Market Share Forecast by Logistics & Distribution, 2023 & 2033 (%)
Figure 145 Europe Clinical Trial Supplies Market Forecast by Therapeutic Areas, 2023-2033 (US$ million)
Figure 146 Europe Clinical Trial Supplies Market Share Forecast by Therapeutic Areas, 2023 & 2033 (%)
Figure 147 Europe Clinical Trial Supplies Market Forecast by Phase, 2023-2033 (US$ million)
Figure 148 Europe Clinical Trial Supplies Market Share Forecast by Phase, 2023 & 2033 (%)
Figure 149 Europe Clinical Trial Supplies Market Forecast by End-User, 2023-2033 (US$ million)
Figure 150 Europe Clinical Trial Supplies Market Share Forecast by Phase, 2023 & 2033 (%)
Figure 151 Germany Clinical Trial Supplies Market Forecast, 2023-2033 (US$ million, AGR %)
Figure 152 UK Clinical Trial Supplies Market Forecast, 2023-2033 (US$ million, AGR %)
Figure 153 France Clinical Trial Supplies Market Forecast, 2023-2033 (US$ million, AGR %)
Figure 154 Italy Clinical Trial Supplies Market Forecast, 2023-2033 (US$ million, AGR %)
Figure 155 Spain Clinical Trial Supplies Market Forecast, 2023-2033 (US$ million, AGR %)
Figure 156 Russia Clinical Trial Supplies Market Forecast, 2023-2033 (US$ million, AGR %)
Figure 157 Rest of Europe Clinical Trial Supplies Market Forecast, 2023-2033 (US$ million, AGR %)
Figure 158 Asia Pacific Clinical Trial Supplies Market Attractiveness Index
Figure 159 Asia Pacific Clinical Trial Supplies Market by Region, 2023, 2028 & 2033 (US$ million)
Figure 160 Asia Pacific Clinical Trial Supplies Market Forecast by Country, 2023-2033 (US$ million)
Figure 161 Asia Pacific Clinical Trial Supplies Market Share Forecast by Country, 2023 & 2033 (%)
Figure 162 Asia Pacific Clinical Trial Supplies Market Forecast by Location, 2023-2033 (US$ million)
Figure 163 Asia Pacific Clinical Trial Supplies Market Share Forecast by Location, 2023 & 2033 (%)
Figure 164 Asia Pacific Clinical Trial Supplies Market Forecast by Type, 2023-2033 (US$ million)
Figure 165 Asia Pacific Clinical Trial Supplies Market Share Forecast by Type, 2023 & 2033 (%)
Figure 166 Asia Pacific Clinical Trial Supplies Market Forecast by Services, 2023-2033 (US$ million)
Figure 167 Asia Pacific Clinical Trial Supplies Market Share Forecast by Services, 2023 & 2033 (%)
Figure 168 Asia Pacific Clinical Trial Supplies Market Forecast by Manufacturing, 2023-2033 (US$ million)
Figure 169 Asia Pacific Clinical Trial Supplies Market Share Forecast by Manufacturing, 2023 & 2033 (%)
Figure 170 Asia Pacific Clinical Trial Supplies Market Forecast by Logistics & Distribution, 2023-2033 (US$ million)
Figure 171 Asia Pacific Clinical Trial Supplies Market Share Forecast by Logistics & Distribution, 2023 & 2033 (%)
Figure 172 Asia Pacific Clinical Trial Supplies Market Forecast by Therapeutic Areas, 2023-2033 (US$ million)
Figure 173 Asia Pacific Clinical Trial Supplies Market Share Forecast by Therapeutic Areas, 2023 & 2033 (%)
Figure 174 Asia Pacific Clinical Trial Supplies Market Forecast by Phase, 2023-2033 (US$ million)
Figure 175 Asia Pacific Clinical Trial Supplies Market Share Forecast by Phase, 2023 & 2033 (%)
Figure 176 Asia Pacific Clinical Trial Supplies Market Forecast by End-User, 2023-2033 (US$ million)
Figure 177 Asia Pacific Clinical Trial Supplies Market Share Forecast by Phase, 2023 & 2033 (%)
Figure 178 China Clinical Trial Supplies Market Forecast, 2023-2033 (US$ million, AGR %)
Figure 179 India Clinical Trial Supplies Market Forecast, 2023-2033 (US$ million, AGR %)
Figure 180 Japan Clinical Trial Supplies Market Forecast, 2023-2033 (US$ million, AGR %)
Figure 181 South Korea Clinical Trial Supplies Market Forecast, 2023-2033 (US$ million, AGR %)
Figure 182 Australia Clinical Trial Supplies Market Forecast, 2023-2033 (US$ million, AGR %)
Figure 183 Rest of Asia-Pacific Clinical Trial Supplies Market Forecast, 2023-2033 (US$ million, AGR %)
Figure 184 Latin America Clinical Trial Supplies Market Attractiveness Index
Figure 185 Latin America Clinical Trial Supplies Market by Region, 2023, 2028 & 2033 (US$ million)
Figure 186 Latin America Clinical Trial Supplies Market Forecast by Country, 2023-2033 (US$ million)
Figure 187 Latin America Clinical Trial Supplies Market Share Forecast by Country, 2023 & 2033 (%)
Figure 188 Latin America Clinical Trial Supplies Market Forecast by Location, 2023-2033 (US$ million)
Figure 189 Latin America Clinical Trial Supplies Market Share Forecast by Location, 2023 & 2033 (%)
Figure 190 Latin America Clinical Trial Supplies Market Forecast by Type, 2023-2033 (US$ million)
Figure 191 Latin America Clinical Trial Supplies Market Share Forecast by Type, 2023 & 2033 (%)
Figure 192 Latin America Clinical Trial Supplies Market Forecast by Services, 2023-2033 (US$ million)
Figure 193 Latin America Clinical Trial Supplies Market Share Forecast by Services, 2023 & 2033 (%)
Figure 194 Latin America Clinical Trial Supplies Market Forecast by Manufacturing, 2023-2033 (US$ million)
Figure 195 Latin America Clinical Trial Supplies Market Share Forecast by Manufacturing, 2023 & 2033 (%)
Figure 196 Latin America Clinical Trial Supplies Market Forecast by Logistics & Distribution, 2023-2033 (US$ million)
Figure 197 Latin America Clinical Trial Supplies Market Share Forecast by Logistics & Distribution, 2023 & 2033 (%)
Figure 198 Latin America Clinical Trial Supplies Market Forecast by Therapeutic Areas, 2023-2033 (US$ million)
Figure 199 Latin America Clinical Trial Supplies Market Share Forecast by Therapeutic Areas, 2023 & 2033 (%)
Figure 200 Latin America Clinical Trial Supplies Market Forecast by Phase, 2023-2033 (US$ million)
Figure 201 Latin America Clinical Trial Supplies Market Share Forecast by Phase, 2023 & 2033 (%)
Figure 202 Latin America Clinical Trial Supplies Market Forecast by End-User, 2023-2033 (US$ million)
Figure 203 Latin America Clinical Trial Supplies Market Share Forecast by Phase, 2023 & 2033 (%)
Figure 204 Brazil Clinical Trial Supplies Market Forecast, 2023-2033 (US$ million, AGR %)
Figure 205 Mexico Clinical Trial Supplies Market Forecast, 2023-2033 (US$ million, AGR %)
Figure 206 Rest of Latin America Clinical Trial Supplies Market Forecast, 2023-2033 (US$ million, AGR %)
Figure 207 MEA Clinical Trial Supplies Market Attractiveness Index
Figure 208 MEA Clinical Trial Supplies Market by Region, 2023, 2028 & 2033 (US$ million)
Figure 209 MEA Clinical Trial Supplies Market Forecast by Country, 2023-2033 (US$ million)
Figure 210 MEA Clinical Trial Supplies Market Share Forecast by Country, 2023 & 2033 (%)
Figure 211 MEA Clinical Trial Supplies Market Forecast by Location, 2023-2033 (US$ million)
Figure 212 MEA Clinical Trial Supplies Market Share Forecast by Location, 2023 & 2033 (%)
Figure 213 MEA Clinical Trial Supplies Market Forecast by Type, 2023-2033 (US$ million)
Figure 214 MEA Clinical Trial Supplies Market Share Forecast by Type, 2023 & 2033 (%)
Figure 215 MEA Clinical Trial Supplies Market Forecast by Services, 2023-2033 (US$ million)
Figure 216 MEA Clinical Trial Supplies Market Share Forecast by Services, 2023 & 2033 (%)
Figure 217 MEA Clinical Trial Supplies Market Forecast by Manufacturing, 2023-2033 (US$ million)
Figure 218 MEA Clinical Trial Supplies Market Share Forecast by Manufacturing, 2023 & 2033 (%)
Figure 219 MEA Clinical Trial Supplies Market Forecast by Logistics & Distribution, 2023-2033 (US$ million)
Figure 220 MEA Clinical Trial Supplies Market Share Forecast by Logistics & Distribution, 2023 & 2033 (%)
Figure 221 MEA Clinical Trial Supplies Market Forecast by Therapeutic Areas, 2023-2033 (US$ million)
Figure 222 MEA Clinical Trial Supplies Market Share Forecast by Therapeutic Areas, 2023 & 2033 (%)
Figure 223 MEA Clinical Trial Supplies Market Forecast by Phase, 2023-2033 (US$ million)
Figure 224 MEA Clinical Trial Supplies Market Share Forecast by Phase, 2023 & 2033 (%)
Figure 225 MEA Clinical Trial Supplies Market Forecast by End-User, 2023-2033 (US$ million)
Figure 226 MEA Clinical Trial Supplies Market Share Forecast by Phase, 2023 & 2033 (%)
Figure 227 South Africa Clinical Trial Supplies Market Forecast, 2023-2033 (US$ million, AGR %)
Figure 228 Saudi Arabia Clinical Trial Supplies Market Forecast, 2023-2033 (US$ million, AGR %)
Figure 229 Turkey Clinical Trial Supplies Market Forecast, 2023-2033 (US$ million, AGR %)
Figure 230 UAE Clinical Trial Supplies Market Forecast, 2023-2033 (US$ million, AGR %)
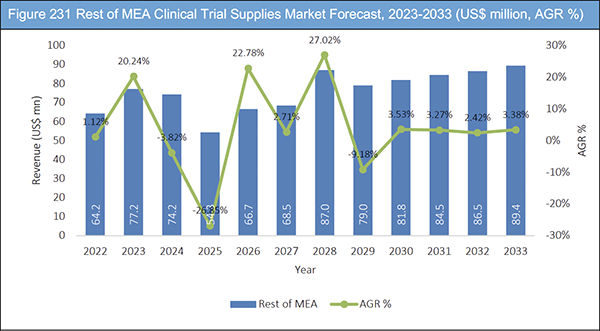
Figure 231 Rest of MEA Clinical Trial Supplies Market Forecast, 2023-2033 (US$ million, AGR %)
Figure 232 Clinical Trial Supplies Market: Company Share, 2021
Figure 233 Thermo Fisher Scientific Inc.: Net Revenue, 2017-2021 (US$ million, AGR%)
Figure 234 Thermo Fisher Scientific Inc.: R&D, 2017-2021 (US$ million, AGR%)
Figure 235 Thermo Fisher Scientific Inc.: Gross Profit, 2017-2021 (US$ million, AGR%)
Figure 236 Thermo Fisher Scientific Inc.: Regional Market Shares, 2021
Figure 237 Catalent, Inc.: Net Revenue, 2017-2021 (US$ million, AGR%)
Figure 238 Catalent, Inc.: EBITDA, 2017-2021 (US$ million, AGR%)
Figure 239 Catalent, Inc.: Net Income, 2017-2021 (US$ million, AGR%)
Figure 240 Catalent, Inc.: Regional Market Shares, 2021
Figure 241 Eurofins Scientific SE: Net Revenue, 2017-2021 (US$ million, AGR%)
Figure 242 Eurofins Scientific SE: Operating Income, 2017-2021 (US$ million, AGR%)
Figure 243 Eurofins Scientific SE: EBITDA, 2017-2021 (US$ million, AGR%)
Figure 244 Eurofins Scientific SE: Net Income, 2017-2021 (US$ million, AGR%)
Figure 245 Eurofins Scientific SE: Regional Market Shares, 2021
Figure 246 Lonza: Net Revenue, 2017-2021 (US$ million, AGR%)
Figure 247 Lonza: EBIT, 2017-2021 (US$ million, AGR%)
Figure 248 Lonza: Gross Profit, 2017-2021 (US$ million, AGR%)
Figure 249 Clinigen Group plc: Net Revenue, 2017-2021 (US$ million, AGR%)
Figure 250 Clinigen Group plc: EBITDA, 2017-2021 (US$ million, AGR%)
Figure 251 Clinigen Group plc: Net Income, 2017-2021 (US$ million, AGR%)
Figure 252 AmerisourceBergen Corporation: Net Revenue, 2017-2021 (US$ million, AGR%)
Figure 253 AmerisourceBergen Corporation: Operating Income, 2017-2021 (US$ million, AGR%)
Figure 254 AmerisourceBergen Corporation: EBITDA, 2017-2021 (US$ million, AGR%)
Figure 255 AmerisourceBergen Corporation: Net Income, 2017-2021 (US$ million, AGR%)
Figure 256 DHL: Net Revenue, 2017-2021 (US$ million, AGR%)
Figure 257 DHL: EBIT, 2017-2021 (US$ million, AGR%)
Figure 258 DHL: Gross Profit, 2017-2021 (US$ million, AGR%)
Figure 259 DHL: Net Income Profit, 2017-2021 (US$ million, AGR %)
Figure 260 DHL: Operating Income, 2017-2021 (US$ million, AGR%)
Figure 261 DHL: Regional Market Share, 2017-2021 (US$ million, AGR%)
Figure 262 Sharp Corporation: Net Revenue, 2017-2021 (US$ million, AGR%)
Figure 263 Sharp Corporation: EBITDA, 2017-2021 (US$ million, AGR%)
Figure 264 Sharp Corporation: Net Income, 2017-2021 (US$ million, AGR%)
Figure 265 Sharp Corporation: Operating Income, 2017-2021 (US$ million, AGR%)
Figure 266 Sharp Corporation: Gross Profit, 2017-2021 (US$ million, AGR%)
Figure 267 IQVIA Inc.: Net Revenue, 2017-2021 (US$ million, AGR%)
Figure 268 IQVIA Inc.: EBIT, 2017-2021 (US$ million, AGR%)
Figure 269 IQVIA Inc.: Gross Profit, 2017-2021 (US$ million, AGR%)
Figure 270 IQVIA Inc.: Net Income Profit, 2017-2021 (US$ million, AGR%)
Figure 271 IQVIA Inc.: Operating Income, 2017-2021 (US$ million, AGR%)
Figure 272 IQVIA Inc.: Regional Market Share, 2017-2021 (US$ million, AGR%)
ページTOPに戻る
Summary
Report Details
The Clinical Trial Supplies Market Report 2023-2033: This report will prove invaluable to leading firms striving for new revenue pockets if they wish to better understand the industry and its underlying dynamics. It will be useful for companies that would like to expand into different industries or to expand their existing operations in a new region.
Increasing Demand for Clinical Trial Outsourcing is driving the Demand for Clinical Trial Supplies Market
Downsizing and cost-cutting are important factors for large and mid-size pharmaceutical companies to outsource clinical trials, as CRO expertise in a specific therapeutic in a market where the company lacks experience with regulatory processes, operational expertise, and the ability to use manpower for other activities at the time of increasing workload. Furthermore, due to the increasing process complexity and cost of clinical studies, pharmaceutical manufacturers have been forced to outsource clinical trial supplies and supply them to research sites for reducing cost and time. Clinical supply firms are concentrating on data sharing to assist them build a solid supply chain for clinical consumables during clinical trials. This factor will have a favourable impact on the revenue growth of the clinical trial supplies market throughout the forecast period.
Unavailability of Storage Facilities in across Multiple Nations May Hamper the Expansion Clinical Trial Supplies Market
Certain clinical materials must be stored under specific climatic conditions, and such facilities are critical before conducting clinical studies. However, in countries such as Mexico, Brazil, and others, lack of clinical supply storage facilities and infrastructure may impede market acceptance of clinical trial supplies services. It is critical, for example, to determine early on if important components of the cold chain must be held in controlled temperature facilities if things are stored. Transportation of clinical supplies from cold storage to clinical sites is difficult, which is projected to limit revenue growth in this market to some extent.
What Questions Should You Ask before Buying a Market Research Report?
• How is the clinical trial supplies market evolving?
• What is driving and restraining the clinical trial supplies market?
• How will each clinical trial supplies submarket segment grow over the forecast period and how much revenue will these submarkets account for in 2033?
• How will the market shares for each clinical trial supplies submarket develop from 2023 to 2033?
• What will be the main driver for the overall market from 2023 to 2033?
• Will leading clinical trial supplies markets broadly follow the macroeconomic dynamics, or will individual national markets outperform others?
• How will the market shares of the national markets change by 2033 and which geographical region will lead the market in 2033?
• Who are the leading players and what are their prospects over the forecast period?
• What are the clinical trial supplies projects for these leading companies?
• How will the industry evolve during the period between 2023 and 2033? What are the implications of clinical trial supplies projects taking place now and over the next 10 years?
• Is there a greater need for product commercialisation to further scale the clinical trial supplies market?
• Where is the clinical trial supplies market heading and how can you ensure you are at the forefront of the market?
• What are the best investment options for new product and service lines?
• What are the key prospects for moving companies into a new growth path and C-suite?
You need to discover how this will impact the clinical trial supplies market today, and over the next 10 years:
• Our 423-page report provides 187 tables and 272 charts/graphs exclusively to you.
• The report highlights key lucrative areas in the industry so you can target them – NOW.
• It contains in-depth analysis of global, regional and national sales and growth.
• It highlights for you the key successful trends, changes and revenue projections made by your competitors.
This report tells you TODAY how the clinical trial supplies market will develop in the next 10 years, and in line with the variations in COVID-19 economic recession and bounce. This market is more critical now than at any point over the last 10 years.
Forecasts to 2033 and other analyses reveal commercial prospects
• In addition to revenue forecasting to 2033, our new study provides you with recent results, growth rates, and market shares.
• You will find original analyses, with business outlooks and developments.
• Discover qualitative analyses (including market dynamics, drivers, opportunities, restraints and challenges), cost structure, impact of rising clinical trial supplies prices and recent developments.
This report includes data analysis and invaluable insight into how COVID-19 will affect the industry and your company. Four COVID-19 recovery patterns and their impact, namely, “V”, “L”, “W” and “U” are discussed in this report.
Segments Covered in the Report
Location
• Offshore Clinical Site
• Domestic Clinical Site
Type
• Small Molecule Products
• Biologic Products
• Medical Devices
Services
• Manufacturing
– IMPs and INDs
– Placebos
– Assays and Testkits
– Others
• Logistics & Distribution
– Cold Chain Distribution
– Non-cold Chain
• Storage & Retention
• Packaging and Labeling
• Comparator Sourcing
• Other CTS Services
Therapeutic Areas
• Oncology
• CNS and Mental Disorders
• Cardiovascular Disease (CVD)
• Infectious Disease
• Immunology Disease
• Blood Disorders
• Metabolic Disorders
• Digestive Disorders
• Other Therapeutic Areas
Phase
• Phase-I
• Phase-II
• Phase-III
• Phase-IV
End-User
• Contract Research Organizations
• Pharmaceutical and Biotechnology Companies
• Medical Device Companies
• Other End-Users
In addition to the revenue predictions for the overall world market and segments, you will also find revenue forecasts for five regional and 23 leading national markets:
North America
• U.S.
• Canada
Europe
• Germany
• UK
• France
• Italy
• Spain
• Russia
• Rest of Europe
Asia Pacific
• China
• India
• Japan
• South Korea
• Australia
• Rest of Asia Pacific
Latin America
• Brazil
• Mexico
• Rest of Latin America
MEA
• South Africa
• Saudi Arabia
• Turkey
• UAE
• Rest of MEA
The report also includes profiles and for some of the leading companies in the Clinical Trial Supplies Market, 2023 to 2033, with a focus on this segment of these companies’ operations.
Leading companies and the potential for market growth
• ADAllen Pharma
• AmerisourceBergen Corporation
• Ancillare
• Biocair
• Catalent, Inc.
• Clinigen Group plc
• Coghlan Group
• COREX Logistics
• DHL
• Durbin
• Endpoint Clinical
• Eurofins Scientific SE
• Inizio (UDG Healthcare plc)
• IQVIA Inc.
• KLIFO
• Liveo Research
• Lonza
• Marken (A UPS Company)
• Movianto
• Myonex
• N-SIDE
• Parexel
• PCI Pharma Services
• Piramal Pharma Solutions
• Recipharm AB
• Rubicon Research Pvt S.A.
• Seveillar Clinical Supplies Services
• Sharp Corporation
• SIRO Clinpharm
• Thermo Fisher Scientific Inc.
Overall world revenue for Clinical Trial Supplies Market, 2023 to 2033 in terms of value the market will surpass US$ 2,819.2 million in 2023, our work calculates. We predict strong revenue growth through to 2033. Our work identifies which organizations hold the greatest potential. Discover their capabilities, progress, and commercial prospects, helping you stay ahead.
How will the Clinical Trial Supplies Market, 2023 to 2033 report help you?
In summary, our 420+ page report provides you with the following knowledge:
• Revenue forecasts to 2033 for Clinical Trial Supplies Market, 2023 to 2033, with forecasts for location, type, services, therapeutic areas, phase, and end-user, each forecast at a global and regional level – discover the industry’s prospects, finding the most lucrative places for investments and revenues.
• Revenue forecasts to 2033 for five regional and 19 key national markets – See forecasts for the Clinical Trial Supplies Market, 2023 to 2033 market in North America, Europe, Asia-Pacific, Latin America, and MEA. Also forecasted is the market in the US, Canada, Mexico, Brazil, Germany, France, UK, Italy, China, India, Japan, and Australia among other prominent economies.
• Prospects for established firms and those seeking to enter the market – including company profiles for 30 of the major companies involved in the Clinical Trial Supplies Market, 2023 to 2033.
Find quantitative and qualitative analyses with independent predictions. Receive information that only our report contains, staying informed with invaluable business intelligence.
Information found nowhere else
With our new report, you are less likely to fall behind in knowledge or miss out on opportunities. See how our work could benefit your research, analyses, and decisions. Visiongain’s study is for everybody needing commercial analyses for the Clinical Trial Supplies Market, 2023 to 2033, market-leading companies. You will find data, trends and predictions.
ページTOPに戻る
Table of Contents
Table of Contents
1. Report Overview
1.1 Objectives of the Study
1.2 Introduction to Clinical Trial Supplies Market
1.3 What This Report Delivers
1.4 Why You Should Read This Report
1.5 Key Questions Answered by This Analytical Report
1.6 Who is This Report for?
1.7 Methodology
1.7.1 Market Definitions
1.7.2 Market Evaluation & Forecasting Methodology
1.7.3 Data Validation
1.7.3.1 Primary Research
1.7.3.2 Secondary Research
1.8 Frequently Asked Questions (FAQs)
1.9 Associated Visiongain Reports
1.10 About Visiongain
2 Executive Summary
3 Market Overview
3.1 Key Findings
3.2 Market Dynamics
3.2.1 Market Driving Factors
3.2.1.1 Increasing Demand for Clinical Trial Outsourcing
3.2.1.2 Rising Demand for Biologics Propelling Growth of Cold Chain Supplies
3.2.1.3 Increasing Investments in the Development of Novel Pharmaceuticals
3.2.1.4 Technology Advancements are Propelling Market Expansion
3.2.2 Market Restraining
3.2.2.1 Availability of Storage Facilities in Each Country
3.2.2.2 Lack of Comparator Sourcing
3.2.2.3 High Costs Associated with Drug Developments
3.2.3 Market Opportunities
3.2.3.1 Increasing Opportunities for Emerging Markets
3.2.3.2 Cut in High Costs Expected to Propel Market Growth
3.2.3.3 Integration of Technical Solutions
3.3 COVID-19 Impact Analysis
3.4 PEST Analysis
3.4.1 Political Factors
3.4.2 Economic Factors
3.4.3 Social Factors
3.4.4 Technological Factors
4 Clinical Trial Supplies Market Analysis by Location
4.1 Key Findings
4.2 Location Segment: Market Attractiveness Index
4.3 Clinical Trial Supplies Market Size Estimation and Forecast by Location
4.4 Offshore Clinical Site
4.4.1 Market Size by Region, 2023-2033 (US$ Mn)
4.4.2 Market Share by Region, 2023 & 2033 (%)
4.5 Domestic Clinical Site
4.5.1 Market Size by Region, 2023-2033 (US$ Mn)
4.5.2 Market Share by Region, 2023 & 2033 (%)
5 Clinical Trial Supplies Market Analysis by Type
5.1 Key Findings
5.2 Type Segment: Market Attractiveness Index
5.3 Clinical Trial Supplies Market Size Estimation and Forecast by Type
5.4 Small Molecule Products
5.4.1 Market Size by Region, 2023-2033 (US$ Mn)
5.4.2 Market Share by Region, 2023 & 2033 (%)
5.5 Biologic Products
5.5.1 Market Size by Region, 2023-2033 (US$ Mn)
5.5.2 Market Share by Region, 2023 & 2033 (%)
5.6 Medical Devices
5.6.1 Market Size by Region, 2023-2033 (US$ Mn)
5.6.2 Market Share by Region, 2023 & 2033 (%)
6 Clinical Trial Supplies Market Analysis by Services
6.1 Key Findings
6.2 Services Segment: Market Attractiveness Index
6.3 Clinical Trial Supplies Market Size Estimation and Forecast by Services
6.4 Manufacturing
6.4.1 Market Size by Region, 2023-2033 (US$ Mn)
6.4.2 Market Share by Region, 2023 & 2033 (%)
6.4.3 IMPs and INDs
6.4.4 Market Size by Region, 2023-2033 (US$ Mn)
6.4.5 Market Share by Region, 2023 & 2033 (%)
6.4.6 Placebos
6.4.7 Market Size by Region, 2023-2033 (US$ Mn)
6.4.8 Market Share by Region, 2023 & 2033 (%)
6.4.9 Assays and Test kits
6.4.10 Market Size by Region, 2023-2033 (US$ Mn)
6.4.11 Market Share by Region, 2023 & 2033 (%)
6.4.12 Others
6.4.13 Market Size by Region, 2023-2033 (US$ Mn)
6.4.14 Market Share by Region, 2023 & 2033 (%)
6.5 Logistics & Distribution
6.5.1 Market Size by Region, 2023-2033 (US$ Mn)
6.5.2 Market Share by Region, 2023 & 2033 (%)
6.5.3 Cold Chain Distribution
6.5.4 Market Size by Region, 2023-2033 (US$ Mn)
6.5.5 Market Share by Region, 2023 & 2033 (%)
6.5.6 Non-cold Chain
6.5.7 Market Size by Region, 2023-2033 (US$ Mn)
6.5.8 Market Share by Region, 2023 & 2033 (%)
6.6 Storage & Retention
6.6.1 Market Size by Region, 2023-2033 (US$ Mn)
6.6.2 Market Share by Region, 2023 & 2033 (%)
6.7 Packaging and Labelling
6.7.1 Market Size by Region, 2023-2033 (US$ Mn)
6.7.2 Market Share by Region, 2023 & 2033 (%)
6.8 Comparator Sourcing
6.8.1 Market Size by Region, 2023-2033 (US$ Mn)
6.8.2 Market Share by Region, 2023 & 2033 (%)
6.9 Other CTS Services
6.9.1 Market Size by Region, 2023-2033 (US$ Mn)
6.9.2 Market Share by Region, 2023 & 2033 (%)
7 Clinical Trial Supplies Market Analysis by Therapeutic Areas
7.1 Key Findings
7.2 Therapeutic Areas Segment: Market Attractiveness Index
7.3 Clinical Trial Supplies Market Size Estimation and Forecast by Therapeutic Areas
7.4 Oncology
7.4.1 Market Size by Region, 2023-2033 (US$ Mn)
7.4.2 Market Share by Region, 2023 & 2033 (%)
7.5 CNS and Mental Disorders
7.5.1 Market Size by Region, 2023-2033 (US$ Mn)
7.5.2 Market Share by Region, 2023 & 2033 (%)
7.6 Cardiovascular Disease (CVD)
7.6.1 Market Size by Region, 2023-2033 (US$ Mn)
7.6.2 Market Share by Region, 2023 & 2033 (%)
7.7 Infectious Disease
7.7.1 Market Size by Region, 2023-2033 (US$ Mn)
7.7.2 Market Share by Region, 2023 & 2033 (%)
7.8 Immunological Diseases
7.8.1 Market Size by Region, 2023-2033 (US$ Mn)
7.8.2 Market Share by Region, 2023 & 2033 (%)
7.9 Blood Disorders
7.9.1 Market Size by Region, 2023-2033 (US$ Mn)
7.9.2 Market Share by Region, 2023 & 2033 (%)
7.10 Metabolic Disorders
7.10.1 Market Size by Region, 2023-2033 (US$ Mn)
7.10.2 Market Share by Region, 2023 & 2033 (%)
7.11 Digestive Disorders
7.11.1 Market Size by Region, 2023-2033 (US$ Mn)
7.11.2 Market Share by Region, 2023 & 2033 (%)
7.12 Other Therapeutic Areas
7.12.1 Market Size by Region, 2023-2033 (US$ Mn)
7.12.2 Market Share by Region, 2023 & 2033 (%)
8 Clinical Trial Supplies Market Analysis by Phase
8.1 Key Findings
8.2 Phase Segment: Market Attractiveness Index
8.3 Clinical Trial Supplies Market Size Estimation and Forecast by Phase
8.4 Phase-I
8.4.1 Market Size by Region, 2023-2033 (US$ Mn)
8.4.2 Market Share by Region, 2023 & 2033 (%)
8.5 Phase-II
8.5.1 Market Size by Region, 2023-2033 (US$ Mn)
8.5.2 Market Share by Region, 2023 & 2033 (%)
8.6 Phase-III
8.6.1 Market Size by Region, 2023-2033 (US$ Mn)
8.6.2 Market Share by Region, 2023 & 2033 (%)
8.7 Phase-IV
8.7.1 Market Size by Region, 2023-2033 (US$ Mn)
8.7.2 Market Share by Region, 2023 & 2033 (%)
9 Clinical Trial Supplies Market Analysis by End-User
9.1 Key Findings
9.2 End-User Segment: Market Attractiveness Index
9.3 Clinical Trial Supplies Market Size Estimation and Forecast by End-User
9.4 Contract Research Organizations
9.4.1 Market Size by Region, 2023-2033 (US$ Mn)
9.4.2 Market Share by Region, 2023 & 2033 (%)
9.5 Pharmaceutical and Biotechnology Companies
9.5.1 Market Size by Region, 2023-2033 (US$ Mn)
9.5.2 Market Share by Region, 2023 & 2033 (%)
9.6 Medical Device Companies
9.6.1 Market Size by Region, 2023-2033 (US$ Mn)
9.6.2 Market Share by Region, 2023 & 2033 (%)
9.7 Other End-Users
9.7.1 Market Size by Region, 2023-2033 (US$ Mn)
9.7.2 Market Share by Region, 2023 & 2033 (%)
10 Clinical Trial Supplies Market Analysis by Region
10.1 Key Findings
10.2 Regional Market Size Estimation and Forecast
11 North America Clinical Trial Supplies Market Analysis
11.1 Key Findings
11.2 North America Clinical Trial Supplies Market Attractiveness Index
11.3 North America Clinical Trial Supplies Market by Country, 2023, 2028 & 2033 (US$ bn)
11.4 North America Clinical Trial Supplies Market Size Estimation and Forecast by Country
11.5 North America Clinical Trial Supplies Market Size Estimation and Forecast by Location
11.6 North America Clinical Trial Supplies Market Size Estimation and Forecast by Type
11.7 North America Clinical Trial Supplies Market Size Estimation and Forecast by Services
11.7.1 North America Clinical Trial Supplies Market Size Estimation and Forecast by Manufacturing
11.7.2 North America Clinical Trial Supplies Market Size Estimation and Forecast by Logistics & Distribution
11.8 North America Clinical Trial Supplies Market Size Estimation and Forecast by Therapeutic Areas
11.9 North America Clinical Trial Supplies Market Size Estimation and Forecast by Phase
11.10 North America Clinical Trial Supplies Market Size Estimation and Forecast by End-User
11.11 U.S. Clinical Trial Supplies Market Analysis
11.12 Canada Clinical Trial Supplies Market Analysis
12 Europe Clinical Trial Supplies Market Analysis
12.1 Key Findings
12.2 Europe Clinical Trial Supplies Market Attractiveness Index
12.3 Europe Clinical Trial Supplies Market by Country, 2023, 2028 & 2033 (US$ bn)
12.4 Europe Clinical Trial Supplies Market Size Estimation and Forecast by Country
12.5 Europe Clinical Trial Supplies Market Size Estimation and Forecast by Location
12.6 Europe Clinical Trial Supplies Market Size Estimation and Forecast by Type
12.7 Europe Clinical Trial Supplies Market Size Estimation and Forecast by Services
12.7.1 Europe Clinical Trial Supplies Market Size Estimation and Forecast by Manufacturing
12.7.2 Europe Clinical Trial Supplies Market Size Estimation and Forecast by Logistics & Distribution
12.8 Europe Clinical Trial Supplies Market Size Estimation and Forecast by Therapeutic Areas
12.9 Europe Clinical Trial Supplies Market Size Estimation and Forecast by Phase
12.10 Europe Clinical Trial Supplies Market Size Estimation and Forecast by End-User
12.11 Germany Clinical Trial Supplies Market Analysis
12.12 UK Clinical Trial Supplies Market Analysis
12.13 France Clinical Trial Supplies Market Analysis
12.14 Italy Clinical Trial Supplies Market Analysis
12.15 Spain Clinical Trial Supplies Market Analysis
12.16 Russia Clinical Trial Supplies Market Analysis
12.17 Rest of Europe Clinical Trial Supplies Market Analysis
13 Asia Pacific Clinical Trial Supplies Market Analysis
13.1 Key Findings
13.2 Asia Pacific Clinical Trial Supplies Market Attractiveness Index
13.3 Asia Pacific Clinical Trial Supplies Market by Country, 2023, 2028 & 2033 (US$ bn)
13.4 Asia Pacific Clinical Trial Supplies Market Size Estimation and Forecast by Country
13.5 Asia Pacific Clinical Trial Supplies Market Size Estimation and Forecast by Location
13.6 Asia Pacific Clinical Trial Supplies Market Size Estimation and Forecast by Type
13.7 Asia Pacific Clinical Trial Supplies Market Size Estimation and Forecast by Services
13.7.1 Asia Pacific Clinical Trial Supplies Market Size Estimation and Forecast by Manufacturing
13.7.2 Asia Pacific Clinical Trial Supplies Market Size Estimation and Forecast by Logistics & Distribution
13.8 Asia Pacific Clinical Trial Supplies Market Size Estimation and Forecast by Therapeutic Areas
13.9 Asia Pacific Clinical Trial Supplies Market Size Estimation and Forecast by Phase
13.10 Asia Pacific Clinical Trial Supplies Market Size Estimation and Forecast by End-User
13.11 China Clinical Trial Supplies Market Analysis
13.12 India Clinical Trial Supplies Market Analysis
13.13 Japan Clinical Trial Supplies Market Analysis
13.14 South Korea Clinical Trial Supplies Market Analysis
13.15 Australia Clinical Trial Supplies Market Analysis
13.16 Rest of Asia-Pacific Clinical Trial Supplies Market Analysis
14 Latin America Clinical Trial Supplies Market Analysis
14.1 Key Findings
14.2 Latin America Clinical Trial Supplies Market Attractiveness Index
14.3 Latin America Clinical Trial Supplies Market by Country, 2023, 2028 & 2033 (US$ bn)
14.4 Latin America Clinical Trial Supplies Market Size Estimation and Forecast by Country
14.5 Latin America Clinical Trial Supplies Market Size Estimation and Forecast by Location
14.6 Latin America Clinical Trial Supplies Market Size Estimation and Forecast by Type
14.7 Latin America Clinical Trial Supplies Market Size Estimation and Forecast by Services
14.7.1 Latin America Clinical Trial Supplies Market Size Estimation and Forecast by Manufacturing
14.7.2 Latin America Clinical Trial Supplies Market Size Estimation and Forecast by Logistics & Distribution
14.8 Latin America Clinical Trial Supplies Market Size Estimation and Forecast by Therapeutic Areas
14.9 Latin America Clinical Trial Supplies Market Size Estimation and Forecast by Phase
14.10 Latin America Clinical Trial Supplies Market Size Estimation and Forecast by End-User
14.11 Brazil Clinical Trial Supplies Market Analysis
14.12 Mexico Clinical Trial Supplies Market Analysis
14.13 Rest of Latin America Clinical Trial Supplies Market Analysis
15 MEA Clinical Trial Supplies Market Analysis
15.1 Key Findings
15.2 MEA Clinical Trial Supplies Market Attractiveness Index
15.3 MEA Clinical Trial Supplies Market by Country, 2023, 2028 & 2033 (US$ bn)
15.4 MEA Clinical Trial Supplies Market Size Estimation and Forecast by Country
15.5 MEA Clinical Trial Supplies Market Size Estimation and Forecast by Location
15.6 MEA Clinical Trial Supplies Market Size Estimation and Forecast by Type
15.7 MEA Clinical Trial Supplies Market Size Estimation and Forecast by Services
15.7.1 MEA Clinical Trial Supplies Market Size Estimation and Forecast by Manufacturing
15.7.2 MEA Clinical Trial Supplies Market Size Estimation and Forecast by Logistics & Distribution
15.8 MEA Clinical Trial Supplies Market Size Estimation and Forecast by Therapeutic Areas
15.9 MEA Clinical Trial Supplies Market Size Estimation and Forecast by Phase
15.10 MEA Clinical Trial Supplies Market Size Estimation and Forecast by End-User
15.11 South Africa Clinical Trial Supplies Market Analysis
15.12 Saudi Arabia Clinical Trial Supplies Market Analysis
15.13 Turkey Clinical Trial Supplies Market Analysis
15.14 UAE Clinical Trial Supplies Market Analysis
15.15 Rest of MEA Clinical Trial Supplies Market Analysis
16 Company Profiles
16.1 Competitive Landscape, 2021
16.2 Strategic Outlook
16.3 Thermo Fisher Scientific Inc.
16.3.1 Company Snapshot
16.3.2 Company Overview
16.3.3 Financial Analysis
16.3.3.1 Net Revenue, 2017-2021
16.3.3.2 R&D, 2017-2021
16.3.3.3 Gross Profit, 2017-2021
16.3.3.4 Regional Market Shares, 2021
16.3.4 Product Benchmarking
16.3.5 Strategic Outlook
16.4 Catalent, Inc.
16.4.1 Company Snapshot
16.4.2 Company Overview
16.4.3 Financial Analysis
16.4.3.1 Net Revenue, 2017-2021
16.4.3.2 EBITDA, 2017-2021
16.4.3.3 Net Income, 2017-2021
16.4.3.4 Regional Market Shares, 2021
16.4.4 Product Benchmarking
16.4.5 Strategic Outlook
16.5 Piramal Pharma Solutions
16.5.1 Company Snapshot
16.5.2 Company Overview
16.5.3 Product Benchmarking
16.5.4 Strategic Outlook
16.6 Eurofins Scientific SE
16.6.1 Company Snapshot
16.6.2 Company Overview
16.6.3 Financial Analysis
16.6.3.1 Net Revenue, 2017-2021
16.6.3.2 Operating Income, 2017-2021
16.6.3.3 EBITDA, 2017-2021
16.6.3.4 Net Income, 2017-2021
16.6.3.5 Regional Market Shares, 2021
16.6.4 Product Benchmarking
16.7 Lonza
16.7.1 Company Snapshot
16.7.2 Company Overview
16.7.3 Financial Analysis
16.7.3.1 Net Revenue, 2017-2021
16.7.3.2 EBIT, 2017-2021
16.7.3.3 Gross Profit, 2017-2021
16.7.4 Product Benchmarking
16.7.5 Strategic Outlook
16.8 Clinigen Group plc
16.8.1 Company Snapshot
16.8.2 Company Overview
16.8.3 Financial Analysis
16.8.3.1 Net Revenue, 2017-2021
16.8.3.2 EBITDA, 2017-2021
16.8.3.3 Net Income, 2017-2021
16.8.4 Product Benchmarking
16.8.5 Strategic Outlook
16.9 AmerisourceBergen Corporation
16.9.1 Company Snapshot
16.9.2 Company Overview
16.9.3 Financial Analysis
16.9.3.1 Net Revenue, 2017-2021
16.9.3.2 Operating Income, 2017-2021
16.9.3.3 EBITDA, 2017-2021
16.9.3.4 Net Income, 2017-2021
16.9.4 Product Benchmarking
16.9.5 Strategic Outlook
16.10 DHL
16.10.1 Company Snapshot
16.10.2 Company Overview
16.10.3 Financial Analysis
16.10.3.1 Net Revenue, 2017-2021
16.10.3.2 EBITDA, 2017-2021
16.10.3.3 Gross Profit, 2017-2021
16.10.3.4 Net Income, 2017-2021
16.10.3.5 Operating Income, 2017-2021
16.10.3.6 Regional Market Share, 2017-2021
16.10.4 Product Benchmarking
16.10.5 Strategic Outlook
16.11 Sharp Corporation
16.11.1 Company Snapshot
16.11.2 Company Overview
16.11.3 Financial Analysis
16.11.3.1 Net Revenue, 2017-2021
16.11.3.2 EBITDA, 2017-2021
16.11.3.3 Net Income, 2017-2021
16.11.3.4 Operating Income, 2017-2021
16.11.3.5 Gross Profit, 2017-2021
16.11.4 Product Benchmarking
16.11.5 Strategic Outlook
16.12 IQVIA Inc.
16.12.1 Company Snapshot
16.12.2 Company Overview
16.12.3 Financial Analysis
16.12.3.1 Net Revenue, 2017-2021
16.12.3.2 EBITDA, 2017-2021
16.12.3.3 Gross Profit, 2017-2021
16.12.3.4 Net Income, 2017-2021
16.12.3.5 Operating Income, 2017-2021
16.12.3.6 Regional Market Share, 2017-2021
16.12.4 Product Benchmarking
16.12.5 Strategic Outlook
16.13 Parexel
16.13.1 Company Snapshot
16.13.2 Company Overview
16.13.3 Product Benchmarking
16.13.4 Strategic Outlook
16.14 Biocair
16.14.1 Company Snapshot
16.14.2 Company Overview
16.14.3 Product Benchmarking
16.14.4 Strategic Outlook
16.15 Liveo Research
16.15.1 Company Snapshot
16.15.2 Company Overview
16.15.3 Product Benchmarking
16.15.4 Strategic Outlook
16.16 Marken (A UPS Company)
16.16.1 Company Snapshot
16.16.2 Company Overview
16.16.3 Product Benchmarking
16.16.4 Strategic Outlook
16.17 PCI Pharma Services
16.17.1 Company Snapshot
16.17.2 Company Overview
16.17.3 Product Benchmarking
16.17.4 Strategic Outlook
16.18 Ancillare
16.18.1 Company Snapshot
16.18.2 Company Overview
16.18.3 Product Benchmarking
16.18.4 Strategic Outlook
16.19 N-SIDE
16.19.1 Company Snapshot
16.19.2 Company Overview
16.19.3 Product Benchmarking
16.19.4 Strategic Outlook
16.20 Rubicon Research Pvt S.A.
16.20.1 Company Snapshot
16.20.2 Company Overview
16.20.3 Product Benchmarking
16.20.4 Strategic Outlook
16.21 Myonex
16.21.1 Company Snapshot
16.21.2 Company Overview
16.21.3 Product Benchmarking
16.21.4 Strategic Outlook
16.22 Endpoint Clinical
16.22.1 Company Snapshot
16.22.2 Company Overview
16.22.3 Product Benchmarking
16.22.4 Strategic Outlook
16.23 Recipharm AB
16.23.1 Company Snapshot
16.23.2 Company Overview
16.23.3 Product Benchmarking
16.23.4 Strategic Outlook
16.24 COREX Logistics
16.24.1 Company Snapshot
16.24.2 Company Overview
16.24.3 Product Benchmarking
16.25 Movianto
16.25.1 Company Snapshot
16.25.2 Company Overview
16.25.3 Product Benchmarking
16.26 Durbin
16.26.1 Company Snapshot
16.26.2 Company Overview
16.26.3 Product Benchmarking
16.27 SIRO Clinpharm
16.27.1 Company Snapshot
16.27.2 Company Overview
16.27.3 Product Benchmarking
16.28 Inizio (UDG Healthcare plc)
16.28.1 Company Snapshot
16.28.2 Company Overview
16.28.3 Product Benchmarking
16.29 KLIFO
16.29.1 Company Snapshot
16.29.2 Company Overview
16.29.3 Product Benchmarking
16.30 ADAllen Pharma
16.30.1 Company Snapshot
16.30.2 Company Overview
16.30.3 Product Benchmarking
16.31 Seveillar Clinical Supplies Services
16.31.1 Company Snapshot
16.31.2 Company Overview
16.31.3 Product Benchmarking
16.32 Coghlan Group
16.32.1 Company Snapshot
16.32.2 Company Overview
16.32.3 Product Benchmarking
16.32.4 Strategic Outlook
17 Conclusion and Recommendations
17.1 Concluding Remarks from Visiongain
17.2 Recommendations for Market Players
17.2.1 Know Your Contract
17.2.2 Establish Clear Roles And Responsibilities
17.2.3 Create A Symbiotic Relationship
List of Tables
Table 1 Clinical Trial Supplies Market Snapshot, 2023 & 2033 (US$ million, CAGR %)
Table 2 Global Clinical Trial Supplies Market Forecast by Location, 2023-2033 (US$ Mn, AGR%, CAGR%)
Table 3 Offshore Clinical Site Segment Market Forecast by Region, 2023-2033 (US$ Mn, AGR%, CAGR%)
Table 4 Domestic Clinical Site Segment Market Forecast by Region, 2023-2033 (US$ Mn, AGR%, CAGR%)
Table 5 Global Clinical Trial Supplies Market Forecast by Type, 2023-2033 (US$ Mn, AGR%, CAGR%)
Table 6 Small Molecule Products Segment Market Forecast by Region, 2023-2033 (US$ Mn, AGR%, CAGR %)
Table 7 Biologic Products Segment Market Forecast by Region, 2023-2033 (US$ Mn, AGR%, CAGR%)
Table 8 Medical Devices Segment Market Forecast by Region, 2023-2033 (US$ Mn, AGR%, CAGR %)
Table 9 Global Clinical Trial Supplies Market Forecast by Services, 2023-2033 (US$ Mn, AGR%, CAGR%)
Table 10 Manufacturing Segment Market Forecast by Region, 2023-2033 (US$ Mn, AGR%, CAGR %)
Table 11 IMPs and INDs Segment Market Forecast by Region, 2023-2033 (US$ Mn, AGR%, CAGR%)
Table 12 Placebos Segment Market Forecast by Region, 2023-2033 (US$ Mn, AGR%, CAGR%)
Table 13 Assays and Testkits Segment Market Forecast by Region, 2023-2033 (US$ Mn, AGR%, CAGR%)
Table 14 Others Segment Market Forecast by Region, 2023-2033 (US$ Mn, AGR%, CAGR%)
Table 15 Logistics & Distribution Segment Market Forecast by Region, 2023-2033 (US$ Mn, AGR%, CAGR%)
Table 16 Cold Chain Distribution Segment Market Forecast by Region, 2023-2033 (US$ Mn, AGR%, CAGR%)
Table 17 Non-cold Chain Segment Market Forecast by Region, 2023-2033 (US$ Mn, AGR%, CAGR%)
Table 18 Storage & Retention Segment Market Forecast by Region, 2023-2033 (US$ Mn, AGR%, CAGR%)
Table 19 Packaging and Labeling Segment Market Forecast by Region, 2023-2033 (US$ Mn, AGR%, CAGR%)
Table 20 Comparator Sourcing Segment Market Forecast by Region, 2023-2033 (US$ Mn, AGR%, CAGR%)
Table 21 Other CTS Services Segment Market Forecast by Region, 2023-2033 (US$ Mn, AGR%, CAGR%)
Table 22 Global Clinical Trial Supplies Market Forecast by Therapeutic Areas, 2023-2033 (US$ Mn, AGR%, CAGR%)
Table 23 Oncology Segment Market Forecast by Region, 2023-2033 (US$ Mn, AGR%, CAGR%)
Table 24 CNS and Mental Disorders Segment Market Forecast by Region, 2023-2033 (US$ Mn, AGR%, CAGR%)
Table 25 Cardiovascular Disease (CVD) Segment Market Forecast by Region, 2023-2033 (US$ Mn, AGR%, CAGR%)
Table 26 Infectious Disease Segment Market Forecast by Region, 2023-2033 (US$ Mn, AGR%, CAGR%)
Table 27 Immunology Disease Segment Market Forecast by Region, 2023-2033 (US$ Mn, AGR%, CAGR%)
Table 28 Blood Disorders Segment Market Forecast by Region, 2023-2033 (US$ Mn, AGR%, CAGR %)
Table 29 Metabolic Disorders Segment Market Forecast by Region, 2023-2033 (US$ Mn, AGR%, CAGR%)
Table 30 Digestive Disorders Segment Market Forecast by Region, 2023-2033 (US$ Mn, AGR%, CAGR%)
Table 31 Other Therapeutic Areas Segment Market Forecast by Region, 2023-2033 (US$ Mn, AGR%, CAGR %)
Table 32 Global Clinical Trial Supplies Market Forecast by Phase, 2023-2033 (US$ Mn, AGR%, CAGR%)
Table 33 Phase-I Segment Market Forecast by Region, 2023-2033 (US$ Mn, AGR%, CAGR%)
Table 34 Phase-II Segment Market Forecast by Region, 2023-2033 (US$ Mn, AGR%, CAGR%)
Table 35 Phase-III Segment Market Forecast by Region, 2023-2033 (US$ Mn, AGR%, CAGR%)
Table 36 Phase-IV Segment Market Forecast by Region, 2023-2033 (US$ Mn, AGR%, CAGR%)
Table 37 Global Clinical Trial Supplies Market Forecast by End-User, 2023-2033 (US$ Mn, AGR%, CAGR %)
Table 38 Contract Research Organizations Segment Market Forecast by Region, 2023-2033 (US$ Mn, AGR%, CAGR%)
Table 39 Pharmaceutical and Biotechnology Companies Segment Market Forecast by Region, 2023-2033 (US$ Mn, AGR%, CAGR%)
Table 40 Medical Device Companies Segment Market Forecast by Region, 2023-2033 (US$ Mn, AGR%, CAGR %)
Table 41 Other End-Users Segment Market Forecast by Region, 2023-2033 (US$ Mn, AGR%, CAGR%)
Table 42 Global Clinical Trial Supplies Market Forecast by Region 2023-2033 (US$ Mn, AGR%, CAGR%)
Table 43 North America Clinical Trial Supplies Market Forecast by Country, 2023-2033 (US$ Mn, AGR%, CAGR%)
Table 44 North America Clinical Trial Supplies Market Forecast by Location, 2023-2033 (US$ Mn, AGR%, CAGR%)
Table 45 North America Clinical Trial Supplies Market Forecast by Type, 2023-2033 (US$ Mn, AGR%, CAGR%)
Table 46 North America Clinical Trial Supplies Market Forecast by Services, 2023-2033 (US$ Mn, AGR%, CAGR%)
Table 47 North America Clinical Trial Supplies Market Forecast by Manufacturing, 2023-2033 (US$ Mn, AGR%, CAGR%)
Table 48 North America Clinical Trial Supplies Market Forecast by Logistics & Distribution, 2023-2033 (US$ Mn, AGR%, CAGR%)
Table 49 North America Clinical Trial Supplies Market Forecast by Therapeutic Areas, 2023-2033 (US$ Mn, AGR%, CAGR%)
Table 50 North America Clinical Trial Supplies Market Forecast by Phase, 2023-2033 (US$ Mn, AGR%, CAGR%)
Table 51 North America Clinical Trial Supplies Market Forecast by End-User, 2023-2033 (US$ Mn, AGR%, CAGR%)
Table 52 U.S. Clinical Trial Supplies Market Forecast, 2023-2033 (US$ Mn, AGR%, CAGR %)
Table 53 Canada Clinical Trial Supplies Market Forecast, 2023-2033 (US$ Mn, AGR%, CAGR%)
Table 54 Europe Clinical Trial Supplies Market Forecast by Country, 2023-2033 (US$ Mn, AGR%, CAGR%)
Table 55 Europe Clinical Trial Supplies Market Forecast by Location, 2023-2033 (US$ Mn, AGR%, CAGR%)
Table 56 Europe Clinical Trial Supplies Market Forecast by Type, 2023-2033 (US$ Mn, AGR%, CAGR%)
Table 57 Europe Clinical Trial Supplies Market Forecast by Services, 2023-2033 (US$ Mn, AGR%, CAGR%)
Table 58 Europe Clinical Trial Supplies Market Forecast by Manufacturing, 2023-2033 (US$ Mn, AGR%, CAGR%)
Table 59 Europe Clinical Trial Supplies Market Forecast by Logistics & Distribution, 2023-2033 (US$ Mn, AGR%, CAGR%)
Table 60 Europe Clinical Trial Supplies Market Forecast by Therapeutic Areas, 2023-2033 (US$ Mn, AGR%, CAGR%)
Table 61 Europe Clinical Trial Supplies Market Forecast by Phase, 2023-2033 (US$ Mn, AGR%, CAGR%)
Table 62 Europe Clinical Trial Supplies Market Forecast by End-User, 2023-2033 (US$ Mn, AGR%, CAGR%)
Table 63 Germany Clinical Trial Supplies Market Forecast, 2023-2033 (US$ Mn, AGR%, CAGR%)
Table 64 UK Clinical Trial Supplies Market Forecast, 2023-2033 (US$ Mn, AGR%, CAGR%)
Table 65 France Clinical Trial Supplies Market Forecast, 2023-2033 (US$ Mn, AGR%, CAGR%)
Table 66 Italy Clinical Trial Supplies Market Forecast, 2023-2033 (US$ Mn, AGR%, CAGR%)
Table 67 Spain Clinical Trial Supplies Market Forecast, 2023-2033 (US$ Mn, AGR%, CAGR%)
Table 68 Russia Clinical Trial Supplies Market Forecast, 2023-2033 (US$ Mn, AGR%, CAGR%)
Table 69 Rest of Europe Clinical Trial Supplies Market Forecast, 2023-2033 (US$ Mn, AGR%, CAGR%)
Table 70 Asia Pacific Clinical Trial Supplies Market Forecast by Country, 2023-2033 (US$ Mn, AGR%, CAGR%)
Table 71 Asia Pacific Clinical Trial Supplies Market Forecast by Location, 2023-2033 (US$ Mn, AGR%, CAGR%)
Table 72 Asia Pacific Clinical Trial Supplies Market Forecast by Type, 2023-2033 (US$ Mn, AGR%, CAGR%)
Table 73 Asia Pacific Clinical Trial Supplies Market Forecast by Services, 2023-2033 (US$ Mn, AGR%, CAGR%)
Table 74 Asia Pacific Clinical Trial Supplies Market Forecast by Manufacturing, 2023-2033 (US$ Mn, AGR%, CAGR%)
Table 75 Asia Pacific Clinical Trial Supplies Market Forecast by Logistics & Distribution, 2023-2033 (US$ Mn, AGR%, CAGR%)
Table 76 Asia Pacific Clinical Trial Supplies Market Forecast by Therapeutic Areas, 2023-2033 (US$ Mn, AGR%, CAGR%)
Table 77 Asia Pacific Clinical Trial Supplies Market Forecast by Phase, 2023-2033 (US$ Mn, AGR%, CAGR%)
Table 78 Asia Pacific Clinical Trial Supplies Market Forecast by End-User, 2023-2033 (US$ Mn, AGR%, CAGR%)
Table 79 China Clinical Trial Supplies Market Forecast, 2023-2033 (US$ Mn, AGR%, CAGR%)
Table 80 India Clinical Trial Supplies Market Forecast, 2023-2033 (US$ Mn, AGR%, CAGR%)
Table 81 Japan Clinical Trial Supplies Market Forecast, 2023-2033 (US$ Mn, AGR%, CAGR%)
Table 82 South Korea Clinical Trial Supplies Market Forecast, 2023-2033 (US$ Mn, AGR%, CAGR%)
Table 83 Australia Clinical Trial Supplies Market Forecast, 2023-2033 (US$ Mn, AGR%, CAGR%)
Table 84 Rest of Asia-Pacific Clinical Trial Supplies Market Forecast, 2023-2033 (US$ Mn, AGR%, CAGR%)
Table 85 Latin America Clinical Trial Supplies Market Forecast by Country, 2023-2033 (US$ Mn, AGR%, CAGR%)
Table 86 Latin America Clinical Trial Supplies Market Forecast by Location, 2023-2033 (US$ Mn, AGR%, CAGR%)
Table 87 Latin America Clinical Trial Supplies Market Forecast by Type, 2023-2033 (US$ Mn, AGR%, CAGR%)
Table 88 Latin America Clinical Trial Supplies Market Forecast by Services, 2023-2033 (US$ Mn, AGR%, CAGR%)
Table 89 Latin America Clinical Trial Supplies Market Forecast by Manufacturing, 2023-2033 (US$ Mn, AGR%, CAGR%)
Table 90 Latin America Clinical Trial Supplies Market Forecast by Logistics & Distribution, 2023-2033 (US$ Mn, AGR%, CAGR%)
Table 91 Latin America Clinical Trial Supplies Market Forecast by Therapeutic Areas, 2023-2033 (US$ Mn, AGR%, CAGR%)
Table 92 Latin America Clinical Trial Supplies Market Forecast by Phase, 2023-2033 (US$ Mn, AGR%, CAGR%)
Table 93 Latin America Clinical Trial Supplies Market Forecast by End-User, 2023-2033 (US$ Mn, AGR%, CAGR%)
Table 94 Brazil Clinical Trial Supplies Market Forecast, 2023-2033 (US$ Mn, AGR%, CAGR%)
Table 95 Mexico Clinical Trial Supplies Market Forecast, 2023-2033 (US$ Mn, AGR%, CAGR%)
Table 96 Rest of Latin America Clinical Trial Supplies Market Forecast, 2023-2033 (US$ Mn, AGR%, CAGR%)
Table 97 MEA Clinical Trial Supplies Market Forecast by Country, 2023-2033 (US$ Mn, AGR%, CAGR%)
Table 98 MEA Clinical Trial Supplies Market Forecast by Location, 2023-2033 (US$ Mn, AGR%, CAGR%)
Table 99 MEA Clinical Trial Supplies Market Forecast by Type, 2023-2033 (US$ Mn, AGR%, CAGR%)
Table 100 MEA Clinical Trial Supplies Market Forecast by Services, 2023-2033 (US$ Mn, AGR%, CAGR%)
Table 101 MEA Clinical Trial Supplies Market Forecast by Manufacturing, 2023-2033 (US$ Mn, AGR%, CAGR%)
Table 102 MEA Clinical Trial Supplies Market Forecast by Logistics & Distribution, 2023-2033 (US$ Mn, AGR%, CAGR%)
Table 103 MEA Clinical Trial Supplies Market Forecast by Therapeutic Areas, 2023-2033 (US$ Mn, AGR%, CAGR%)
Table 104 MEA Clinical Trial Supplies Market Forecast by Phase, 2023-2033 (US$ Mn, AGR%, CAGR%)
Table 105 MEA Clinical Trial Supplies Market Forecast by End-User, 2023-2033 (US$ Mn, AGR%, CAGR%)
Table 106 South Africa Clinical Trial Supplies Market Forecast, 2023-2033 (US$ Mn, AGR%, CAGR%)
Table 107 Saudi Arabia Clinical Trial Supplies Market Forecast, 2023-2033 (US$ Mn, AGR%, CAGR%)
Table 108 Turkey Clinical Trial Supplies Market Forecast, 2023-2033 (US$ Mn, AGR%, CAGR%)
Table 109 UAE Clinical Trial Supplies Market Forecast, 2023-2033 (US$ Mn, AGR%, CAGR%)
Table 110 Rest of MEA Clinical Trial Supplies Market Forecast, 2023-2033 (US$ Mn, AGR%, CAGR%)
Table 111 Strategic Outlook
Table 112 Thermo Fisher Scientific Inc.: Key Details, (CEO, HQ, Revenue, Founded, No. of Employees, Company Type, Website, Business Segment)
Table 113 Thermo Fisher Scientific Inc.: Product Benchmarking
Table 1 Thermo Fisher Scientific Inc.: Strategic Outlook
Table 114 Catalent, Inc.: Key Details, (CEO, HQ, Revenue, Founded, No. of Employees, Company Type, Website, Business Segment)
Table 115 Catalent, Inc.: Product Benchmarking
Table 116 Catalent, Inc.: Strategic Outlook
Table 117 Piramal Pharma Solutions: Key Details, (CEO, HQ, Revenue, Founded, No. of Employees, Company Type, Website, Business Segment)
Table 118 Piramal Pharma Solutions: Product Benchmarking
Table 119 Piramal Pharma Solutions: Strategic Outlook
Table 120 Eurofins Scientific SE: Key Details, (CEO, HQ, Revenue, Founded, No. of Employees, Company Type, Website, Business Segment)
Table 121 Eurofins Scientific SE: Product Benchmarking
Table 122 Lonza: Key Details, (CEO, HQ, Revenue, Founded, No. of Employees, Company Type, Website, Business Segment)
Table 123 Lonza: Product Benchmarking
Table 124 Lonza: Strategic Outlook
Table 125 Clinigen Group plc: Key Details, (CEO, HQ, Revenue, Founded, No. of Employees, Company Type, Website, Business Segment)
Table 126 Clinigen Group plc: Product Benchmarking
Table 2 Clinigen Group plc: Strategic Outlook
Table 127 AmerisourceBergen Corporation: Key Details, (CEO, HQ, Revenue, Founded, No. of Employees, Company Type, Website, Business Segment)
Table 128 AmerisourceBergen Corporation: Product Benchmarking
Table 3 AmerisourceBergen Corporation: Strategic Outlook
Table 129 DHL: Key Details, (CEO, HQ, Revenue, Founded, No. of Employees, Company Type, Website, Business Segment)
Table 130 DHL: Product Benchmarking
Table 131 DHL: Strategic Outlook
Table 132 Sharp Corporation: Key Details, (CEO, HQ, Revenue, Founded, No. of Employees, Company Type, Website, Business Segment)
Table 133 Sharp Corporation: Product Benchmarking
Table 4 Sharp Corporation: Strategic Outlook
Table 134 IQVIA Inc.: Key Details, (CEO, HQ, Revenue, Founded, No. of Employees, Company Type, Website, Business Segment)
Table 135 IQVIA Inc.: Product Benchmarking
Table 136 IQVIA Inc.: Strategic Outlook
Table 137 Parexel: Key Details, (CEO, HQ, Revenue, Founded, No. of Employees, Company Type, Website, Business Segment)
Table 138 Parexel: Product Benchmarking
Table 139 Parexel: Strategic Outlook
Table 140 Biocair: Key Details, (CEO, HQ, Revenue, Founded, No. of Employees, Company Type, Website, Business Segment)
Table 141 Biocair: Product Benchmarking
Table 142 Biocair: Strategic Outlook
Table 143 Liveo Research: Key Details, (CEO, HQ, Revenue, Founded, No. of Employees, Company Type, Website, Business Segment)
Table 144 Liveo Research: Product Benchmarking
Table 145 Liveo Research: Strategic Outlook
Table 146 Marken (A UPS Company): Key Details, (CEO, HQ, Revenue, Founded, No. of Employees, Company Type, Website, Business Segment)
Table 147 Marken (A UPS Company): Product Benchmarking
Table 148 Marken (A UPS Company): Strategic Outlook
Table 149 PCI Pharma Services: Key Details, (CEO, HQ, Revenue, Founded, No. of Employees, Company Type, Website, Business Segment)
Table 150 PCI Pharma Services: Product Benchmarking
Table 151 PCI Pharma Services: Strategic Outlook
Table 152 Ancillare: Key Details, (CEO, HQ, Revenue, Founded, No. of Employees, Company Type, Website, Business Segment)
Table 153 Ancillare: Product Benchmarking
Table 154 Ancillare: Strategic Outlook
Table 155 N-SIDE: Key Details, (CEO, HQ, Revenue, Founded, No. of Employees, Company Type, Website, Business Segment)
Table 156 N-SIDE: Product Benchmarking
Table 157 N-SIDE: Strategic Outlook
Table 158 Rubicon Research Pvt S.A.: Key Details, (CEO, HQ, Revenue, Founded, No. of Employees, Company Type, Website, Business Segment)
Table 159 Rubicon Research Pvt S.A.: Product Benchmarking
Table 160 Rubicon Research Pvt S.A.: Strategic Outlook
Table 161 Myonex: Key Details, (CEO, HQ, Revenue, Founded, No. of Employees, Company Type, Website, Business Segment)
Table 162 Myonex: Product Benchmarking
Table 163 Myonex: Strategic Outlook
Table 164 Endpoint Clinical: Key Details, (CEO, HQ, Revenue, Founded, No. of Employees, Company Type, Website, Business Segment)
Table 165 Endpoint Clinical: Product Benchmarking
Table 166 Endpoint Clinical: Strategic Outlook
Table 167 Recipharm AB: Key Details, (CEO, HQ, Revenue, Founded, No. of Employees, Company Type, Website, Business Segment)
Table 168 Recipharm AB: Product Benchmarking
Table 5 Recipharm AB: Strategic Outlook
Table 169 COREX Logistics: Key Details, (CEO, HQ, Revenue, Founded, No. of Employees, Company Type, Website, Business Segment)
Table 170 COREX Logistics: Product Benchmarking
Table 171 Movianto: Key Details, (CEO, HQ, Revenue, Founded, No. of Employees, Company Type, Website, Business Segment)
Table 172 Movianto: Product Benchmarking
Table 173 Durbin: Key Details, (CEO, HQ, Revenue, Founded, No. of Employees, Company Type, Website, Business Segment)
Table 174 Durbin: Product Benchmarking
Table 175 SIRO Clinpharm: Key Details, (CEO, HQ, Revenue, Founded, No. of Employees, Company Type, Website, Business Segment)
Table 176 SIRO Clinpharm: Product Benchmarking
Table 177 Inizio (UDG Healthcare plc): Key Details, (CEO, HQ, Revenue, Founded, No. of Employees, Company Type, Website, Business Segment)
Table 178 Inizio (UDG Healthcare plc): Product Benchmarking
Table 179 KLIFO: Key Details, (CEO, HQ, Revenue, Founded, No. of Employees, Company Type, Website, Business Segment)
Table 180 KLIFO: Product Benchmarking
Table 181 ADAllen Pharma: Key Details, (CEO, HQ, Revenue, Founded, No. of Employees, Company Type, Website, Business Segment)
Table 182 ADAllen Pharma: Product Benchmarking
Table 183 Seveillar Clinical Supplies Services: Key Details, (CEO, HQ, Revenue, Founded, No. of Employees, Company Type, Website, Business Segment)
Table 184 Seveillar Clinical Supplies Services: Product Benchmarking
Table 185 Coghlan Group: Key Details, (CEO, HQ, Revenue, Founded, No. of Employees, Company Type, Website, Business Segment)
Table 186 Coghlan Group: Product Benchmarking
Table 187 Coghlan Group: Strategic Outlook
List of Figures
Figure 1 Clinical Trial Supplies Market Segmentation
Figure 2 Clinical Trial Supplies Market by Location: Market Attractiveness Index
Figure 3 Clinical Trial Supplies Market by Type: Market Attractiveness Index
Figure 4 Clinical Trial Supplies Market by Services: Market Attractiveness Index
Figure 5 Clinical Trial Supplies Market by Therapeutic Areas: Market Attractiveness Index
Figure 6 Clinical Trial Supplies Market by Phase: Market Attractiveness Index
Figure 7 Clinical Trial Supplies Market by End-User: Market Attractiveness Index
Figure 8 Clinical Trial Supplies Market Attractiveness Index by Region
Figure 9 Clinical Trial Supplies Market: Market Dynamics
Figure 10 COVID Impact Analysis: Clinical Trial Supplies Market Recovery Scenarios
Figure 11 Clinical Trial Supplies Market by Region, 2023-2033 (US$ Mn, AGR (%), CAGR (%)): “V” Shaped Recovery Scenario
Figure 12 Clinical Trial Supplies Market by Region, 2023-2033 (US$ Mn, AGR (%), CAGR (%)): “V” Shaped Recovery
Figure 13 Clinical Trial Supplies Market by Region, 2023-2033 (US$ Mn, AGR (%), CAGR (%)): “U” Shaped Recovery Scenario
Figure 14 Clinical Trial Supplies Market by Region, 2023-2033 (US$ Mn, AGR (%), CAGR (%)): “U” Shaped Recovery
Figure 15 Clinical Trial Supplies Market by Region, 2023-2033 (US$ Mn, AGR (%), CAGR (%)): “W” Shaped Recovery Scenario
Figure 16 Clinical Trial Supplies Market by Region, 2023-2033 (US$ Mn, AGR (%), CAGR (%)): “W” Shaped Recovery
Figure 17 Clinical Trial Supplies Market by Region, 2023-2033 (US$ Mn, AGR (%), CAGR (%)): “L” Shaped Recovery Scenario
Figure 18 Clinical Trial Supplies Market by Region, 2023-2033 (US$ Mn, AGR (%), CAGR (%)): “L” Shaped Recovery
Figure 19 Clinical Trial Supplies Market: PEST Analysis
Figure 20 Clinical Trial Supplies Market by Location: Market Attractiveness Index
Figure 21 Clinical Trial Supplies Market Forecast by Location, 2023-2033 (US$ million)
Figure 22 Clinical Trial Supplies Market Share Forecast by Location, 2023, 2028, 2033 (%)
Figure 23 Offshore Clinical Site Market Forecast by Region, 2023-2033 (US$ million)
Figure 24 Offshore Clinical Site Market Share Forecast by Region, 2023 & 2033 (%)
Figure 25 Offshore Clinical Site Market Forecast by Region, 2023-2033 (US$ million)
Figure 26 Offshore Clinical Site Market Share Forecast by Region, 2023 & 2033 (%)
Figure 27 Clinical Trial Supplies Market by Type: Market Attractiveness Index
Figure 28 Clinical Trial Supplies Market Forecast by Type, 2023-2033 (US$ million)
Figure 29 Clinical Trial Supplies Market Share Forecast by Type, 2023, 2028, 2033 (%)
Figure 30 Small Molecule Products Market Forecast by Region, 2023-2033 (US$ million)
Figure 31 Small Molecule Products Market Share Forecast by Region, 2023 & 2033 (%)
Figure 32 Biologic Products Market Forecast by Region, 2023-2033 (US$ million)
Figure 33 Biologic Products Market Share Forecast by Region, 2023 & 2033 (%)
Figure 34 Medical Devices Market Forecast by Region, 2023-2033 (US$ million)
Figure 35 Medical Devices Market Share Forecast by Region, 2023 & 2033 (%)
Figure 36 Clinical Trial Supplies Market by Services: Market Attractiveness Index
Figure 37 Clinical Trial Supplies Market Forecast by Services, 2023-2033 (US$ million)
Figure 38 Clinical Trial Supplies Market Share Forecast by Services, 2023, 2028, 2033 (%)
Figure 39 Manufacturing Market Forecast by Region, 2023-2033 (US$ million)
Figure 40 Manufacturing Market Share Forecast by Region, 2023 & 2033 (%)
Figure 41 IMPs and INDs Market Forecast by Region, 2023-2033 (US$ million)
Figure 42 IMPs and INDs Market Share Forecast by Region, 2023 & 2033 (%)
Figure 43 Placebos Market Forecast by Region, 2023-2033 (US$ million)
Figure 44 Placebos Market Share Forecast by Region, 2023 & 2033 (%)
Figure 45 Assays and Testkits Market Forecast by Region, 2023-2033 (US$ million)
Figure 46 Assays and Testkits Market Share Forecast by Region, 2023 & 2033 (%)
Figure 47 Others Market Forecast by Region, 2023-2033 (US$ million)
Figure 48 Others Market Share Forecast by Region, 2023 & 2033 (%)
Figure 49 Logistics & Distribution Market Forecast by Region, 2023-2033 (US$ million)
Figure 50 Logistics & Distribution Market Share Forecast by Region, 2023 & 2033 (%)
Figure 51 Cold Chain Distribution Market Forecast by Region, 2023-2033 (US$ million)
Figure 52 Cold Chain Distribution Market Share Forecast by Region, 2023 & 2033 (%)
Figure 53 Non-cold Chain Market Forecast by Region, 2023-2033 (US$ million)
Figure 54 Non-cold Chain Market Share Forecast by Region, 2023 & 2033 (%)
Figure 55 Logistics & Distribution Market Forecast by Region, 2023-2033 (US$ million)
Figure 56 Storage & Retention Market Share Forecast by Region, 2023 & 2033 (%)
Figure 57 Packaging and Labeling Market Forecast by Region, 2023-2033 (US$ million)
Figure 58 Packaging and Labeling Market Share Forecast by Region, 2023 & 2033 (%)
Figure 59 Comparator Sourcing Market Forecast by Region, 2023-2033 (US$ million)
Figure 60 Comparator Sourcing Market Share Forecast by Region, 2023 & 2033 (%)
Figure 61 Other CTS Services Market Forecast by Region, 2023-2033 (US$ million)
Figure 62 Other CTS Services Market Share Forecast by Region, 2023 & 2033 (%)
Figure 63 Clinical Trial Supplies Market by Therapeutic Areas: Market Attractiveness Index
Figure 64 Clinical Trial Supplies Market Forecast by Therapeutic Areas, 2023-2033 (US$ million)
Figure 65 Clinical Trial Supplies Market Share Forecast by Therapeutic Areas, 2023, 2028, 2033 (%)
Figure 66 Oncology Market Forecast by Region, 2023-2033 (US$ million)
Figure 67 Oncology Market Share Forecast by Region, 2023 & 2033 (%)
Figure 68 CNS and Mental Disorders Market Forecast by Region, 2023-2033 (US$ million)
Figure 69 CNS and Mental Disorders Market Share Forecast by Region, 2023 & 2033 (%)
Figure 70 Cardiovascular Disease (CVD) Market Forecast by Region, 2023-2033 (US$ million)
Figure 71 Cardiovascular Disease (CVD) Market Share Forecast by Region, 2023 & 2033 (%)
Figure 72 Cardiovascular Disease (CVD) Market Forecast by Region, 2023-2033 (US$ million)
Figure 73 Cardiovascular Disease (CVD) Market Share Forecast by Region, 2023 & 2033 (%)
Figure 74 Oncology Market Forecast by Region, 2023-2033 (US$ million)
Figure 75 Oncology Market Share Forecast by Region, 2023 & 2033 (%)
Figure 76 Blood Disorders Market Forecast by Region, 2023-2033 (US$ million)
Figure 77 Blood Disorders Market Share Forecast by Region, 2023 & 2033 (%)
Figure 78 Metabolic Disorders Market Forecast by Region, 2023-2033 (US$ million)
Figure 79 Metabolic Disorders Market Share Forecast by Region, 2023 & 2033 (%)
Figure 80 Metabolic Disorders Market Forecast by Region, 2023-2033 (US$ million)
Figure 81 Digestive Disorders Market Share Forecast by Region, 2023 & 2033 (%)
Figure 82 Other Therapeutic Areas Market Forecast by Region, 2023-2033 (US$ million)
Figure 83 Other Therapeutic Areas Market Share Forecast by Region, 2023 & 2033 (%)
Figure 84 Clinical Trial Supplies Market by Phase: Market Attractiveness Index
Figure 85 Clinical Trial Supplies Market Forecast by Phase, 2023-2033 (US$ million)
Figure 86 Clinical Trial Supplies Market Share Forecast by Phase, 2023, 2028, 2033 (%)
Figure 87 Phase-I Market Forecast by Region, 2023-2033 (US$ million)
Figure 88 Phase-I Market Share Forecast by Region, 2023 & 2033 (%)
Figure 89 Phase-II Market Forecast by Region, 2023-2033 (US$ million)
Figure 90 Phase-II Market Share Forecast by Region, 2023 & 2033 (%)
Figure 91 Phase-III Market Forecast by Region, 2023-2033 (US$ million)
Figure 92 Phase-III Market Share Forecast by Region, 2023 & 2033 (%)
Figure 93 Phase-IV Market Forecast by Region, 2023-2033 (US$ million)
Figure 94 Phase-IV Market Share Forecast by Region, 2023 & 2033 (%)
Figure 95 Clinical Trial Supplies Market by End-User: Market Attractiveness Index
Figure 96 Clinical Trial Supplies Market Forecast by End-User, 2023-2033 (US$ million)
Figure 97 Clinical Trial Supplies Market Share Forecast by End-User, 2023, 2028, 2033 (%)
Figure 98 Phase-I Market Forecast by Region, 2023-2033 (US$ million)
Figure 99 Phase-I Market Share Forecast by Region, 2023 & 2033 (%)
Figure 100 Pharmaceutical and Biotechnology Companies Market Forecast by Region, 2023-2033 (US$ million)
Figure 101 Pharmaceutical and Biotechnology Companies Market Share Forecast by Region, 2023 & 2033 (%)
Figure 102 Medical Device Companies Market Forecast by Region, 2023-2033 (US$ million)
Figure 103 Medical Device Companies Market Share Forecast by Region, 2023 & 2033 (%)
Figure 104 Medical Device Companies Market Forecast by Region, 2023-2033 (US$ million)
Figure 105 Other End-Users Market Share Forecast by Region, 2023 & 2033 (%)
Figure 106 Clinical Trial Supplies Market Forecast by Region 2023, 2028, 2033 (Revenue, CAGR%)
Figure 107 Clinical Trial Supplies Market Share Forecast by Region 2023, 2028, 2033(%)
Figure 108 Clinical Trial Supplies Market by Region, 2023-2033 (US$ Mn)
Figure 109 North America Clinical Trial Supplies Market Attractiveness Index
Figure 110 North America Clinical Trial Supplies Market by Region, 2023, 2028 & 2033 (US$ million)
Figure 111 North America Clinical Trial Supplies Market Forecast by Country, 2023-2033 (US$ million)
Figure 112 North America Clinical Trial Supplies Market Share Forecast by Country, 2023 & 2033 (%)
Figure 113 North America Clinical Trial Supplies Market Forecast by Location, 2023-2033 (US$ million)
Figure 114 North America Clinical Trial Supplies Market Share Forecast by Location, 2023 & 2033 (%)
Figure 115 North America Clinical Trial Supplies Market Forecast by Type, 2023-2033 (US$ million)
Figure 116 North America Clinical Trial Supplies Market Share Forecast by Type, 2023 & 2033 (%)
Figure 117 North America Clinical Trial Supplies Market Forecast by Services, 2023-2033 (US$ million)
Figure 118 North America Clinical Trial Supplies Market Share Forecast by Services, 2023 & 2033 (%)
Figure 119 North America Clinical Trial Supplies Market Forecast by Manufacturing, 2023-2033 (US$ million)
Figure 120 North America Clinical Trial Supplies Market Share Forecast by Manufacturing, 2023 & 2033 (%)
Figure 121 North America Clinical Trial Supplies Market Forecast by Logistics & Distribution, 2023-2033 (US$ million)
Figure 122 North America Clinical Trial Supplies Market Share Forecast by Logistics & Distribution, 2023 & 2033 (%)
Figure 123 North America Clinical Trial Supplies Market Forecast by Therapeutic Areas, 2023-2033 (US$ million)
Figure 124 North America Clinical Trial Supplies Market Share Forecast by Therapeutic Areas, 2023 & 2033 (%)
Figure 125 North America Clinical Trial Supplies Market Forecast by Phase, 2023-2033 (US$ million)
Figure 126 North America Clinical Trial Supplies Market Share Forecast by Phase, 2023 & 2033 (%)
Figure 127 North America Clinical Trial Supplies Market Forecast by End-User, 2023-2033 (US$ million)
Figure 128 North America Clinical Trial Supplies Market Share Forecast by Phase, 2023 & 2033 (%)
Figure 129 U.S. Clinical Trial Supplies Market Forecast, 2023-2033 (US$ million, AGR %)
Figure 130 Canada Clinical Trial Supplies Market Forecast, 2023-2033 (US$ million, AGR %)
Figure 131 Europe Clinical Trial Supplies Market Attractiveness Index
Figure 132 Europe Clinical Trial Supplies Market by Region, 2023, 2028 & 2033 (US$ million)
Figure 133 Europe Clinical Trial Supplies Market Forecast by Country, 2023-2033 (US$ million)
Figure 134 Europe Clinical Trial Supplies Market Share Forecast by Country, 2023 & 2033 (%)
Figure 135 Europe Clinical Trial Supplies Market Forecast by Location, 2023-2033 (US$ million)
Figure 136 Europe Clinical Trial Supplies Market Share Forecast by Location, 2023 & 2033 (%)
Figure 137 Europe Clinical Trial Supplies Market Forecast by Type, 2023-2033 (US$ million)
Figure 138 Europe Clinical Trial Supplies Market Share Forecast by Type, 2023 & 2033 (%)
Figure 139 Europe Clinical Trial Supplies Market Forecast by Services, 2023-2033 (US$ million)
Figure 140 Europe Clinical Trial Supplies Market Share Forecast by Services, 2023 & 2033 (%)
Figure 141 Europe Clinical Trial Supplies Market Forecast by Manufacturing, 2023-2033 (US$ million)
Figure 142 Europe Clinical Trial Supplies Market Share Forecast by Manufacturing, 2023 & 2033 (%)
Figure 143 Europe Clinical Trial Supplies Market Forecast by Logistics & Distribution, 2023-2033 (US$ million)
Figure 144 Europe Clinical Trial Supplies Market Share Forecast by Logistics & Distribution, 2023 & 2033 (%)
Figure 145 Europe Clinical Trial Supplies Market Forecast by Therapeutic Areas, 2023-2033 (US$ million)
Figure 146 Europe Clinical Trial Supplies Market Share Forecast by Therapeutic Areas, 2023 & 2033 (%)
Figure 147 Europe Clinical Trial Supplies Market Forecast by Phase, 2023-2033 (US$ million)
Figure 148 Europe Clinical Trial Supplies Market Share Forecast by Phase, 2023 & 2033 (%)
Figure 149 Europe Clinical Trial Supplies Market Forecast by End-User, 2023-2033 (US$ million)
Figure 150 Europe Clinical Trial Supplies Market Share Forecast by Phase, 2023 & 2033 (%)
Figure 151 Germany Clinical Trial Supplies Market Forecast, 2023-2033 (US$ million, AGR %)
Figure 152 UK Clinical Trial Supplies Market Forecast, 2023-2033 (US$ million, AGR %)
Figure 153 France Clinical Trial Supplies Market Forecast, 2023-2033 (US$ million, AGR %)
Figure 154 Italy Clinical Trial Supplies Market Forecast, 2023-2033 (US$ million, AGR %)
Figure 155 Spain Clinical Trial Supplies Market Forecast, 2023-2033 (US$ million, AGR %)
Figure 156 Russia Clinical Trial Supplies Market Forecast, 2023-2033 (US$ million, AGR %)
Figure 157 Rest of Europe Clinical Trial Supplies Market Forecast, 2023-2033 (US$ million, AGR %)
Figure 158 Asia Pacific Clinical Trial Supplies Market Attractiveness Index
Figure 159 Asia Pacific Clinical Trial Supplies Market by Region, 2023, 2028 & 2033 (US$ million)
Figure 160 Asia Pacific Clinical Trial Supplies Market Forecast by Country, 2023-2033 (US$ million)
Figure 161 Asia Pacific Clinical Trial Supplies Market Share Forecast by Country, 2023 & 2033 (%)
Figure 162 Asia Pacific Clinical Trial Supplies Market Forecast by Location, 2023-2033 (US$ million)
Figure 163 Asia Pacific Clinical Trial Supplies Market Share Forecast by Location, 2023 & 2033 (%)
Figure 164 Asia Pacific Clinical Trial Supplies Market Forecast by Type, 2023-2033 (US$ million)
Figure 165 Asia Pacific Clinical Trial Supplies Market Share Forecast by Type, 2023 & 2033 (%)
Figure 166 Asia Pacific Clinical Trial Supplies Market Forecast by Services, 2023-2033 (US$ million)
Figure 167 Asia Pacific Clinical Trial Supplies Market Share Forecast by Services, 2023 & 2033 (%)
Figure 168 Asia Pacific Clinical Trial Supplies Market Forecast by Manufacturing, 2023-2033 (US$ million)
Figure 169 Asia Pacific Clinical Trial Supplies Market Share Forecast by Manufacturing, 2023 & 2033 (%)
Figure 170 Asia Pacific Clinical Trial Supplies Market Forecast by Logistics & Distribution, 2023-2033 (US$ million)
Figure 171 Asia Pacific Clinical Trial Supplies Market Share Forecast by Logistics & Distribution, 2023 & 2033 (%)
Figure 172 Asia Pacific Clinical Trial Supplies Market Forecast by Therapeutic Areas, 2023-2033 (US$ million)
Figure 173 Asia Pacific Clinical Trial Supplies Market Share Forecast by Therapeutic Areas, 2023 & 2033 (%)
Figure 174 Asia Pacific Clinical Trial Supplies Market Forecast by Phase, 2023-2033 (US$ million)
Figure 175 Asia Pacific Clinical Trial Supplies Market Share Forecast by Phase, 2023 & 2033 (%)
Figure 176 Asia Pacific Clinical Trial Supplies Market Forecast by End-User, 2023-2033 (US$ million)
Figure 177 Asia Pacific Clinical Trial Supplies Market Share Forecast by Phase, 2023 & 2033 (%)
Figure 178 China Clinical Trial Supplies Market Forecast, 2023-2033 (US$ million, AGR %)
Figure 179 India Clinical Trial Supplies Market Forecast, 2023-2033 (US$ million, AGR %)
Figure 180 Japan Clinical Trial Supplies Market Forecast, 2023-2033 (US$ million, AGR %)
Figure 181 South Korea Clinical Trial Supplies Market Forecast, 2023-2033 (US$ million, AGR %)
Figure 182 Australia Clinical Trial Supplies Market Forecast, 2023-2033 (US$ million, AGR %)
Figure 183 Rest of Asia-Pacific Clinical Trial Supplies Market Forecast, 2023-2033 (US$ million, AGR %)
Figure 184 Latin America Clinical Trial Supplies Market Attractiveness Index
Figure 185 Latin America Clinical Trial Supplies Market by Region, 2023, 2028 & 2033 (US$ million)
Figure 186 Latin America Clinical Trial Supplies Market Forecast by Country, 2023-2033 (US$ million)
Figure 187 Latin America Clinical Trial Supplies Market Share Forecast by Country, 2023 & 2033 (%)
Figure 188 Latin America Clinical Trial Supplies Market Forecast by Location, 2023-2033 (US$ million)
Figure 189 Latin America Clinical Trial Supplies Market Share Forecast by Location, 2023 & 2033 (%)
Figure 190 Latin America Clinical Trial Supplies Market Forecast by Type, 2023-2033 (US$ million)
Figure 191 Latin America Clinical Trial Supplies Market Share Forecast by Type, 2023 & 2033 (%)
Figure 192 Latin America Clinical Trial Supplies Market Forecast by Services, 2023-2033 (US$ million)
Figure 193 Latin America Clinical Trial Supplies Market Share Forecast by Services, 2023 & 2033 (%)
Figure 194 Latin America Clinical Trial Supplies Market Forecast by Manufacturing, 2023-2033 (US$ million)
Figure 195 Latin America Clinical Trial Supplies Market Share Forecast by Manufacturing, 2023 & 2033 (%)
Figure 196 Latin America Clinical Trial Supplies Market Forecast by Logistics & Distribution, 2023-2033 (US$ million)
Figure 197 Latin America Clinical Trial Supplies Market Share Forecast by Logistics & Distribution, 2023 & 2033 (%)
Figure 198 Latin America Clinical Trial Supplies Market Forecast by Therapeutic Areas, 2023-2033 (US$ million)
Figure 199 Latin America Clinical Trial Supplies Market Share Forecast by Therapeutic Areas, 2023 & 2033 (%)
Figure 200 Latin America Clinical Trial Supplies Market Forecast by Phase, 2023-2033 (US$ million)
Figure 201 Latin America Clinical Trial Supplies Market Share Forecast by Phase, 2023 & 2033 (%)
Figure 202 Latin America Clinical Trial Supplies Market Forecast by End-User, 2023-2033 (US$ million)
Figure 203 Latin America Clinical Trial Supplies Market Share Forecast by Phase, 2023 & 2033 (%)
Figure 204 Brazil Clinical Trial Supplies Market Forecast, 2023-2033 (US$ million, AGR %)
Figure 205 Mexico Clinical Trial Supplies Market Forecast, 2023-2033 (US$ million, AGR %)
Figure 206 Rest of Latin America Clinical Trial Supplies Market Forecast, 2023-2033 (US$ million, AGR %)
Figure 207 MEA Clinical Trial Supplies Market Attractiveness Index
Figure 208 MEA Clinical Trial Supplies Market by Region, 2023, 2028 & 2033 (US$ million)
Figure 209 MEA Clinical Trial Supplies Market Forecast by Country, 2023-2033 (US$ million)
Figure 210 MEA Clinical Trial Supplies Market Share Forecast by Country, 2023 & 2033 (%)
Figure 211 MEA Clinical Trial Supplies Market Forecast by Location, 2023-2033 (US$ million)
Figure 212 MEA Clinical Trial Supplies Market Share Forecast by Location, 2023 & 2033 (%)
Figure 213 MEA Clinical Trial Supplies Market Forecast by Type, 2023-2033 (US$ million)
Figure 214 MEA Clinical Trial Supplies Market Share Forecast by Type, 2023 & 2033 (%)
Figure 215 MEA Clinical Trial Supplies Market Forecast by Services, 2023-2033 (US$ million)
Figure 216 MEA Clinical Trial Supplies Market Share Forecast by Services, 2023 & 2033 (%)
Figure 217 MEA Clinical Trial Supplies Market Forecast by Manufacturing, 2023-2033 (US$ million)
Figure 218 MEA Clinical Trial Supplies Market Share Forecast by Manufacturing, 2023 & 2033 (%)
Figure 219 MEA Clinical Trial Supplies Market Forecast by Logistics & Distribution, 2023-2033 (US$ million)
Figure 220 MEA Clinical Trial Supplies Market Share Forecast by Logistics & Distribution, 2023 & 2033 (%)
Figure 221 MEA Clinical Trial Supplies Market Forecast by Therapeutic Areas, 2023-2033 (US$ million)
Figure 222 MEA Clinical Trial Supplies Market Share Forecast by Therapeutic Areas, 2023 & 2033 (%)
Figure 223 MEA Clinical Trial Supplies Market Forecast by Phase, 2023-2033 (US$ million)
Figure 224 MEA Clinical Trial Supplies Market Share Forecast by Phase, 2023 & 2033 (%)
Figure 225 MEA Clinical Trial Supplies Market Forecast by End-User, 2023-2033 (US$ million)
Figure 226 MEA Clinical Trial Supplies Market Share Forecast by Phase, 2023 & 2033 (%)
Figure 227 South Africa Clinical Trial Supplies Market Forecast, 2023-2033 (US$ million, AGR %)
Figure 228 Saudi Arabia Clinical Trial Supplies Market Forecast, 2023-2033 (US$ million, AGR %)
Figure 229 Turkey Clinical Trial Supplies Market Forecast, 2023-2033 (US$ million, AGR %)
Figure 230 UAE Clinical Trial Supplies Market Forecast, 2023-2033 (US$ million, AGR %)
Figure 231 Rest of MEA Clinical Trial Supplies Market Forecast, 2023-2033 (US$ million, AGR %)
Figure 232 Clinical Trial Supplies Market: Company Share, 2021
Figure 233 Thermo Fisher Scientific Inc.: Net Revenue, 2017-2021 (US$ million, AGR%)
Figure 234 Thermo Fisher Scientific Inc.: R&D, 2017-2021 (US$ million, AGR%)
Figure 235 Thermo Fisher Scientific Inc.: Gross Profit, 2017-2021 (US$ million, AGR%)
Figure 236 Thermo Fisher Scientific Inc.: Regional Market Shares, 2021
Figure 237 Catalent, Inc.: Net Revenue, 2017-2021 (US$ million, AGR%)
Figure 238 Catalent, Inc.: EBITDA, 2017-2021 (US$ million, AGR%)
Figure 239 Catalent, Inc.: Net Income, 2017-2021 (US$ million, AGR%)
Figure 240 Catalent, Inc.: Regional Market Shares, 2021
Figure 241 Eurofins Scientific SE: Net Revenue, 2017-2021 (US$ million, AGR%)
Figure 242 Eurofins Scientific SE: Operating Income, 2017-2021 (US$ million, AGR%)
Figure 243 Eurofins Scientific SE: EBITDA, 2017-2021 (US$ million, AGR%)
Figure 244 Eurofins Scientific SE: Net Income, 2017-2021 (US$ million, AGR%)
Figure 245 Eurofins Scientific SE: Regional Market Shares, 2021
Figure 246 Lonza: Net Revenue, 2017-2021 (US$ million, AGR%)
Figure 247 Lonza: EBIT, 2017-2021 (US$ million, AGR%)
Figure 248 Lonza: Gross Profit, 2017-2021 (US$ million, AGR%)
Figure 249 Clinigen Group plc: Net Revenue, 2017-2021 (US$ million, AGR%)
Figure 250 Clinigen Group plc: EBITDA, 2017-2021 (US$ million, AGR%)
Figure 251 Clinigen Group plc: Net Income, 2017-2021 (US$ million, AGR%)
Figure 252 AmerisourceBergen Corporation: Net Revenue, 2017-2021 (US$ million, AGR%)
Figure 253 AmerisourceBergen Corporation: Operating Income, 2017-2021 (US$ million, AGR%)
Figure 254 AmerisourceBergen Corporation: EBITDA, 2017-2021 (US$ million, AGR%)
Figure 255 AmerisourceBergen Corporation: Net Income, 2017-2021 (US$ million, AGR%)
Figure 256 DHL: Net Revenue, 2017-2021 (US$ million, AGR%)
Figure 257 DHL: EBIT, 2017-2021 (US$ million, AGR%)
Figure 258 DHL: Gross Profit, 2017-2021 (US$ million, AGR%)
Figure 259 DHL: Net Income Profit, 2017-2021 (US$ million, AGR %)
Figure 260 DHL: Operating Income, 2017-2021 (US$ million, AGR%)
Figure 261 DHL: Regional Market Share, 2017-2021 (US$ million, AGR%)
Figure 262 Sharp Corporation: Net Revenue, 2017-2021 (US$ million, AGR%)
Figure 263 Sharp Corporation: EBITDA, 2017-2021 (US$ million, AGR%)
Figure 264 Sharp Corporation: Net Income, 2017-2021 (US$ million, AGR%)
Figure 265 Sharp Corporation: Operating Income, 2017-2021 (US$ million, AGR%)
Figure 266 Sharp Corporation: Gross Profit, 2017-2021 (US$ million, AGR%)
Figure 267 IQVIA Inc.: Net Revenue, 2017-2021 (US$ million, AGR%)
Figure 268 IQVIA Inc.: EBIT, 2017-2021 (US$ million, AGR%)
Figure 269 IQVIA Inc.: Gross Profit, 2017-2021 (US$ million, AGR%)
Figure 270 IQVIA Inc.: Net Income Profit, 2017-2021 (US$ million, AGR%)
Figure 271 IQVIA Inc.: Operating Income, 2017-2021 (US$ million, AGR%)
Figure 272 IQVIA Inc.: Regional Market Share, 2017-2021 (US$ million, AGR%)
ページTOPに戻る
- 本レポートと同じKEY WORDの最新刊レポートはありません。
よくあるご質問
Visiongain社はどのような調査会社ですか?
英国の調査会社ヴィジョンゲイン社(Visiongain)は、通信とエネルギーのほか、自動車や化学・医薬品、金属など、広範な市場を対象に調査を行っています。自動車市場については、市場全般に関する調査のほ... もっと見る
調査レポートの納品までの日数はどの程度ですか?
在庫のあるものは速納となりますが、平均的には 3-4日と見て下さい。
但し、一部の調査レポートでは、発注を受けた段階で内容更新をして納品をする場合もあります。
発注をする前のお問合せをお願いします。
注文の手続きはどのようになっていますか?
1)お客様からの御問い合わせをいただきます。
2)見積書やサンプルの提示をいたします。
3)お客様指定、もしくは弊社の発注書をメール添付にて発送してください。
4)データリソース社からレポート発行元の調査会社へ納品手配します。
5) 調査会社からお客様へ納品されます。最近は、pdfにてのメール納品が大半です。
お支払方法の方法はどのようになっていますか?
納品と同時にデータリソース社よりお客様へ請求書(必要に応じて納品書も)を発送いたします。
お客様よりデータリソース社へ(通常は円払い)の御振り込みをお願いします。
請求書は、納品日の日付で発行しますので、翌月最終営業日までの当社指定口座への振込みをお願いします。振込み手数料は御社負担にてお願いします。
お客様の御支払い条件が60日以上の場合は御相談ください。
尚、初めてのお取引先や個人の場合、前払いをお願いすることもあります。ご了承のほど、お願いします。
データリソース社はどのような会社ですか?
当社は、世界各国の主要調査会社・レポート出版社と提携し、世界各国の市場調査レポートや技術動向レポートなどを日本国内の企業・公官庁及び教育研究機関に提供しております。
世界各国の「市場・技術・法規制などの」実情を調査・収集される時には、データリソース社にご相談ください。
お客様の御要望にあったデータや情報を抽出する為のレポート紹介や調査のアドバイスも致します。
|
|


