ヒトマイクロバイオーム市場レポート:2023-2033
Human Microbiome Market Report 2023-2033
レポート詳細
ヒトマイクロバイオーム市場レポート 2023-2033 :本レポートは、新たな収益の柱を目指すリーディングカンパニーが、業界とその背景にあるダイナミクスをより深く理解する上で、非常に有... もっと見る
※上記価格は部署ライセンス(Departmental licence)価格です。
その他の価格についてはデータリソースまでお問合せください。
日本語のページは自動翻訳を利用し作成しています。
実際のレポートは英文のみでご納品いたします。

|

|
サマリー
レポート詳細
ヒトマイクロバイオーム市場レポート 2023-2033:本レポートは、新たな収益の柱を目指すリーディングカンパニーが、業界とその背景にあるダイナミクスをより深く理解する上で、非常に有益なものとなるでしょう。また、異業種への進出や新地域での既存事業の拡大を目指す企業にとっても有用なレポートです。
マイクロバイオーム関連企業との協業で市場参入を目指す大手製薬企業
マイクロバイオーム研究に対する大手製薬企業の関心は高まっている。大手製薬会社の多くは、資金提供や共同研究を通じて、新興のマイクロバイオーム関連企業の臨床薬候補を支援しています。例えば、2022年7月、臨床段階のマイクロバイオーム企業であるEnteromeは、Nestle Health Scienceと戦略的研究開発協力に調印しました。このライセンス契約は、主に食物アレルギーと炎症性腸疾患(IBD)を対象としたもので、この契約によりEnteromeは現金と株式で4000万ユーロ(4690万米ドル)の契約一時金を受け取ります。その対価として、ネスレ ヘルスサイエンスは、医薬品候補の商業化に伴うロイヤルティと販売マイルストンを受け取ることができます。2021年2月、4Dファーマ株式会社は、Merck Co Ltd.およびPfizerと、局所進行性または転移性の尿路上皮がんに対するMRx5018とBAVENCIOとの併用療法の評価を目的とした、がんおよびワクチンに関する共同研究を行っています。Merck KGaAとPfizer Inc.の両社が共同で開発し、また共同で商業化する予定です。同様に、2021年1月、Vedanta Biosciencesは、Breakthrough Growth Initiativeの一環として、Pfizerから2,500万米ドルの投資資金を受け取りました。Vedantaはこの資金を、炎症性腸疾患の治療を適応とするVE202の第II相試験に使用する予定です。2021年7月、SeresはNestle Health Scienceと共同で、米国とカナダでクロストリジオイデスディフィシル感染症(CDI)の治療薬SER-109を共同商業化することを発表しました。2019年、SeresはAstraZenecaと提携し、免疫腫瘍治療の研究活動を行うための財政支援として2000万米ドルを受け取っていた。より多くの製薬会社がこの市場に参入しているため、ヒトマイクロバイオームの市場全体は予測期間中に驚異的な成長を予見することが期待されます。
市場成長の課題となる規制当局の承認
ヒトマイクロバイオームは、従来の方法では治療が困難であった疾患の治癒や治療に大きな可能性を持っています。さらに、生きたバイオ治療製品(LBP)の使用は大きな可能性があると研究されていますが、ヒトマイクロバイオームに関する規制当局の承認が明確でないことが、この市場の成長を妨げています。特にプレバイオティクス、プロバイオティクス、医薬品を分類する際に、LBPsとその用途について明確に定義されたものはありません。米国FDAは2010年に初めて、病気の予防と治療を目的とした微生物に関するガイダンス案を提示し、2016年に更新してLBPのカテゴリーを正式に作りました。同様に、欧州薬局方委員会は2019年に、生物学的医薬品の法規制に準拠し、LBPの具体的なガイドラインを追加してLBPに言及した草案を発表しました。LBPのリスクに対するベネフィットに関して、規制当局から明確な要求が出されているのです。従来のGMPでは、最終製品に含まれる微生物を除去することが重視されていましたが、ヒトマイクロバイオーム産物は最終製品に含まれる必要があります。したがって、規制当局の承認のための新しいガイドラインを起草するには、これらの製品が非治療製品とは異なるため、詳細な文書化と正当な理由が必要です。LBPは他の微生物に遺伝子を移したり、体内で他の薬物やホルモンを代謝する可能性があるため、ゲノムプロファイリングによるリスク評価が極めて重要である。これを避けるためには、in vitroおよびex-vivoでの研究、動物モデルの研究が不可欠である。株の由来、分離手順、セルバンキングなどの詳細な資料が必要である。さらに、LBPの一貫したバッチを持つことの難しさも、GMP規制の大きなハードルとなっています。市場が拡大するにつれて、ヒトマイクロバイオーム研究の実施に関する明確な規制ガイドラインが作成されると思われますが、現時点では、承認プロセスがこの分野の市場関係者にとって大きな課題となっています。
マーケットリサーチレポートを購入する前に、どのような質問をすべきでしょうか?
- ヒトマイクロバイオーム市場はどのように進化しているのか?
- ヒトマイクロバイオーム市場の推進要因と抑制要因は何か?
- 各ヒトマイクロバイオームサブマーケットセグメントは予測期間中にどのように成長し、2033年にこれらのサブマーケットが占める売上はどの程度になるのか?
- 2023年から2033年にかけて、各ヒトマイクロバイオームサブマーケットの市場シェアはどのように推移するのでしょうか?
- 2023年から2033年にかけて、市場全体の主なドライバーは何になるのか?
- 主要なヒトマイクロバイオーム市場はマクロ経済のダイナミクスに広く追随するのか、それとも個々の国内市場が他を凌駕するのか?
- 2033年までに各国市場のシェアはどのように変化し、2033年にはどの地域が市場をリードするのでしょうか?
- 主要プレイヤーは誰か、予測期間中の見通しは?
- これらの主要企業のヒトマイクロバイオーム医薬品のパイプラインの状況はどうなっていますか?
- 2023年から2033年の間に、業界はどのように進化していくのか?現在および今後10年間に行われるヒトマイクロバイオーム市場プロジェクトはどのような意味を持つのか?
- ヒトマイクロバイオーム市場をさらに拡大するために、製品の商業化の必要性は高いか?
- ヒトマイクロバイオーム市場はどこに向かい、どのようにすれば市場の最前線に立つことができるのか?
- 新製品やサービスラインに対する最適な投資オプションは何か?
- 企業を新たな成長軌道に乗せ、C-suiteに移行させるための重要な展望とは?
これが現在、そして今後10年の間に、ヒトマイクロバイオーム市場にどのような影響を与えるかを見出す必要があります。
- 281ページにわたる本レポートでは、121の表と168のグラフを独占的に提供します。
- このレポートでは、業界における主要な収益性の高い分野をハイライトしているため、今すぐターゲットを絞ることができます。
- 世界、地域、国別の売上高と成長率を詳細に分析しています。
- 競合他社が成功した主なトレンド、変化、収益予測をハイライトしています。
本レポートは、ヒトマイクロバイオーム市場が今後10年間にどのように発展し、COVID-19の景気後退とバウンスの変動に合わせて発展していくかを今日あなたに伝えます。この市場は、過去10年間のどの時点よりも今が重要です。
2033年までの予測やその他の分析により、商業的な展望が見えてきた
- 2033年までの収益予測に加え、直近の実績、成長率、市場シェアもご覧いただけます。
- ビジネスの展望や展開など、独自の分析もご覧いただけます。
- 定性的な分析(市場力学、ドライバー、機会、制約、課題など)、および最近の動向をご覧いただけます。
本レポートでは、COVID-19が業界と貴社にどのような影響を与えるかについて、データ分析と貴重な洞察を掲載しています。本レポートでは、COVID-19の4つの回収パターンとその影響、すなわち「V」、「L」、「W」、「U」について論じています。
報告書の対象セグメント
治療薬別
- 消化器系疾患
- 感染症
- 代謝性疾患
- 癌
- 腸脳軸
- その他
タイプ別
- 糞便微生物叢移植(FMT)
- 生きている生物学的製剤(LBP)
- プレバイオティクス
- ポストバイオティクス
- プレシジョン・バイオティクス
製品別
- プレバイオティクス・プロバイオティクス
- 医療用医薬品
- 診断用検査薬
- 皮膚マイクロバイオーム
技術別
・ ゲノミクス
- 16SrRNAアンプリコンシーケンス
- ショットガンメタゲノミックシーケンス
- ロングリードメタゲノミックシーケンス
・ プロテオミクス
・ メタボロミクス
世界市場全体とセグメントの収益予測に加え、5つの地域と21の主要国市場の収益予測も掲載しています。
北米
- アメリカ
- カナダ
欧州
- ドイツ
- 英国
- フランス
- スペイン
- イタリア
- その他の地域
アジア太平洋地域
- 中国
- 日本
- インド
- 韓国
- 台湾
- その他のアジア
ラテンアメリカ
- ブラジル
- メキシコ
- その他のラテンアメリカ地域
MEA
- サウジアラビア
- 南アフリカ
- UAE
- その他の中東・アフリカ地域
レポートには、ヒトマイクロバイオーム市場の主要企業のプロファイルと2023年から2033年まで、これらの企業のこのセグメントに焦点を当てた内容も含まれています。
主要企業と市場成長の可能性
・ 4D Pharma Plc.
・ Axial Therapeutics
・ BiomX
・ Enterobiome
・ Enterome
・ Finch Therapeutics Group Inc.
・ MaaT Pharma
・ Rebiotix Inc.,( a Ferring Pharmaceutical Company)
・ Second Genome
・ Seres Therapeutics
・ Synlogic
・ Theriva Biologics (ex-Synthetic Biologics)
・ Vedanta Biosciences Inc.
ヒトマイクロバイオーム市場の世界全体の収益、金額で2023年から2033年まで、市場は2023年に2億2400万米ドルを超えると、我々の仕事は計算しています。2032年まで強い収益成長が予測される。本調査では、最も大きな可能性を秘めた企業を特定しました。彼らの能力、進歩、商業的展望を発見することで、一歩先を行くことができます。
ヒトマイクロバイオーム市場、2023年から2033年までのレポートはどのようにあなたのお役に立ちますか?
280ページを超えるレポートでは、要約すると以下のような知識を得ることができます。
- ヒトマイクロバイオーム市場の2033年までの収益予測、治療薬、タイプ、製品、技術、企業規模別に、それぞれ世界と地域レベルで予測 - 業界の展望、投資と収益の最も有利な場所を発見してください。
- 5地域と21主要国市場の2033年までの収益予測 - 北米、欧州、アジア太平洋、中南米、MEAのヒトマイクロバイオーム、2023年から2033年の市場予測をご覧いただけます。また、米国、カナダ、メキシコ、ブラジル、ドイツ、フランス、英国、イタリア、中国、インド、日本、台湾などの主要経済圏の市場も予測されています。
- 既存企業および市場参入を目指す企業の展望 - ヒトマイクロバイオーム市場に関わる主要企業13社の企業プロファイルを含む、2023年から2033年までの展望。
定量的・定性的な分析と独自の予測をご覧いただけます。私たちのレポートだけが持つ情報を入手し、貴重なビジネスインテリジェンスを得ることができます。
他にはない情報
私たちの新しいレポートがあれば、知識の遅れを取り戻し、チャンスを逃す可能性が低くなります。私たちの研究が貴社の研究、分析、意思決定にどのように役立つかをご覧ください。Visiongainの研究は、ヒトマイクロバイオーム市場、2023年から2033年、市場をリードする企業のための商業分析を必要とするすべての人のためのものです。データ、トレンド、予測を見つけることができます。
ページTOPに戻る
目次
目次
1.レポートの概要
1.1 研究の目的
1.2 ヒトマイクロバイオーム市場の紹介
1.3 本レポートが提供するもの
1.4 本レポートを読むべき理由
1.5 本分析レポートが回答する重要な質問
1.6 本レポートは誰のためのものなのか?
1.7 方法論
1.7.1 市場の定義
1.7.2 市場評価・予測手法
1.7.3 データの検証
1.7.3.1 一次調査
1.7.3.2 セカンダリーリサーチ
1.8 関連するVisiongainのレポート
1.9 Visiongainについて
1.10 よくある質問(FAQ)
2.エグゼクティブサマリー
3 市場の概要
3.1 主要な調査結果
3.2 マーケットダイナミクス
3.2.1 市場の推進要因
3.2.1.1 幅広い治療分野への応用による産業の成長促進
3.2.1.2 民間ベンチャーや政府機関からの資金調達の増加が産業成長の引き金に
3.2.1.3 マイクロバイオメーカーとの提携による市場参入を目指す大手製薬企業
3.2.1.4 ハイスループットなシーケンシング、機械学習(AI&ディープラーニング)が市場成長を強化する
3.2.1.5 コンパニオン診断の成長を支えるマイクロバイオームバイオマーカー探索
3.2.2 市場の抑制要因
3.2.2.1 市場の成長を阻む規制当局の承認
3.2.2.2 市場成長を阻害する製剤化とトランスレーショナル・マニュファクチャリングの障害
3.2.2.3 価格と償還に関する明確性の欠如が市場成長の妨げとなる可能性
3.2.3 市場機会
3.2.3.1 研究受託製造サービス
3.2.3.2 マイクロバイオーム診断を支えるナノテクノロジー
3.3 COVID-19影響度分析
3.4 ポーターのファイブフォース分析
3.4.1 供給者の交渉力(低〜中)
3.4.2 バイヤーの交渉力(中〜高)
3.4.3 競合他社の競争力(中〜高)
3.4.4 代替品の脅威(低~中)
3.4.5 新規参入の脅威(中〜高)
3.5 PEST分析
4 ヒトマイクロバイオーム市場分析:治療薬別
4.1 主要な調査結果
4.2 ヒトマイクロバイオーム治療薬セグメント、市場魅力度指数
4.3 ヒトマイクロバイオーム治療薬の市場規模推定と予測
4.4 消化器系疾患
4.4.1 地域別市場規模、2023-2033 (US$ mn)
4.4.2 地域別市場シェア、2023年&2033年(%)
4.5 感染症
4.5.1 地域別市場規模、2023年~2033年 (US$ mn)
4.5.2 地域別市場シェア、2023年&2033年(%)
4.6 代謝性疾患
4.6.1 地域別市場規模、2023年~2033年 (US$mn)
4.6.2 地域別市場シェア、2023年&2033年(%)
4.7 癌
4.7.1 地域別市場規模、2023年〜2033年 (US$mn)
4.7.2 地域別市場シェア、2023年&2033年(%)
4.8 腸・脳軸
4.8.1 地域別市場規模、2023年~2033年 (US$mn)
4.8.2 地域別市場シェア、2023年&2033年(%)
4.9 その他
4.9.1 地域別市場規模、2023年~2033年 (US$mn)
4.9.2 地域別市場シェア、2023年&2033年(%)
5 ヒトマイクロバイオーム市場分析:タイプ別
5.1 主な調査結果
5.2 ヒトマイクロバイオームのタイプ別セグメント。市場魅力度指数
5.3 ヒトマイクロバイオームの治療薬別市場規模の推定と予測
5.4 糞便微生物叢移植(FMT)
5.4.1 地域別市場規模、2023-2033 (US$ mn)
5.4.2 地域別市場シェア、2023年&2033年(%)
5.5 ライブバイオセラピューティック製品(LBP)
5.5.1 地域別市場規模、2023年~2033年 (US$mn)
5.5.2 地域別市場シェア、2023年&2033年(%)
5.6 プレバイオティクス
5.6.1 地域別市場規模、2023〜2033年 (US$ mn)
5.6.2 地域別市場シェア、2023年&2033年(%)
5.7 ポストバイオティクス
5.7.1 地域別市場規模、2023年〜2033年 (US$ mn)
5.7.2 地域別市場シェア、2023年&2033年(%)
5.8 精密抗生物質
5.8.1 地域別市場規模、2023年〜2033年 (US$ mn)
5.8.2 地域別市場シェア、2023年&2033年(%)
6 ヒトマイクロバイオーム市場分析:製品別
6.1 主要な調査結果
6.2 製品セグメント別ヒトマイクロバイオーム。市場魅力度指数
6.3 ヒトマイクロバイオームの製品別市場規模の推定と予測
6.4 プレバイオティクス&プロバイオティクス
6.4.1 地域別市場規模、2023-2033 (US$ mn)
6.4.2 地域別市場シェア、2023年&2033年(%)
6.5 医療用医薬品
6.5.1 地域別市場規模、2023年~2033年 (US$mn)
6.5.2 地域別市場シェア、2023年&2033年(%)
6.6 診断検査薬
6.6.1 地域別市場規模、2023年~2033年 (US$mn)
6.6.2 地域別市場シェア、2023年&2033年(%)
6.7 皮膚マイクロバイオーム
6.7.1 地域別市場規模、2023年~2033年 (US$ mn)
6.7.2 地域別市場シェア、2023年&2033年(%)
7 ヒトマイクロバイオーム市場分析:技術別
7.1 主要な調査結果
7.2 技術セグメント別ヒトマイクロバイオーム。市場魅力度指数
7.3 ヒトマイクロバイオームの技術別市場規模の推定と予測
7.4 ゲノミクス
7.4.1 地域別市場規模、2023年~2033年(US$ mn)
7.4.2 地域別市場シェア、2023年&2033年(%)
7.4.3 ゲノミクス市場:シーケンシングタイプ別
7.4.4 16SrRNAアンプリコンシークエンス
7.4.5 ショットガン・メタゲノミック・シーケンス
7.4.6 ロングリードメタゲノミックシーケンス
7.5 プロテオミクス
7.5.1 地域別市場規模、2023-2033年(US$ mn)
7.5.2 地域別市場シェア、2023年&2033年(%)
7.6 メタボロミクス
7.6.1 地域別市場規模、2023年~2033年 (US$mn)
7.6.2 地域別市場シェア、2023年&2033年(%)
8 ヒトマイクロバイオームの地域別市場分析
8.1 主な調査結果
8.2 地域別市場規模の推定と予測
9 北米のヒトマイクロバイオーム市場分析
9.1 主な調査結果
9.2 北米のヒトマイクロバイオーム市場の魅力度指数
9.3 北米のヒトマイクロバイオーム市場の国別推移、2023年、2028年&2033年 (US$ mn)
9.4 北米のヒトマイクロバイオーム市場の国別市場規模予測・予想
9.5 北米のヒトマイクロバイオーム市場の治療薬別市場規模予測・予想
9.6 北米のヒトマイクロバイオーム市場の技術別市場規模予測・予想
9.7 北米のヒトマイクロバイオーム市場のタイプ別市場規模予測・予想
9.8 北米のヒトマイクロバイオーム市場の製品別市場規模予測・予想
9.9 アメリカヒトマイクロバイオーム市場の分析
9.10 カナダのヒト型マイクロバイオーム市場の分析
10 欧州のヒトマイクロバイオーム市場分析
10.1 主な調査結果
10.2 欧州のヒトマイクロバイオーム市場魅力度指数
10.3 欧州のヒトマイクロバイオーム市場の国別推移、2023年、2028年&2033年(US$ mn)
10.4 欧州のヒトマイクロバイオーム市場の国別市場規模予測・予想
10.5 欧州のヒトマイクロバイオーム市場の治療薬別市場規模予測・予測
10.6 欧州のヒトマイクロバイオーム市場の技術別市場規模予測・予想
10.7 欧州のヒトマイクロバイオームの市場規模予測・タイプ別予測
10.8 欧州のヒトマイクロバイオーム市場の製品別市場規模予測・予想
10.9 ドイツのヒトマイクロバイオーム市場の分析
10.10 イギリスのヒトマイクロバイオーム市場の分析
10.11 フランスのヒトマイクロバイオーム市場の分析
10.12 イタリアのヒトマイクロバイオーム市場の分析
10.13 スペインのヒトマイクロバイオーム市場の分析
10.14 その他の欧州地域のヒトマイクロバイオーム市場の分析
11 アジア太平洋地域のヒトマイクロバイオーム市場分析
11.1 主な調査結果
11.2 アジア太平洋地域のヒトマイクロバイオーム市場の魅力度指数
11.3 アジア太平洋地域のヒトマイクロバイオーム市場:国別、2023年、2028年&2033年(US$ mn)
11.4 アジア太平洋地域のヒトマイクロバイオーム市場の国別市場規模予測・予想
11.5 アジア太平洋地域のヒトマイクロバイオーム市場の治療薬別市場規模の推定と予測
11.6 アジア太平洋地域のヒトマイクロバイオーム市場の技術別市場規模予測・予想
11.7 アジア太平洋地域のヒトマイクロバイオームの市場規模予測・タイプ別予測
11.8 アジア太平洋地域のヒトマイクロバイオーム市場の製品別市場規模予測・予想
11.9 中国ヒューマンマイクロバイオーム市場分析
11.10 日本ヒューマンマイクロバイオーム市場分析
11.11 韓国ヒューマンマイクロバイオーム市場分析
11.12 台湾ヒューマンマイクロバイオーム市場分析
11.13 インドのヒトマイクロバイオーム市場の分析
11.14 その他のアジア太平洋地域のヒトマイクロバイオーム市場の分析
12 ラテンアメリカのヒトマイクロバイオーム市場分析
12.1 主な調査結果
12.2 ラテンアメリカのヒトマイクロバイオーム市場の魅力度指数
12.3 ラテンアメリカのヒトマイクロバイオーム市場の国別推移、2023年、2028年&2033年(US$ mn)
12.4 ラテンアメリカのヒトマイクロバイオーム市場の国別市場規模予測・予想
12.5 ラテンアメリカのヒトマイクロバイオーム市場の治療薬別市場規模予測・予想
12.6 ラテンアメリカのヒトマイクロバイオーム市場の技術別市場規模予測・予想
12.7 ラテンアメリカのヒトマイクロバイオーム市場の種類別市場規模予測・予想
12.8 ラテンアメリカのヒトマイクロバイオーム市場の製品別市場規模予測・予想
12.9 ブラジルヒトマイクロバイオーム市場の分析
12.10 メキシコのヒトマイクロバイオーム市場分析
12.11 その他のラテンアメリカのヒューマンマイクロバイオーム市場分析
13 中東・アフリカのヒトマイクロバイオーム市場分析
13.1 主な調査結果
13.2 中東・アフリカのヒトマイクロバイオーム市場の魅力度指数
13.3 中東・アフリカのヒトマイクロバイオーム国別市場、2023年、2028年、2033年 (US$ mn)
13.4 中東・アフリカのヒトマイクロバイオーム国別市場規模の推定と予測
13.5 中東・アフリカのヒトマイクロバイオーム市場の治療薬別市場規模予測・予測
13.6 中東・アフリカのヒトマイクロバイオーム市場の技術別市場規模予測・予想
13.7 中東・アフリカのヒトマイクロバイオームタイプ別市場規模予測・予想
13.8 中東・アフリカのヒトマイクロバイオーム市場の製品別市場規模予測・予想
13.9 サウジアラビアのヒトマイクロバイオーム市場分析
13.10 アラブ首長国連邦(UAE)のヒトマイクロバイオーム市場分析
13.11 南アフリカのヒトマイクロバイオーム市場の分析
13.12 その他の中東・アフリカ地域ヒューマンマイクロバイオーム市場の分析
14 主要企業のプロフィール
14.1 企業シェア分析
14.2 主要事業戦略分析
14.3 Rebiotix Inc., (now a Ferring Company)
14.3.1 会社概要
14.3.2 会社概要
14.3.3 財務分析
14.3.3.1 純収益、2019-2021年
14.3.3.2 R&D、2019年~2021年
14.3.4 Rebiotix, Inc.:パイプラインの状況
14.3.5 戦略的な展望
14.4 Seres Therapeutics, Inc.
14.4.1 企業スナップショット
14.4.2 会社概要
14.4.3 財務分析
14.4.3.1 収入、2017-2021年
14.4.3.2 R&D、2017年-2021年
14.4.4 Seres Therapeutics, Inc.:パイプラインの状況
14.4.5 戦略的な展望
14.5 4D Pharma plc
14.5.1 企業スナップショット
14.5.2 会社概要
14.5.3 財務分析
14.5.3.1 収益、2017-2021年
14.5.3.2 R&D、2017年-2021年
14.5.4 4D Pharma plc:パイプラインの状況
14.5.5 戦略的な展望
14.6 Enterobiome
14.6.1 企業スナップショット
14.6.2 会社概要
14.6.3 Enterobiome:パイプラインの状況
14.6.4 戦略的な展望
14.7 Vedanta Biosciences, Inc.,
14.7.1 企業スナップショット
14.7.2 会社概要
14.7.3 財務分析
14.7.3.1 収益、2017-2021年
14.7.4 Vedanta Biosciences, Inc.,:パイプラインの状況
14.7.5 戦略的な展望
14.8 Second Genome
14.8.1 企業スナップショット
14.8.2 会社概要
14.8.3 Second Genome:パイプラインの状況
14.8.4 戦略的な展望
14.9 Finch Therapeutics Group Inc.
14.9.1 企業スナップショット
14.9.2 会社概要
14.9.3 財務分析
14.9.3.1 収益、2020-2021年
14.9.3.2 R&D、2020-2021年
14.9.4 Finch Therapeutics Group Inc.:パイプラインの状況
14.9.5 戦略的な展望
14.10 Enterome
14.10.1 企業スナップショット
14.10.2 会社概要
14.10.3 Enterome:パイプラインの状況
14.10.4 戦略的な展望
14.11 Theriva Biologics (ex-Synthetic Biologics)
14.11.1 企業スナップショット
14.11.2 会社概要
14.11.3 財務分析
14.11.3.1 収益、2017-2021年
14.11.3.2 R&D、2017年-2021年
14.11.4 Theriva Biologics:パイプラインの状況
14.11.5 戦略的な展望
14.12 Synlogic
14.12.1 企業スナップショット
14.12.2 会社概要
14.12.3 財務分析
14.12.4 パートナーシップ/戦略的協業
14.12.5 戦略的展望
14.13 Axial Therapeutics
14.13.1 企業スナップショット
14.13.2 会社概要
14.13.3 財務分析
14.13.4 Axial Therapeutics:パイプラインの状況
14.13.5 戦略的な展望
14.14 MaaT Pharma
14.14.1 企業スナップショット
14.14.2 会社概要
14.14.3 財務分析
14.14.4 MaaT Pharma:パイプラインの状況
14.14.5 戦略的な展望
14.15 BiomX
14.15.1 企業スナップショット
14.15.2 会社概要
14.15.3 BiomX:パイプラインの状況
14.15.4 戦略的展望
15 結論と提言
15.1 ヴィジョンゲインからの結論
15.2 市場関係者への提言
表の一覧
Table 1 Human Microbiome Market Snapshot, 2023 & 2033 (US$ million, CAGR %)
Table 2 Human Microbiome Market by Region, 2023-2033 (US$ mn, AGR (%), CAGR (%)): “U” Shaped Recovery Scenario
Table 3 Human Microbiome Market by Region, 2023-2033 (US$ mn, AGR (%), CAGR (%)): “W” Shaped Recovery Scenario
Table 4 Human Microbiome Market by Region, 2023-2033 (US$ mn, AGR (%), CAGR (%)): “L” Shaped Recovery Scenario
Table 5 Human Microbiome Market Forecast by Therapeutics, 2023-2033 (US$ mn, AGR%, CAGR %)
Table 6 Gastrointestinal Disorders Human Microbiome Pipeline Analysis
Table 7 Gastrointestinal Disorders Market by Region, 2023-2033 (US$ mn, AGR (%), CAGR (%))
Table 8 Infectious Diseases Human Microbiome Pipeline Analysis
Table 9 Infectious Diseases Market by Region, 2023-2033 (US$ mn, AGR (%), CAGR (%))
Table 10 Metabolic Disorders: Human Microbiome Pipeline Analysis
Table 11 Metabolic Disorders Market Forecast by Region, 2023-2033 (US$ mn, AGR%, CAGR %)
Table 12 Cancer: Human Microbiome Pipeline Analysis
Table 13 Cancer Market Forecast by Region, 2023-2033 (US$ mn, AGR%, CAGR %)
Table 14 Gut-Brain-Axis: Human Microbiome Pipeline Analysis
Table 15 Gut-Brain-Axis Market Forecast by Region, 2023-2033 (US$ mn, AGR%, CAGR %)
Table 16 Others Market Forecast by Region, 2023-2033 (US$ mn, AGR%, CAGR %)
Table 17 Human Microbiome Market Forecast by Type, 2023-2033 (US$ mn, AGR%, CAGR %)
Table 18 Fecal Microbiota Transplant Human Microbiome Pipeline Analysis
Table 19 Fecal Microbiota Transplant Market by Region, 2023-2033 (US$ mn, AGR (%), CAGR (%))
Table 20 Live Biotherapeutics Product: Pipeline Analysis
Table 21 Live Biotherapeutics Market by Region, 2023-2033 (US$ mn, AGR (%), CAGR (%))
Table 22 Prebiotics Market Forecast by Region, 2023-2033 (US$ mn, AGR%, CAGR %)
Table 23 Post Biotics: Pipeline Analysis
Table 24 Post Biotics Market Forecast by Region, 2023-2033 (US$ mn, AGR%, CAGR %)
Table 25 Precision Antibiotics Market Forecast by Region, 2023-2033 (US$ mn, AGR%, CAGR %)
Table 26 Human Microbiome Market Forecast by Product, 2023-2033 (US$ mn, AGR%, CAGR %)
Table 27 Prebiotics & Probiotics Market by Region, 2023-2033 (US$ mn, AGR (%), CAGR (%))
Table 28 Medicinal Drugs Market by Region, 2023-2033 (US$ mn, AGR (%), CAGR (%))
Table 29 Diagnostic Tests Market Forecast by Region, 2023-2033 (US$ mn, AGR%, CAGR %)
Table 30 Skin Microbiome Market Forecast by Region, 2023-2033 (US$ mn, AGR%, CAGR %)
Table 31 Human Microbiome Market Forecast by Technology, 2023-2033 (US$ mn, AGR%, CAGR %)
Table 32 Genomics Microbiome Technology Market by Region, 2023-2033 (US$ mn, AGR (%), CAGR (%))
Table 33 Genomics Microbiome Technology Market by Sequencing Types, 2023-2033 (US$ mn, AGR (%), CAGR (%))
Table 34 Proteomics Market by Region, 2023-2033 (US$ mn, AGR (%), CAGR (%))
Table 35 Metabolomics Market Forecast by Region, 2023-2033 (US$ mn, AGR%, CAGR %)
Table 36 Human Microbiome Market by Region, 2023-2033 (US$ mn, AGR (%), CAGR (%))
Table 37 North America Human Microbiome Market Forecast by Country, 2023-2033 (US$ mn, AGR%, CAGR %)
Table 38 North America Human Microbiome Market Forecast by Therapeutics, 2023-2033 (US$ mn, AGR%, CAGR %)
Table 39 North America Human Microbiome Market Forecast by Technology, 2023-2033 (US$ mn, AGR%, CAGR %)
Table 40 North America Human Microbiome Market Forecast by Type, 2023-2033 (US$ mn, AGR%, CAGR %)
Table 41 North America Human Microbiome Market Forecast by Product, 2023-2033 (US$ mn, AGR%, CAGR %)
Table 42 U.S. Human Microbiome Market Forecast, 2023-2033 (US$ mn, AGR%, CAGR %)
Table 43 Canada Human Microbiome Market Forecast, 2023-2033 (US$ mn, AGR%, CAGR %)
Table 44 Europe Human Microbiome Market Forecast by Country, 2023-2033 (US$ mn, AGR%, CAGR %)
Table 45 Europe Human Microbiome Market Forecast by Therapeutics, 2023-2033 (US$ mn, AGR%, CAGR %)
Table 46 Europe Human Microbiome Market Forecast by Technology, 2023-2033 (US$ mn, AGR%, CAGR %)
Table 47 Europe Human Microbiome Market Forecast by Type, 2023-2033 (US$ mn, AGR%, CAGR %)
Table 48 Europe Human Microbiome Market Forecast by Product, 2023-2033 (US$ mn, AGR%, CAGR %)
Table 49 Germany Human Microbiome Market Forecast, 2023-2033 (US$ mn, AGR%, CAGR %)
Table 50 U.K. Human Microbiome Market Forecast, 2023-2033 (US$ mn, AGR%, CAGR %)
Table 51 France Human Microbiome Market Forecast, 2023-2033 (US$ mn, AGR%, CAGR %)
Table 52 Italy Human Microbiome Market Forecast, 2023-2033 (US$ mn, AGR%, CAGR %)
Table 53 Spain Human Microbiome Market Forecast, 2023-2033 (US$ mn, AGR%, CAGR %)
Table 54 Rest of Europe Human Microbiome Market Forecast, 2023-2033 (US$ mn, AGR%, CAGR %)
Table 55 Asia-Pacific Human Microbiome Market Forecast by Country, 2023-2033 (US$ mn, AGR%, CAGR %)
Table 56 Asia-Pacific Human Microbiome Market Forecast by Therapeutics, 2023-2033 (US$ mn, AGR%, CAGR %)
Table 57 Asia-Pacific Human Microbiome Market Forecast by Technology, 2023-2033 (US$ mn, AGR%, CAGR %)
Table 58 Asia-Pacific Human Microbiome Market Forecast by Type, 2023-2033 (US$ mn, AGR%, CAGR %)
Table 59 Asia-Pacific Human Microbiome Market Forecast by Product, 2023-2033 (US$ mn, AGR%, CAGR %)
Table 60 China Human Microbiome Market Forecast, 2023-2033 (US$ mn, AGR%, CAGR %)
Table 61 Japan Human Microbiome Market Forecast, 2023-2033 (US$ mn, AGR%, CAGR %)
Table 62 South Korea Human Microbiome Market Forecast, 2023-2033 (US$ mn, AGR%, CAGR %)
Table 63 Taiwan Human Microbiome Market Forecast, 2023-2033 (US$ mn, AGR%, CAGR %)
Table 64 India Human Microbiome Market Forecast, 2023-2033 (US$ mn, AGR%, CAGR %)
Table 65 Rest of Asia Pacific Human Microbiome Market Forecast, 2023-2033 (US$ mn, AGR%, CAGR %)
Table 66 Latin America Human Microbiome Market Forecast by Country, 2023-2033 (US$ mn, AGR%, CAGR %)
Table 67 Latin America Human Microbiome Market Forecast by Therapeutics, 2023-2033 (US$ mn, AGR%, CAGR %)
Table 68 Latin America Human Microbiome Market Forecast by Technology, 2023-2033 (US$ mn, AGR%, CAGR %)
Table 69 Latin America Human Microbiome Market Forecast by Type, 2023-2033 (US$ mn, AGR%, CAGR %)
Table 70 Latin America Human Microbiome Market Forecast by Product, 2023-2033 (US$ mn, AGR%, CAGR %)
Table 71 Brazil Human Microbiome Market Forecast, 2023-2033 (US$ mn, AGR%, CAGR %)
Table 72 Mexico Human Microbiome Market Forecast, 2023-2033 (US$ mn, AGR%, CAGR %)
Table 73 Rest of Latin America Human Microbiome Market Forecast, 2023-2033 (US$ mn, AGR%, CAGR %)
Table 74 Middle East & Africa Human Microbiome Market Forecast by Country, 2023-2033 (US$ mn, AGR%, CAGR %)
Table 75 Middle East & Africa Human Microbiome Market Forecast by Therapeutics, 2023-2033 (US$ mn, AGR%, CAGR %)
Table 76 Middle East & Africa Human Microbiome Market Forecast by Technology, 2023-2033 (US$ mn, AGR%, CAGR %)
Table 77 Middle East & Africa Human Microbiome Market Forecast by Type, 2023-2033 (US$ mn, AGR%, CAGR %)
Table 78 Middle East & Africa Human Microbiome Market Forecast by Product, 2023-2033 (US$ mn, AGR%, CAGR %)
Table 79 Saudi Arabia Human Microbiome Market Forecast, 2023-2033 (US$ mn, AGR%, CAGR %)
Table 80 UAE Human Microbiome Market Forecast, 2023-2033 (US$ mn, AGR%, CAGR %)
Table 81 South Africa Human Microbiome Market Forecast, 2023-2033 (US$ mn, AGR%, CAGR %)
Table 82 Rest of MEA Human Microbiome Market Forecast, 2023-2033 (US$ mn, AGR%, CAGR %)
Table 83 Key Business Strategies Adopted by Key Players in Human Microbiome Market
Table 84 Rebiotix Inc.: Key Details, (CEO, HQ, Revenue, Founded, No. of Employees, Company Type, Website, Business Segment)
Table 85 Rebiotix, Inc.: Pipeline Development
Table 86 Rebiotix, Inc.: Strategic Outlook
Table 87 Seres Therapeutics, Inc.: Key Details, (CEO, HQ, Revenue, Founded, No. of Employees, Company Type, Website, Business Segment)
Table 88 Seres Therapeutics, Inc.: Product Pipeline
Table 89 Seres Therapeutics, Inc.: Strategic Outlook
Table 90 4D Pharma plc: Key Details, (CEO, HQ, Revenue, Founded, No. of Employees, Company Type, Website, Business Segment)
Table 91 4D Pharma plc: Live Biotherapeutics Pipeline
Table 92 4D Pharma plc: Strategic Outlook
Table 93 Enterobiome: Key Details, (CEO, HQ, Revenue, Founded, No. of Employees, Company Type, Website, Business Segment)
Table 94 Enterobiome: Microbiome Pipeline
Table 95 Enterobiome: Strategic Outlook
Table 96 Vedanta Biosciences,Inc.: Key Details, (CEO, HQ, Revenue, Founded, No. of Employees, Company Type, Website, Business Segment)
Table 97 Vedanta Biosciences (a Puretech Health PLC company),: Pipeline
Table 98 Vedanta Biosciences,Inc.,: Strategic Outlook
Table 99 Second Genome Plc: Key Details, (CEO, HQ, Revenue, Founded, No. of Employees, Company Type, Website, Business Segment)
Table 100 Second Genome Inc.: Pipeline Status
Table 101 Second Genome Plc: Strategic Outlook
Table 102 Finch Therapeutics Group, Inc..: Key Details, (CEO, HQ, Revenue, Founded, No. of Employees, Company Type, Website, Business Segment)
Table 103 Finch Therapeutics Group, Inc.: Pipeline Status
Table 104 Finch Therapeutics Group, Inc..: Strategic Outlook
Table 105 Enterome: Key Details, (CEO, HQ, Revenue, Founded, No. of Employees, Company Type, Website, Business Segment)
Table 106 Enterome: Pipeline Status
Table 107 Enterome: Strategic Outlook
Table 108 Theriva Biologics: Key Details, (CEO, HQ, Revenue, Founded, No. of Employees, Company Type, Website, Business Segment)
Table 109 Theriva Biologics: Pipeline Status
Table 110 Theriva Biologics: Strategic Outlook
Table 111 Synlogic: Key Details, (CEO, HQ, Revenue, Founded, No. of Employees, Company Type, Website, Business Segment)
Table 112 Synlogic: Pipeline Status
Table 113 Synlogic : Strategic Outlook
Table 114 Axial Therapeutics: Key Details, (CEO, HQ, Revenue, Founded, No. of Employees, Company Type, Website, Business Segment)
Table 115 Axial Therapeutics: Pipeline
Table 116 Axial Therapeutics : Strategic Outlook
Table 117 MaaT Pharma: Key Details, (CEO, HQ, Revenue, Founded, No. of Employees, Company Type, Website, Business Segment)
Table 118 MaaT Pharma : Pipeline Analysis
Table 119 MaaT : Strategic Outlook
Table 120 BiomX: mRNA Pipeline
Table 121 BiomX: Strategic Outlook
図の一覧
Figure 1 Human Microbiome Market Segmentation
Figure 2 Human Microbiome Market by Technology: Market Attractiveness Index
Figure 3 Human Microbiome Market by Product: Market Attractiveness Index
Figure 4 Human Microbiome Market by Type: Market Attractiveness Index
Figure 5 Human Microbiome Market by Therapeutic Applications: Market Attractiveness Index
Figure 6 Human Microbiome Market Attractiveness Index by Region
Figure 7 Human Microbiome Market: Market Dynamics
Figure 8 Human Microbiome Market by Region, 2023-2033 (US$ mn, AGR (%), CAGR (%)): “V” Shaped Recovery
Figure 9 Human Microbiome Market by Region, 2023-2033 (US$ mn, AGR (%), CAGR (%)): “U” Shaped Recovery
Figure 10 Human Microbiome Market by Region, 2023-2033 (US$ mn, AGR (%), CAGR (%)): “W” Shaped Recovery
Figure 11 Human Microbiome Market by Region, 2023-2033 (US$ mn, AGR (%), CAGR (%)): “L” Shaped Recovery
Figure 12 Human Microbiome: Market: Porter’s Five Forces Analysis
Figure 13 Human Microbiome Market: PEST Analysis
Figure 14 Human Microbiome Market by Therapeutics: Market Attractiveness Index
Figure 15 Human Microbiome Market Forecast by Therapeutics, 2023-2033 (US$ million)
Figure 16 Human Microbiome Market Share Forecast by Therapeutics, 2023, 2028, 2033 (%)
Figure 17 Gastrointestinal Disorders Market Forecast by Region, 2023-2033(US$ million)
Figure 18 Gastrointestinal Disorders Market by Region, 2023 & 2033 (%)
Figure 19 Infectious Diseases Market Forecast by Region, 2023-2033(US$ million)
Figure 20 Infectious Diseases Market by Region, 2023 & 2033 (%)
Figure 21 Metabolic Disorders Market Forecast by Region, 2023-2033 (US$ million)
Figure 22 Metabolic Disorders Market Share Forecast by Region, 2023 & 2033 (%)
Figure 23 Cancer Market Forecast by Region, 2023-2033 (US$ million)
Figure 24 Cancer Market Share Forecast by Region, 2023 & 2033 (%)
Figure 25 Gut-Brain-Axis Market Forecast by Region, 2023-2033 (US$ million)
Figure 26 Gut-Brain-Axis Market Share Forecast by Region, 2023 & 2033 (%)
Figure 27 Others Market Forecast by Region, 2023-2033 (US$ million)
Figure 28 Others Market Share Forecast by Region, 2023 & 2033 (%)
Figure 29 Human Microbiome Market by Type: Market Attractiveness Index
Figure 30 Human Microbiome Market Forecast by Type, 2023-2033 (US$ million)
Figure 31 Human Microbiome Market Share Forecast by Therapeutics, 2023, 2028, 2033 (%)
Figure 32 Fecal Microbiota Transplant Market Forecast by Region, 2023-2033(US$ million)
Figure 33 Fecal Microbiota Transplant Market by Region, 2023 & 2033 (%)
Figure 34 Live Biotherapeutics Product Market Forecast by Region, 2023-2033(US$ million)
Figure 35 Live Biotherapeutics Product Market by Region, 2023 & 2033 (%)
Figure 36 Prebiotics Market Forecast by Region, 2023-2033 (US$ million)
Figure 37 Prebiotics Market Share Forecast by Region, 2023 & 2033 (%)
Figure 38 Post Biotics Market Forecast by Region, 2023-2033 (US$ million)
Figure 39 Post Biotics Market Share Forecast by Region, 2023 & 2033 (%)
Figure 40 Precision Antibiotics Market Forecast by Region, 2023-2033 (US$ million)
Figure 41 Precision Antibiotics Market Share Forecast by Region, 2023 & 2033 (%)
Figure 42 Human Microbiome Market by Type: Market Attractiveness Index
Figure 43 Human Microbiome Market Forecast by Product, 2023-2033 (US$ million)
Figure 44 Human Microbiome Market Share Forecast by Product, 2023, 2028, 2033 (%)
Figure 45 Prebiotics & Probiotics Market Forecast by Region, 2023-2033(US$ million)
Figure 46 Prebiotics & Probiotics Market by Region, 2023 & 2033 (%)
Figure 47 Medicinal Drugs Market Forecast by Region, 2023-2033(US$ million)
Figure 48 Medicinal Drugs Market by Region, 2023 & 2033 (%)
Figure 49 Diagnostics Tests Market Forecast by Region, 2023-2033 (US$ million)
Figure 50 Diagnostics Tests Market Share Forecast by Region, 2023 & 2033 (%)
Figure 51 Skin Microbiome Market Forecast by Region, 2023-2033 (US$ million)
Figure 52 Skin Microbiome Market Share Forecast by Region, 2023 & 2033 (%)
Figure 53 Human Microbiome Market by Technology: Market Attractiveness Index
Figure 54 Human Microbiome Market Forecast by Technology, 2023-2033 (US$ million)
Figure 55 Human Microbiome Market Share Forecast by Therapeutics, 2023, 2028, 2033 (%)
Figure 56 Genomics Microbiome Technology Market Forecast by Region, 2023-2033(US$ million)
Figure 57 Genomics Microbiome Technology Market Forecast by Region, 2023 & 2033 (%)
Figure 58 16sRNA Sequencing Microbiome Technology Market, 2023-2033 (US$ mn, AGR (%),
Figure 59 Shotgun Metagenomic Sequencing Microbiome Technology Market, 2023-2033 (US$ mn, AGR (%),
Figure 60 Longread Metagenomic Sequencing Microbiome Technology Market, 2023-2033 (USD $Mn, AGR (%),
Figure 61 Proteomics Market Forecast by Region, 2023-2033(US$ million)
Figure 62 Proteomics: Market by Region, 2023 & 2033 (%)
Figure 63 Metabolomics Market Forecast by Region, 2023-2033 (US$ million)
Figure 64 Metabolomics Market Share Forecast by Region, 2023 & 2033 (%)
Figure 65 Human Microbiome Market Forecast by Region 2023, 2033 (Revenue, CAGR %)
Figure 66 Human Microbiome Market Share Forecast by Region 2023, 2028, 2033 (%)
Figure 67 Human Microbiome Market by Region, 2023-2033 (US$ mn)
Figure 68 North America Human Microbiome Market Attractiveness Index
Figure 69 North America Human Microbiome Market by Region, 2023, 2028 & 2033 (US$ million)
Figure 70 North America Human Microbiome Market Forecast by Country, 2023-2033 (US$ million)
Figure 71 North America Human Microbiome Market Share Forecast by Country, 2023 & 2033 (%)
Figure 72 North America Human Microbiome Market Forecast by Therapeutics, 2023-2033 (US$ million)
Figure 73 North America Human Microbiome Market Share Forecast by Therapeutics, 2023 & 2033 (%)
Figure 74 North America Human Microbiome Market Forecast by Technology, 2023-2033 (US$ million)
Figure 75 North America Human Microbiome Market Share Forecast by Technology, 2023 & 2033 (%)
Figure 76 North America Human Microbiome Market Forecast by Type, 2023-2033 (US$ million)
Figure 77 North America Human Microbiome Market Share Forecast by Type, 2023 & 2033 (%)
Figure 78 North America Human Microbiome Market Forecast by Product, 2023-2033 (US$ million)
Figure 79 North America Human Microbiome Market Share Forecast by Product, 2023 & 2033 (%)
Figure 80 U.S. Human Microbiome Market Forecast, 2023-2033 (US$ million, AGR %)
Figure 81 Canada Human Microbiome Market Forecast, 2023-2033 (US$ million, AGR %)
Figure 82 Europe Human Microbiome Market Attractiveness Index
Figure 83 Europe Human Microbiome Market by Region, 2023, 2028 & 2033 (US$ million)
Figure 84 Europe Human Microbiome Market Forecast by Country, 2023-2033 (US$ million)
Figure 85 Europe Human Microbiome Market Share Forecast by Country, 2023 & 2033 (%)
Figure 86 Europe Human Microbiome Market Forecast by Therapeutics, 2023-2033 (US$ million)
Figure 87 Europe Human Microbiome Market Share Forecast by Therapeutics, 2023 & 2033 (%)
Figure 88 Europe Human Microbiome Market Forecast by Technology, 2023-2033 (US$ million)
Figure 89 Europe Human Microbiome Market Share Forecast by Technology, 2023 & 2033 (%)
Figure 90 Europe Human Microbiome Market Forecast by Type, 2023-2033 (US$ million)
Figure 91 Europe Human Microbiome Market Share Forecast by Type, 2023 & 2033 (%)
Figure 92 Europe Human Microbiome Market Forecast by Product, 2023-2033 (US$ million)
Figure 93 Europe Human Microbiome Market Share Forecast by Product, 2023 & 2033 (%)
Figure 94 Germany Human Microbiome Market Forecast, 2023-2033 (US$ million, AGR %)
Figure 95 U.K. Human Microbiome Market Forecast, 2023-2033 (US$ million, AGR %)
Figure 96 France Human Microbiome Market Forecast, 2023-2033 (US$ million, AGR %)
Figure 97 Italy Human Microbiome Market Forecast, 2023-2033 (US$ million, AGR %)
Figure 98 Spain Human Microbiome Market Forecast, 2023-2033 (US$ million, AGR %)
Figure 99 Rest of Europe Human Microbiome Market Forecast, 2023-2033 (US$ million, AGR %)
Figure 100 Asia-Pacific Human Microbiome Market Attractiveness Index
Figure 101 Asia-Pacific Human Microbiome Market by Region, 2023, 2028 & 2033 (US$ million)
Figure 102 Asia-Pacific Human Microbiome Market Forecast by Country, 2023-2033 (US$ million)
Figure 103 Asia-Pacific Human Microbiome Market Share Forecast by Country, 2023 & 2033 (%)
Figure 104 Asia-Pacific Human Microbiome Market Forecast by Therapeutics, 2023-2033 (US$ million)
Figure 105 Asia-Pacific Human Microbiome Market Share Forecast by Therapeutics, 2023 & 2033 (%)
Figure 106 Asia-Pacific Human Microbiome Market Forecast by Technology, 2023-2033 (US$ million)
Figure 107 Asia-Pacific Human Microbiome Market Share Forecast by Technology, 2023 & 2033 (%)
Figure 108 Asia-Pacific Human Microbiome Market Forecast by Type, 2023-2033 (US$ million)
Figure 109 Asia-Pacific Human Microbiome Market Share Forecast by Type, 2023 & 2033 (%)
Figure 110 Asia-Pacific Human Microbiome Market Forecast by Product, 2023-2033 (US$ million)
Figure 111 Asia-Pacific Human Microbiome Market Share Forecast by Product, 2023 & 2033 (%)
Figure 112 China Human Microbiome Market Forecast, 2023-2033 (US$ million, AGR %)
Figure 113 Japan Human Microbiome Market Forecast, 2023-2033 (US$ million, AGR %)
Figure 114 South Korea Human Microbiome Market Forecast, 2023-2033 (US$ million, AGR %)
Figure 115 Taiwan Human Microbiome Market Forecast, 2023-2033 (US$ million, AGR %)
Figure 116 India Human Microbiome Market Forecast, 2023-2033 (US$ million, AGR %)
Figure 117 Rest of Asia Pacific Human Microbiome Market Forecast, 2023-2033 (US$ million, AGR %)
Figure 118 Latin America Human Microbiome Market Attractiveness Index
Figure 119 Latin America Human Microbiome Market by Region, 2023, 2028 & 2033 (US$ million)
Figure 120 Latin America Human Microbiome Market Forecast by Country, 2023-2033 (US$ million)
Figure 121 Latin America Human Microbiome Market Share Forecast by Country, 2023 & 2033 (%)
Figure 122 Latin America Human Microbiome Market Forecast by Therapeutics, 2023-2033 (US$ million)
Figure 123 Latin America Human Microbiome Market Share Forecast by Therapeutics, 2023 & 2033 (%)
Figure 124 Latin America Human Microbiome Market Forecast by Technology, 2023-2033 (US$ million)
Figure 125 Latin America Human Microbiome Market Share Forecast by Technology, 2023 & 2033 (%)
Figure 126 Latin America Human Microbiome Market Forecast by Type, 2023-2033 (US$ million)
Figure 127 Latin America Human Microbiome Market Share Forecast by Type, 2023 & 2033 (%)
Figure 128 Latin America Human Microbiome Market Forecast by Product, 2023-2033 (US$ million)
Figure 129 Latin America Human Microbiome Market Share Forecast by Product, 2023 & 2033 (%)
Figure 130 Brazil Human Microbiome Market Forecast, 2023-2033 (US$ million, AGR %)
Figure 131 Mexico Human Microbiome Market Forecast, 2023-2033 (US$ million, AGR %)
Figure 132 Rest of Latin America Human Microbiome Market Forecast, 2023-2033 (US$ million, AGR %)
Figure 133 Middle East & Africa Human Microbiome Market Attractiveness Index
Figure 134 Middle East & Africa Human Microbiome Market by Region, 2023, 2028 & 2033 (US$ million)
Figure 135 Middle East & Africa Human Microbiome Market Forecast by Country, 2023-2033 (US$ million)
Figure 136 Middle East & Africa Human Microbiome Market Share Forecast by Country, 2023 & 2033 (%)
Figure 137 Middle East & Africa Human Microbiome Market Forecast by Therapeutics, 2023-2033 (US$ million)
Figure 138 Middle East & Africa Human Microbiome Market Share Forecast by Therapeutics, 2023 & 2033 (%)
Figure 139 Middle East & Africa Human Microbiome Market Forecast by Technology, 2023-2033 (US$ million)
Figure 140 Middle East & Africa Human Microbiome Market Share Forecast by Technology, 2023 & 2033 (%)
Figure 141 Middle East & Africa Human Microbiome Market Forecast by Type, 2023-2033 (US$ million)
Figure 142 Middle East & Africa Human Microbiome Market Share Forecast by Type, 2023 & 2033 (%)
Figure 143 Middle East & Africa Human Microbiome Market Forecast by Product, 2023-2033 (US$ million)
Figure 144 Middle East & Africa Human Microbiome Market Share Forecast by Product, 2023 & 2033 (%)
Figure 145 Saudi Arabia Human Microbiome Market Forecast, 2023-2033 (US$ million, AGR %)
Figure 146 UAE Human Microbiome Market Forecast, 2023-2033 (US$ million, AGR %)
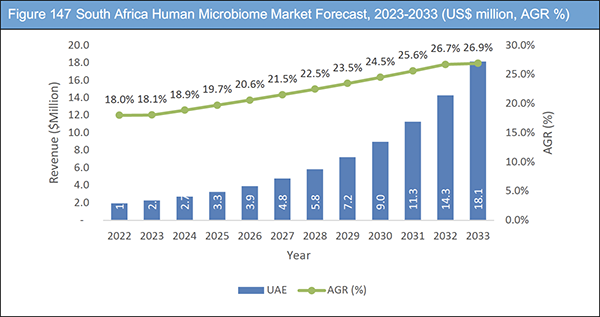
Figure 147 South Africa Human Microbiome Market Forecast, 2023-2033 (US$ million, AGR %)
Figure 148 Rest of MEA Human Microbiome Market Forecast, 2023-2033 (US$ million, AGR %)
Figure 149 Rebiotix, Inc.: Net Revenue, 2019-2021 (US$ million)
Figure 150 Rebiotix, Inc.: R&D, 2019-2021 (US$ million)
Figure 151 Seres Therapeutics, Inc.: Revenue, 2017-2021 (US$ million)
Figure 152 Seres Therapeutics, Inc.: R&D, 2017-2021 (US$ million)
Figure 153 4D Pharma plc: Revenue, 2017-2021 (US$ million)
Figure 154 4D Pharma plc: R&D Expenses, 2017-2021 (US$ million)
Figure 155 Vedanta Biosciences (a Puretech Health PLC company): Revenue, 2017-2021 (US$ million)
Figure 156 Finch Therapeutics Group, Inc.: Revenue, 2020-2021 (US$ million)
Figure 157 Finch Therapeutics Group, Inc.: R&D Expenses, 2020-2021 (US$ million)
Figure 158 Theriva Biologics: Revenue, 2017-2021 (US$ million)
Figure 159 Theriva Biologics: R&D 2017-2021 (US$ million)
Figure 160 Synlogic Inc. Revenues: 2017-2021 (US$ million)
Figure 161 Synlogic Inc. R&D Expenses 2017-2021 (US$ million)
ページTOPに戻る
Summary
Report Details
The Human Microbiome Market Report 2023-2033: This report will prove invaluable to leading firms striving for new revenue pockets if they wish to better understand the industry and its underlying dynamics. It will be useful for companies that would like to expand into different industries or to expand their existing operations in a new region.
Big Pharma Players Striving To Gain Market Entry Through Collaboration with Microbiome Players
There has been a growing interest from the big pharma players in microbiome research. Many of the big pharma players have been supporting the start-up microbiome players for their clinical drug candidate through funding and collaborations. For instance, in July 2022, Enterome a clinical stage microbiome company signed a strategic R&D collaboration with Nestle Health Science. This license agreement primarily targeted food allergy and Inflammatory Bowel Disease (IBD) under this agreement Enterome will receive an upfront payment of €40 million (US$46.9 million) in cash and equity. In return, Nestle Health Science will be eligible to receive the royalties and sales milestone payments on commercialization of the drug candidates. In February 2021, 4D Pharma Inc. has collaborated with Merck Co Ltd. and Pfizer for its oncology and vaccines to evaluate its MRx5018 in combination with BAVENCIO for treatment of locally advanced or metastatic urothelial carcinoma. Both Merck KGaA and Pfizer Inc. will co-develop and also commercialize it in collaboration. Similarly, in January 2021, Vedanta Biosciences has received US$25 million investment fund from Pfizer as a part of breakthrough growth initiative. Vedanta will use these funds for Phase II study of VE202 indicated for treatment of Inflammatory Bowel Disease. In July 2021, Seres announced its collaboration with Nestle Health Science to co-commercialize SER-109 therapeutic drug for treatment of Clostridioides difficile infection (CDI) in U.S. and Canada. In 2019, Seres had collaborated with AstraZeneca and received US$20 million as a financial support to conduct its research activity for immuno-oncology therapies. With more pharma players are entering this market, the overall market for human microbiome is expected to foresee a staggering growth during the forecast period.
Regulatory Approvals to Challenge Market Growth
The human microbiome has a huge potential in curing and treating diseases that have been difficult to treat through conventional methods. Moreover, the use of Live Biotherapeutic Products (LBPs) has been studied to be of great potential, however lack of defined regulatory approvals for human microbiomes is hampering the growth of this market. There has not been any clearly defined segregation for LBPs and their use, especially when classifying prebiotics, probiotics, and pharmaceutical products. The U.S. FDA in 2010, first time presented draft guidance for microorganisms intended to prevent and treat diseases which got updated in 2016 to officially make a category for LBPs. Similarly, the European Pharmacopeia Commission issued a draft in 2019 with a mention of LBPs to comply with the legislation of biological medicinal products with additional specific guidelines for LBPs. There has been a clear demand from the regulatory authorities regarding the benefits against the risks of LBPs. Conventional GMP practices emphasize the removal of microbes in the final product however, human microbiome products need to be in the final product. Hence, drafting new guidelines for regulatory approvals needs detailed documentation and justification as these products differ from non-therapeutic products. Risk assessment through genomic profiling is crucial as the LBPs have the potential to transfer genes to other microbes or may metabolize other drugs or hormones in the body. To avoid this, in vitro and ex-vivo studies, and animal models studies are essential. Detailed documentation of the origin of the strain, isolation procedure, and cell banking is required. In addition, the difficulty in having consistent batches of LBPs is also a major GMP regulatory hurdle. We believe, that as the market expands there will be well-defined regulatory guidelines for conducting human microbiome studies, at present the approval process poses a major challenge for the market players of this segment.
What Questions Should You Ask before Buying a Market Research Report?
• How is the human microbiome market evolving?
• What is driving and restraining the human microbiome market?
• How will each human microbiome submarket segment grow over the forecast period and how much revenue will these submarkets account for in 2033?
• How will the market shares for each human microbiome submarket develop from 2023 to 2033?
• What will be the main driver for the overall market from 2023 to 2033?
• Will leading human microbiome market broadly follow the macroeconomic dynamics, or will individual national markets outperform others?
• How will the market shares of the national markets change by 2033 and which geographical region will lead the market in 2033?
• Who are the leading players and what are their prospects over the forecast period?
• What are the human microbiome drug pipeline status for these leading companies?
• How will the industry evolve during the period between 2023 and 2033? What are the implications of human microbiome market projects taking place now and over the next 10 years?
• Is there a greater need for product commercialisation to further scale the human microbiome market?
• Where is the human microbiome market heading and how can you ensure you are at the forefront of the market?
• What are the best investment options for new product and service lines?
• What are the key prospects for moving companies into a new growth path and C-suite?
You need to discover how this will impact the human microbiome market today, and over the next 10 years:
• Our 281-page report provides 121 tables and 168 charts/graphs exclusively to you.
• The report highlights key lucrative areas in the industry so you can target them – NOW.
• It contains in-depth analysis of global, regional and national sales and growth.
• It highlights for you the key successful trends, changes and revenue projections made by your competitors.
This report tells you TODAY how the human microbiome market will develop in the next 10 years, and in line with the variations in COVID-19 economic recession and bounce. This market is more critical now than at any point over the last 10 years.
Forecasts to 2033 and other analyses reveal commercial prospects
• In addition to revenue forecasting to 2033, our new study provides you with recent results, growth rates, and market shares.
• You will find original analyses, with business outlooks and developments.
• Discover qualitative analyses (including market dynamics, drivers, opportunities, restraints and challenges), and recent developments.
This report includes data analysis and invaluable insight into how COVID-19 will affect the industry and your company. Four COVID-19 recovery patterns and their impact, namely, “V”, “L”, “W” and “U” are discussed in this report.
Segments Covered in the Report
By Therapeutics
• Gastrointestinal Disorders
• Infectious Diseases
• Metabolic Disorders
• Cancers
• Gut-Brain Axis
• Others
By Type
• Fecal Microbiota Transplant (FMT)
• Live Biotherapeutic Product (LBP)
• Prebiotics
• Post-Biotics
• Precision Antibiotics
By Product
• Prebiotics & Probiotics
• Medicinal Drugs
• Diagnostic Tests
• Skin Microbiome
By Technology
• Genomics
– 16SrRNA Amplicon Sequencing
– Shotgun Metagenomic Sequencing
– Longread Metagenomic Sequencing
• Proteomics
• Metabolomics
In addition to the revenue predictions for the overall world market and segments, you will also find revenue forecasts for five regional and 21 leading national markets:
North America
• U.S.
• Canada
Europe
• Germany
• UK
• France
• Spain
• Italy
• Rest of Europe
Asia Pacific
• China
• Japan
• India
• South Korea
• Taiwan
• Rest of Asia
Latin America
• Brazil
• Mexico
• Rest of Latin America
MEA
• Saudi Arabia
• South Africa
• UAE
• Rest of Middle East & Africa
The report also includes profiles and for some of the leading companies in the Human Microbiome Market, 2023 to 2033, with a focus on this segment of these companies’ operations.
Leading companies and the potential for market growth
• 4D Pharma Plc.
• Axial Therapeutics
• BiomX
• Enterobiome
• Enterome
• Finch Therapeutics Group Inc.
• MaaT Pharma
• Rebiotix Inc.,( a Ferring Pharmaceutical Company)
• Second Genome
• Seres Therapeutics
• Synlogic
• Theriva Biologics (ex-Synthetic Biologics)
• Vedanta Biosciences Inc.
Overall world revenue for Human Microbiome Market, 2023 to 2033 in terms of value the market will surpass US$224 million in 2023, our work calculates. We predict strong revenue growth through to 2032. Our work identifies which organizations hold the greatest potential. Discover their capabilities, progress, and commercial prospects, helping you stay ahead.
How will the Human Microbiome Market, 2023 to 2033 report help you?
In summary, our 280+ page report provides you with the following knowledge:
• Revenue forecasts to 2033 for Human Microbiome Market, 2023 to 2033 Market, with forecasts by therapeutics, type, product, technology and company size, each forecast at a global and regional level – discover the industry’s prospects, finding the most lucrative places for investments and revenues.
• Revenue forecasts to 2033 for five regional and 21 key national markets – See forecasts for the Human Microbiome, 2023 to 2033 market in North America, Europe, Asia-Pacific, Latin America, and MEA. Also forecasted is the market in the US, Canada, Mexico, Brazil, Germany, France, UK, Italy, China, India, Japan, and Taiwan among other prominent economies.
• Prospects for established firms and those seeking to enter the market – including company profiles for 13 of the major companies involved in the Human Microbiome Market, 2023 to 2033.
Find quantitative and qualitative analyses with independent predictions. Receive information that only our report contains, staying informed with invaluable business intelligence.
Information found nowhere else
With our new report, you are less likely to fall behind in knowledge or miss out on opportunities. See how our work could benefit your research, analyses, and decisions. Visiongain’s study is for everybody needing commercial analyses for the Human Microbiome Market, 2023 to 2033, market-leading companies. You will find data, trends and predictions.
ページTOPに戻る
Table of Contents
Table of Contents
1. Report Overview
1.1 Objectives of the Study
1.2 Introduction to Human Microbiome Market
1.3 What This Report Delivers
1.4 Why You Should Read This Report
1.5 Key Questions Answered by This Analytical Report
1.6 Who is This Report for?
1.7 Methodology
1.7.1 Market Definition
1.7.2 Market Evaluation & Forecasting Methodology
1.7.3 Data Validation
1.7.3.1 Primary Research
1.7.3.2 Secondary Research
1.8 Associated Visiongain Reports
1.9 About Visiongain
1.10 Frequently Asked Questions (FAQs)
2. Executive Summary
3 Market Overview
3.1 Key Findings
3.2 Market Dynamics
3.2.1 Market Driving Factors
3.2.1.1 Wide Array of Therapeutic Applications to Boost Industry Growth
3.2.1.2 Rise in Funding from Private Ventures and Government Institutes to Trigger Industry Growth
3.2.1.3 Big Pharma Players Striving to Gain Market Entry Through Collaboration with Microbiome Players
3.2.1.4 High Throughput Sequencing, Machine Learning (AI & Deep Learning) to Reinforce the Market Growth
3.2.1.5 Microbiome Biomarker Discovery Supporting the Growth of Companion Diagnostics
3.2.2 Market Restraining Factors
3.2.2.1 Regulatory Approvals to Challenge Market Growth
3.2.2.2 Formulation and Translational Manufacturing Obstacles Restraining the Market Growth
3.2.2.3 Lack of Clarity on Pricing and Reimbursement Likely to Hamper Market Growth
3.2.3 Market Opportunities
3.2.3.1 Contract Research Manufacturing Services
3.2.3.2 Nanotechnology to Support Microbiome Diagnostics
3.3 COVID-19 Impact Analysis
3.4 Porter’s Five Forces Analysis
3.4.1 Bargaining Power of Suppliers (Low to Medium)
3.4.2 Bargaining Power of Buyers (Medium to High)
3.4.3 Competitive Rivalry (Medium to High)
3.4.4 Threat from Substitutes (Low to Medium)
3.4.5 Threat of New Entrants (Medium to High)
3.5 PEST Analysis
4 Human Microbiome Market Analysis by Therapeutics
4.1 Key Findings
4.2 Human Microbiome Therapeutics Segment: Market Attractiveness Index
4.3 Human Microbiome Market Size Estimation and Forecast by Therapeutics
4.4 Gastro-Intestinal Disorders
4.4.1 Market Size by Region, 2023-2033 (US$ mn)
4.4.2 Market Share by Region, 2023 & 2033 (%)
4.5 Infectious Diseases
4.5.1 Market Size by Region, 2023-2033 (US$ mn)
4.5.2 Market Share by Region, 2023 & 2033 (%)
4.6 Metabolic Disorder
4.6.1 Market Size by Region, 2023-2033 (US$ mn)
4.6.2 Market Share by Region, 2023 & 2033 (%)
4.7 Cancer
4.7.1 Market Size by Region, 2023-2033 (US$ mn)
4.7.2 Market Share by Region, 2023 & 2033 (%)
4.8 Gut-Brain-Axis
4.8.1 Market Size by Region, 2023-2033 (US$ mn)
4.8.2 Market Share by Region, 2023 & 2033 (%)
4.9 Others
4.9.1 Market Size by Region, 2023-2033 (US$ mn)
4.9.2 Market Share by Region, 2023 & 2033 (%)
5 Human Microbiome Market Analysis by Type
5.1 Key Findings
5.2 Human Microbiome by Type Segment: Market Attractiveness Index
5.3 Human Microbiome Market Size Estimation and Forecast by Therapeutics
5.4 Fecal Microbiota Transplant (FMT)
5.4.1 Market Size by Region, 2023-2033 (US$ mn)
5.4.2 Market Share by Region, 2023 & 2033 (%)
5.5 Live Biotherapeutics Product (LBP)
5.5.1 Market Size by Region, 2023-2033 (US$ mn)
5.5.2 Market Share by Region, 2023 & 2033 (%)
5.6 Prebiotics
5.6.1 Market Size by Region, 2023-2033 (US$ mn)
5.6.2 Market Share by Region, 2023 & 2033 (%)
5.7 Post biotics
5.7.1 Market Size by Region, 2023-2033 (US$ mn)
5.7.2 Market Share by Region, 2023 & 2033 (%)
5.8 Precision Antibiotics
5.8.1 Market Size by Region, 2023-2033 (US$ mn)
5.8.2 Market Share by Region, 2023 & 2033 (%)
6 Human Microbiome Market Analysis by Product
6.1 Key Findings
6.2 Human Microbiome by Product Segment: Market Attractiveness Index
6.3 Human Microbiome Market Size Estimation and Forecast by Product
6.4 Prebiotics & Probiotics
6.4.1 Market Size by Region, 2023-2033 (US$ mn)
6.4.2 Market Share by Region, 2023 & 2033 (%)
6.5 Medicinal Drugs
6.5.1 Market Size by Region, 2023-2033 (US$ mn)
6.5.2 Market Share by Region, 2023 & 2033 (%)
6.6 Diagnostic Tests
6.6.1 Market Size by Region, 2023-2033 (US$ mn)
6.6.2 Market Share by Region, 2023 & 2033 (%)
6.7 Skin Microbiome
6.7.1 Market Size by Region, 2023-2033 (US$ mn)
6.7.2 Market Share by Region, 2023 & 2033 (%)
7 Human Microbiome Market Analysis by Technology
7.1 Key Findings
7.2 Human Microbiome by Technology Segment: Market Attractiveness Index
7.3 Human Microbiome Market Size Estimation and Forecast by Technology
7.4 Genomics
7.4.1 Market Size by Region, 2023-2033 (US$ mn)
7.4.2 Market Share by Region, 2023 & 2033 (%)
7.4.3 Genomics Market by Sequencing Type
7.4.4 16SrRNA Amplicon Sequencing
7.4.5 Shotgun Metagenomic Sequencing
7.4.6 Longread Metagenomic Sequencing
7.5 Proteomics
7.5.1 Market Size by Region, 2023-2033 (US$ mn)
7.5.2 Market Share by Region, 2023 & 2033 (%)
7.6 Metabolomics
7.6.1 Market Size by Region, 2023-2033 (US$ mn)
7.6.2 Market Share by Region, 2023 & 2033 (%)
8 Human Microbiome Market Analysis by Region
8.1 Key Findings
8.2 Regional Market Size Estimation and Forecast
9 North America Human Microbiome Market Analysis
9.1 Key Findings
9.2 North America Human Microbiome Market Attractiveness Index
9.3 North America Human Microbiome Market by Country, 2023, 2028 & 2033 (US$ mn)
9.4 North America Human Microbiome Market Size Estimation and Forecast by Country
9.5 North America Human Microbiome Market Size Estimation and Forecast by Therapeutics
9.6 North America Human Microbiome Market Size Estimation and Forecast by Technology
9.7 North America Human Microbiome Market Size Estimation and Forecast by Type
9.8 North America Human Microbiome Market Size Estimation and Forecast by Product
9.9 U.S. Human Microbiome Market Analysis
9.10 Canada Human Microbiome Market Analysis
10 Europe Human Microbiome Market Analysis
10.1 Key Findings
10.2 Europe Human Microbiome Market Attractiveness Index
10.3 Europe Human Microbiome Market by Country, 2023, 2028 & 2033 (US$ mn)
10.4 Europe Human Microbiome Market Size Estimation and Forecast by Country
10.5 Europe Human Microbiome Market Size Estimation and Forecast by Therapeutics
10.6 Europe Human Microbiome Market Size Estimation and Forecast by Technology
10.7 Europe Human Microbiome Market Size Estimation and Forecast by Type
10.8 Europe Human Microbiome Market Size Estimation and Forecast by Product
10.9 Germany Human Microbiome Market Analysis
10.10 UK Human Microbiome Market Analysis
10.11 France Human Microbiome Market Analysis
10.12 Italy Human Microbiome Market Analysis
10.13 Spain Human Microbiome Market Analysis
10.14 Rest of Europe Human Microbiome Market Analysis
11 Asia-Pacific Human Microbiome Market Analysis
11.1 Key Findings
11.2 Asia-Pacific Human Microbiome Market Attractiveness Index
11.3 Asia-Pacific Human Microbiome Market by Country, 2023, 2028 & 2033 (US$ mn)
11.4 Asia-Pacific Human Microbiome Market Size Estimation and Forecast by Country
11.5 Asia-Pacific Human Microbiome Market Size Estimation and Forecast by Therapeutics
11.6 Asia-Pacific Human Microbiome Market Size Estimation and Forecast by Technology
11.7 Asia-Pacific Human Microbiome Market Size Estimation and Forecast by Type
11.8 Asia-Pacific Human Microbiome Market Size Estimation and Forecast by Product
11.9 China Human Microbiome Market Analysis
11.10 Japan Human Microbiome Market Analysis
11.11 South Korea Human Microbiome Market Analysis
11.12 Taiwan Human Microbiome Market Analysis
11.13 India Human Microbiome Market Analysis
11.14 Rest of Asia Pacific Human Microbiome Market Analysis
12 Latin America Human Microbiome Market Analysis
12.1 Key Findings
12.2 Latin America Human Microbiome Market Attractiveness Index
12.3 Latin America Human Microbiome Market by Country, 2023, 2028 & 2033 (US$ mn)
12.4 Latin America Human Microbiome Market Size Estimation and Forecast by Country
12.5 Latin America Human Microbiome Market Size Estimation and Forecast by Therapeutics
12.6 Latin America Human Microbiome Market Size Estimation and Forecast by Technology
12.7 Latin America Human Microbiome Market Size Estimation and Forecast by Type
12.8 Latin America Human Microbiome Market Size Estimation and Forecast by Product
12.9 Brazil Human Microbiome Market Analysis
12.10 Mexico Human Microbiome Market Analysis
12.11 Rest of Latin America Human Microbiome Market Analysis
13 Middle East & Africa Human Microbiome Market Analysis
13.1 Key Findings
13.2 Middle East & Africa Human Microbiome Market Attractiveness Index
13.3 Middle East & Africa Human Microbiome Market by Country, 2023, 2028 & 2033 (US$ mn)
13.4 Middle East & Africa Human Microbiome Market Size Estimation and Forecast by Country
13.5 Middle East & Africa Human Microbiome Market Size Estimation and Forecast by Therapeutics
13.6 Middle East & Africa Human Microbiome Market Size Estimation and Forecast by Technology
13.7 Middle East & Africa Human Microbiome Market Size Estimation and Forecast by Type
13.8 Middle East & Africa Human Microbiome Market Size Estimation and Forecast by Product
13.9 Saudi Arabia Human Microbiome Market Analysis
13.10 UAE Human Microbiome Market Analysis
13.11 South Africa Human Microbiome Market Analysis
13.12 Rest of Middle East & Africa Human Microbiome Market Analysis
14 Company Profiles
14.1 Company Share Analysis
14.2 Key Business Strategy Analysis
14.3 Rebiotix Inc., (now a Ferring Company)
14.3.1 Company Snapshot
14.3.2 Company Overview
14.3.3 Financial Analysis
14.3.3.1 Net Revenue, 2019-2021
14.3.3.2 R&D, 2019-2021
14.3.4 Rebiotix, Inc.: Pipeline Status
14.3.5 Strategic Outlook
14.4 Seres Therapeutics, Inc.
14.4.1 Company Snapshot
14.4.2 Company Overview
14.4.3 Financial Analysis
14.4.3.1 Revenue, 2017-2021
14.4.3.2 R&D, 2017-2021
14.4.4 Seres Therapeutics, Inc., Pipeline Status
14.4.5 Strategic Outlook
14.5 4D Pharma plc
14.5.1 Company Snapshot
14.5.2 Company Overview
14.5.3 Financial Analysis
14.5.3.1 Revenue, 2017-2021
14.5.3.2 R&D, 2017-2021
14.5.4 4D Pharma plc: Pipeline Status
14.5.5 Strategic Outlook
14.6 Enterobiome
14.6.1 Company Snapshot
14.6.2 Company Overview
14.6.3 Enterobiome: Pipeline Status
14.6.4 Strategic Outlook
14.7 Vedanta Biosciences, Inc.,
14.7.1 Company Snapshot
14.7.2 Company Overview
14.7.3 Financial Analysis
14.7.3.1 Revenue, 2017-2021
14.7.4 Vedanta Biosciences, Inc.: Pipeline Status
14.7.5 Strategic Outlook
14.8 Second Genome
14.8.1 Company Snapshot
14.8.2 Company Overview
14.8.3 Second Genome Inc.: Pipeline Status
14.8.4 Strategic Outlook
14.9 Finch Therapeutics Group Inc.
14.9.1 Company Snapshot
14.9.2 Company Overview
14.9.3 Financial Analysis
14.9.3.1 Revenue, 2020-2021
14.9.3.2 R&D, 2020-2021
14.9.4 Finch Therapeutics Group, Inc.: Pipeline Status
14.9.5 Strategic Outlook
14.10 Enterome
14.10.1 Company Snapshot
14.10.2 Company Overview
14.10.3 Enterome: Pipeline Status
14.10.4 Strategic Outlook
14.11 Theriva Biologics (ex-Synthetic Biologics)
14.11.1 Company Snapshot
14.11.2 Company Overview
14.11.3 Financial Analysis
14.11.3.1 Revenue, 2017-2021
14.11.3.2 R&D, 2017-2021
14.11.4 Theriva Biologics: Pipeline Status
14.11.5 Strategic Outlook
14.12 Synlogic
14.12.1 Company Snapshot
14.12.2 Company Overview
14.12.3 Financial Analysis
14.12.4 Partnerships/ Strategic Collaborations
14.12.5 Strategic Outlook
14.13 Axial Therapeutics
14.13.1 Company Snapshot
14.13.2 Company Overview
14.13.3 Financial Analysis
14.13.4 Axial Therapeutics: Pipeline Status
14.13.5 Strategic Outlook
14.14 MaaT Pharma
14.14.1 Company Snapshot
14.14.2 Company Overview
14.14.3 Financial Analysis
14.14.4 MaaT Pharma: Pipeline Status
14.14.5 Strategic Outlook
14.15 BiomX
14.15.1 Company Snapshot
14.15.2 Company Overview
14.15.3 BiomX: Pipeline Status
14.15.4 Strategic Outlook
15 Conclusion and Recommendations
15.1 Concluding Remarks from Visiongain
15.2 Recommendations for Market Players
List of Tables
Table 1 Human Microbiome Market Snapshot, 2023 & 2033 (US$ million, CAGR %)
Table 2 Human Microbiome Market by Region, 2023-2033 (US$ mn, AGR (%), CAGR (%)): “U” Shaped Recovery Scenario
Table 3 Human Microbiome Market by Region, 2023-2033 (US$ mn, AGR (%), CAGR (%)): “W” Shaped Recovery Scenario
Table 4 Human Microbiome Market by Region, 2023-2033 (US$ mn, AGR (%), CAGR (%)): “L” Shaped Recovery Scenario
Table 5 Human Microbiome Market Forecast by Therapeutics, 2023-2033 (US$ mn, AGR%, CAGR %)
Table 6 Gastrointestinal Disorders Human Microbiome Pipeline Analysis
Table 7 Gastrointestinal Disorders Market by Region, 2023-2033 (US$ mn, AGR (%), CAGR (%))
Table 8 Infectious Diseases Human Microbiome Pipeline Analysis
Table 9 Infectious Diseases Market by Region, 2023-2033 (US$ mn, AGR (%), CAGR (%))
Table 10 Metabolic Disorders: Human Microbiome Pipeline Analysis
Table 11 Metabolic Disorders Market Forecast by Region, 2023-2033 (US$ mn, AGR%, CAGR %)
Table 12 Cancer: Human Microbiome Pipeline Analysis
Table 13 Cancer Market Forecast by Region, 2023-2033 (US$ mn, AGR%, CAGR %)
Table 14 Gut-Brain-Axis: Human Microbiome Pipeline Analysis
Table 15 Gut-Brain-Axis Market Forecast by Region, 2023-2033 (US$ mn, AGR%, CAGR %)
Table 16 Others Market Forecast by Region, 2023-2033 (US$ mn, AGR%, CAGR %)
Table 17 Human Microbiome Market Forecast by Type, 2023-2033 (US$ mn, AGR%, CAGR %)
Table 18 Fecal Microbiota Transplant Human Microbiome Pipeline Analysis
Table 19 Fecal Microbiota Transplant Market by Region, 2023-2033 (US$ mn, AGR (%), CAGR (%))
Table 20 Live Biotherapeutics Product: Pipeline Analysis
Table 21 Live Biotherapeutics Market by Region, 2023-2033 (US$ mn, AGR (%), CAGR (%))
Table 22 Prebiotics Market Forecast by Region, 2023-2033 (US$ mn, AGR%, CAGR %)
Table 23 Post Biotics: Pipeline Analysis
Table 24 Post Biotics Market Forecast by Region, 2023-2033 (US$ mn, AGR%, CAGR %)
Table 25 Precision Antibiotics Market Forecast by Region, 2023-2033 (US$ mn, AGR%, CAGR %)
Table 26 Human Microbiome Market Forecast by Product, 2023-2033 (US$ mn, AGR%, CAGR %)
Table 27 Prebiotics & Probiotics Market by Region, 2023-2033 (US$ mn, AGR (%), CAGR (%))
Table 28 Medicinal Drugs Market by Region, 2023-2033 (US$ mn, AGR (%), CAGR (%))
Table 29 Diagnostic Tests Market Forecast by Region, 2023-2033 (US$ mn, AGR%, CAGR %)
Table 30 Skin Microbiome Market Forecast by Region, 2023-2033 (US$ mn, AGR%, CAGR %)
Table 31 Human Microbiome Market Forecast by Technology, 2023-2033 (US$ mn, AGR%, CAGR %)
Table 32 Genomics Microbiome Technology Market by Region, 2023-2033 (US$ mn, AGR (%), CAGR (%))
Table 33 Genomics Microbiome Technology Market by Sequencing Types, 2023-2033 (US$ mn, AGR (%), CAGR (%))
Table 34 Proteomics Market by Region, 2023-2033 (US$ mn, AGR (%), CAGR (%))
Table 35 Metabolomics Market Forecast by Region, 2023-2033 (US$ mn, AGR%, CAGR %)
Table 36 Human Microbiome Market by Region, 2023-2033 (US$ mn, AGR (%), CAGR (%))
Table 37 North America Human Microbiome Market Forecast by Country, 2023-2033 (US$ mn, AGR%, CAGR %)
Table 38 North America Human Microbiome Market Forecast by Therapeutics, 2023-2033 (US$ mn, AGR%, CAGR %)
Table 39 North America Human Microbiome Market Forecast by Technology, 2023-2033 (US$ mn, AGR%, CAGR %)
Table 40 North America Human Microbiome Market Forecast by Type, 2023-2033 (US$ mn, AGR%, CAGR %)
Table 41 North America Human Microbiome Market Forecast by Product, 2023-2033 (US$ mn, AGR%, CAGR %)
Table 42 U.S. Human Microbiome Market Forecast, 2023-2033 (US$ mn, AGR%, CAGR %)
Table 43 Canada Human Microbiome Market Forecast, 2023-2033 (US$ mn, AGR%, CAGR %)
Table 44 Europe Human Microbiome Market Forecast by Country, 2023-2033 (US$ mn, AGR%, CAGR %)
Table 45 Europe Human Microbiome Market Forecast by Therapeutics, 2023-2033 (US$ mn, AGR%, CAGR %)
Table 46 Europe Human Microbiome Market Forecast by Technology, 2023-2033 (US$ mn, AGR%, CAGR %)
Table 47 Europe Human Microbiome Market Forecast by Type, 2023-2033 (US$ mn, AGR%, CAGR %)
Table 48 Europe Human Microbiome Market Forecast by Product, 2023-2033 (US$ mn, AGR%, CAGR %)
Table 49 Germany Human Microbiome Market Forecast, 2023-2033 (US$ mn, AGR%, CAGR %)
Table 50 U.K. Human Microbiome Market Forecast, 2023-2033 (US$ mn, AGR%, CAGR %)
Table 51 France Human Microbiome Market Forecast, 2023-2033 (US$ mn, AGR%, CAGR %)
Table 52 Italy Human Microbiome Market Forecast, 2023-2033 (US$ mn, AGR%, CAGR %)
Table 53 Spain Human Microbiome Market Forecast, 2023-2033 (US$ mn, AGR%, CAGR %)
Table 54 Rest of Europe Human Microbiome Market Forecast, 2023-2033 (US$ mn, AGR%, CAGR %)
Table 55 Asia-Pacific Human Microbiome Market Forecast by Country, 2023-2033 (US$ mn, AGR%, CAGR %)
Table 56 Asia-Pacific Human Microbiome Market Forecast by Therapeutics, 2023-2033 (US$ mn, AGR%, CAGR %)
Table 57 Asia-Pacific Human Microbiome Market Forecast by Technology, 2023-2033 (US$ mn, AGR%, CAGR %)
Table 58 Asia-Pacific Human Microbiome Market Forecast by Type, 2023-2033 (US$ mn, AGR%, CAGR %)
Table 59 Asia-Pacific Human Microbiome Market Forecast by Product, 2023-2033 (US$ mn, AGR%, CAGR %)
Table 60 China Human Microbiome Market Forecast, 2023-2033 (US$ mn, AGR%, CAGR %)
Table 61 Japan Human Microbiome Market Forecast, 2023-2033 (US$ mn, AGR%, CAGR %)
Table 62 South Korea Human Microbiome Market Forecast, 2023-2033 (US$ mn, AGR%, CAGR %)
Table 63 Taiwan Human Microbiome Market Forecast, 2023-2033 (US$ mn, AGR%, CAGR %)
Table 64 India Human Microbiome Market Forecast, 2023-2033 (US$ mn, AGR%, CAGR %)
Table 65 Rest of Asia Pacific Human Microbiome Market Forecast, 2023-2033 (US$ mn, AGR%, CAGR %)
Table 66 Latin America Human Microbiome Market Forecast by Country, 2023-2033 (US$ mn, AGR%, CAGR %)
Table 67 Latin America Human Microbiome Market Forecast by Therapeutics, 2023-2033 (US$ mn, AGR%, CAGR %)
Table 68 Latin America Human Microbiome Market Forecast by Technology, 2023-2033 (US$ mn, AGR%, CAGR %)
Table 69 Latin America Human Microbiome Market Forecast by Type, 2023-2033 (US$ mn, AGR%, CAGR %)
Table 70 Latin America Human Microbiome Market Forecast by Product, 2023-2033 (US$ mn, AGR%, CAGR %)
Table 71 Brazil Human Microbiome Market Forecast, 2023-2033 (US$ mn, AGR%, CAGR %)
Table 72 Mexico Human Microbiome Market Forecast, 2023-2033 (US$ mn, AGR%, CAGR %)
Table 73 Rest of Latin America Human Microbiome Market Forecast, 2023-2033 (US$ mn, AGR%, CAGR %)
Table 74 Middle East & Africa Human Microbiome Market Forecast by Country, 2023-2033 (US$ mn, AGR%, CAGR %)
Table 75 Middle East & Africa Human Microbiome Market Forecast by Therapeutics, 2023-2033 (US$ mn, AGR%, CAGR %)
Table 76 Middle East & Africa Human Microbiome Market Forecast by Technology, 2023-2033 (US$ mn, AGR%, CAGR %)
Table 77 Middle East & Africa Human Microbiome Market Forecast by Type, 2023-2033 (US$ mn, AGR%, CAGR %)
Table 78 Middle East & Africa Human Microbiome Market Forecast by Product, 2023-2033 (US$ mn, AGR%, CAGR %)
Table 79 Saudi Arabia Human Microbiome Market Forecast, 2023-2033 (US$ mn, AGR%, CAGR %)
Table 80 UAE Human Microbiome Market Forecast, 2023-2033 (US$ mn, AGR%, CAGR %)
Table 81 South Africa Human Microbiome Market Forecast, 2023-2033 (US$ mn, AGR%, CAGR %)
Table 82 Rest of MEA Human Microbiome Market Forecast, 2023-2033 (US$ mn, AGR%, CAGR %)
Table 83 Key Business Strategies Adopted by Key Players in Human Microbiome Market
Table 84 Rebiotix Inc.: Key Details, (CEO, HQ, Revenue, Founded, No. of Employees, Company Type, Website, Business Segment)
Table 85 Rebiotix, Inc.: Pipeline Development
Table 86 Rebiotix, Inc.: Strategic Outlook
Table 87 Seres Therapeutics, Inc.: Key Details, (CEO, HQ, Revenue, Founded, No. of Employees, Company Type, Website, Business Segment)
Table 88 Seres Therapeutics, Inc.: Product Pipeline
Table 89 Seres Therapeutics, Inc.: Strategic Outlook
Table 90 4D Pharma plc: Key Details, (CEO, HQ, Revenue, Founded, No. of Employees, Company Type, Website, Business Segment)
Table 91 4D Pharma plc: Live Biotherapeutics Pipeline
Table 92 4D Pharma plc: Strategic Outlook
Table 93 Enterobiome: Key Details, (CEO, HQ, Revenue, Founded, No. of Employees, Company Type, Website, Business Segment)
Table 94 Enterobiome: Microbiome Pipeline
Table 95 Enterobiome: Strategic Outlook
Table 96 Vedanta Biosciences,Inc.: Key Details, (CEO, HQ, Revenue, Founded, No. of Employees, Company Type, Website, Business Segment)
Table 97 Vedanta Biosciences (a Puretech Health PLC company),: Pipeline
Table 98 Vedanta Biosciences,Inc.,: Strategic Outlook
Table 99 Second Genome Plc: Key Details, (CEO, HQ, Revenue, Founded, No. of Employees, Company Type, Website, Business Segment)
Table 100 Second Genome Inc.: Pipeline Status
Table 101 Second Genome Plc: Strategic Outlook
Table 102 Finch Therapeutics Group, Inc..: Key Details, (CEO, HQ, Revenue, Founded, No. of Employees, Company Type, Website, Business Segment)
Table 103 Finch Therapeutics Group, Inc.: Pipeline Status
Table 104 Finch Therapeutics Group, Inc..: Strategic Outlook
Table 105 Enterome: Key Details, (CEO, HQ, Revenue, Founded, No. of Employees, Company Type, Website, Business Segment)
Table 106 Enterome: Pipeline Status
Table 107 Enterome: Strategic Outlook
Table 108 Theriva Biologics: Key Details, (CEO, HQ, Revenue, Founded, No. of Employees, Company Type, Website, Business Segment)
Table 109 Theriva Biologics: Pipeline Status
Table 110 Theriva Biologics: Strategic Outlook
Table 111 Synlogic: Key Details, (CEO, HQ, Revenue, Founded, No. of Employees, Company Type, Website, Business Segment)
Table 112 Synlogic: Pipeline Status
Table 113 Synlogic : Strategic Outlook
Table 114 Axial Therapeutics: Key Details, (CEO, HQ, Revenue, Founded, No. of Employees, Company Type, Website, Business Segment)
Table 115 Axial Therapeutics: Pipeline
Table 116 Axial Therapeutics : Strategic Outlook
Table 117 MaaT Pharma: Key Details, (CEO, HQ, Revenue, Founded, No. of Employees, Company Type, Website, Business Segment)
Table 118 MaaT Pharma : Pipeline Analysis
Table 119 MaaT : Strategic Outlook
Table 120 BiomX: mRNA Pipeline
Table 121 BiomX: Strategic Outlook
List of Figures
Figure 1 Human Microbiome Market Segmentation
Figure 2 Human Microbiome Market by Technology: Market Attractiveness Index
Figure 3 Human Microbiome Market by Product: Market Attractiveness Index
Figure 4 Human Microbiome Market by Type: Market Attractiveness Index
Figure 5 Human Microbiome Market by Therapeutic Applications: Market Attractiveness Index
Figure 6 Human Microbiome Market Attractiveness Index by Region
Figure 7 Human Microbiome Market: Market Dynamics
Figure 8 Human Microbiome Market by Region, 2023-2033 (US$ mn, AGR (%), CAGR (%)): “V” Shaped Recovery
Figure 9 Human Microbiome Market by Region, 2023-2033 (US$ mn, AGR (%), CAGR (%)): “U” Shaped Recovery
Figure 10 Human Microbiome Market by Region, 2023-2033 (US$ mn, AGR (%), CAGR (%)): “W” Shaped Recovery
Figure 11 Human Microbiome Market by Region, 2023-2033 (US$ mn, AGR (%), CAGR (%)): “L” Shaped Recovery
Figure 12 Human Microbiome: Market: Porter’s Five Forces Analysis
Figure 13 Human Microbiome Market: PEST Analysis
Figure 14 Human Microbiome Market by Therapeutics: Market Attractiveness Index
Figure 15 Human Microbiome Market Forecast by Therapeutics, 2023-2033 (US$ million)
Figure 16 Human Microbiome Market Share Forecast by Therapeutics, 2023, 2028, 2033 (%)
Figure 17 Gastrointestinal Disorders Market Forecast by Region, 2023-2033(US$ million)
Figure 18 Gastrointestinal Disorders Market by Region, 2023 & 2033 (%)
Figure 19 Infectious Diseases Market Forecast by Region, 2023-2033(US$ million)
Figure 20 Infectious Diseases Market by Region, 2023 & 2033 (%)
Figure 21 Metabolic Disorders Market Forecast by Region, 2023-2033 (US$ million)
Figure 22 Metabolic Disorders Market Share Forecast by Region, 2023 & 2033 (%)
Figure 23 Cancer Market Forecast by Region, 2023-2033 (US$ million)
Figure 24 Cancer Market Share Forecast by Region, 2023 & 2033 (%)
Figure 25 Gut-Brain-Axis Market Forecast by Region, 2023-2033 (US$ million)
Figure 26 Gut-Brain-Axis Market Share Forecast by Region, 2023 & 2033 (%)
Figure 27 Others Market Forecast by Region, 2023-2033 (US$ million)
Figure 28 Others Market Share Forecast by Region, 2023 & 2033 (%)
Figure 29 Human Microbiome Market by Type: Market Attractiveness Index
Figure 30 Human Microbiome Market Forecast by Type, 2023-2033 (US$ million)
Figure 31 Human Microbiome Market Share Forecast by Therapeutics, 2023, 2028, 2033 (%)
Figure 32 Fecal Microbiota Transplant Market Forecast by Region, 2023-2033(US$ million)
Figure 33 Fecal Microbiota Transplant Market by Region, 2023 & 2033 (%)
Figure 34 Live Biotherapeutics Product Market Forecast by Region, 2023-2033(US$ million)
Figure 35 Live Biotherapeutics Product Market by Region, 2023 & 2033 (%)
Figure 36 Prebiotics Market Forecast by Region, 2023-2033 (US$ million)
Figure 37 Prebiotics Market Share Forecast by Region, 2023 & 2033 (%)
Figure 38 Post Biotics Market Forecast by Region, 2023-2033 (US$ million)
Figure 39 Post Biotics Market Share Forecast by Region, 2023 & 2033 (%)
Figure 40 Precision Antibiotics Market Forecast by Region, 2023-2033 (US$ million)
Figure 41 Precision Antibiotics Market Share Forecast by Region, 2023 & 2033 (%)
Figure 42 Human Microbiome Market by Type: Market Attractiveness Index
Figure 43 Human Microbiome Market Forecast by Product, 2023-2033 (US$ million)
Figure 44 Human Microbiome Market Share Forecast by Product, 2023, 2028, 2033 (%)
Figure 45 Prebiotics & Probiotics Market Forecast by Region, 2023-2033(US$ million)
Figure 46 Prebiotics & Probiotics Market by Region, 2023 & 2033 (%)
Figure 47 Medicinal Drugs Market Forecast by Region, 2023-2033(US$ million)
Figure 48 Medicinal Drugs Market by Region, 2023 & 2033 (%)
Figure 49 Diagnostics Tests Market Forecast by Region, 2023-2033 (US$ million)
Figure 50 Diagnostics Tests Market Share Forecast by Region, 2023 & 2033 (%)
Figure 51 Skin Microbiome Market Forecast by Region, 2023-2033 (US$ million)
Figure 52 Skin Microbiome Market Share Forecast by Region, 2023 & 2033 (%)
Figure 53 Human Microbiome Market by Technology: Market Attractiveness Index
Figure 54 Human Microbiome Market Forecast by Technology, 2023-2033 (US$ million)
Figure 55 Human Microbiome Market Share Forecast by Therapeutics, 2023, 2028, 2033 (%)
Figure 56 Genomics Microbiome Technology Market Forecast by Region, 2023-2033(US$ million)
Figure 57 Genomics Microbiome Technology Market Forecast by Region, 2023 & 2033 (%)
Figure 58 16sRNA Sequencing Microbiome Technology Market, 2023-2033 (US$ mn, AGR (%),
Figure 59 Shotgun Metagenomic Sequencing Microbiome Technology Market, 2023-2033 (US$ mn, AGR (%),
Figure 60 Longread Metagenomic Sequencing Microbiome Technology Market, 2023-2033 (USD $Mn, AGR (%),
Figure 61 Proteomics Market Forecast by Region, 2023-2033(US$ million)
Figure 62 Proteomics: Market by Region, 2023 & 2033 (%)
Figure 63 Metabolomics Market Forecast by Region, 2023-2033 (US$ million)
Figure 64 Metabolomics Market Share Forecast by Region, 2023 & 2033 (%)
Figure 65 Human Microbiome Market Forecast by Region 2023, 2033 (Revenue, CAGR %)
Figure 66 Human Microbiome Market Share Forecast by Region 2023, 2028, 2033 (%)
Figure 67 Human Microbiome Market by Region, 2023-2033 (US$ mn)
Figure 68 North America Human Microbiome Market Attractiveness Index
Figure 69 North America Human Microbiome Market by Region, 2023, 2028 & 2033 (US$ million)
Figure 70 North America Human Microbiome Market Forecast by Country, 2023-2033 (US$ million)
Figure 71 North America Human Microbiome Market Share Forecast by Country, 2023 & 2033 (%)
Figure 72 North America Human Microbiome Market Forecast by Therapeutics, 2023-2033 (US$ million)
Figure 73 North America Human Microbiome Market Share Forecast by Therapeutics, 2023 & 2033 (%)
Figure 74 North America Human Microbiome Market Forecast by Technology, 2023-2033 (US$ million)
Figure 75 North America Human Microbiome Market Share Forecast by Technology, 2023 & 2033 (%)
Figure 76 North America Human Microbiome Market Forecast by Type, 2023-2033 (US$ million)
Figure 77 North America Human Microbiome Market Share Forecast by Type, 2023 & 2033 (%)
Figure 78 North America Human Microbiome Market Forecast by Product, 2023-2033 (US$ million)
Figure 79 North America Human Microbiome Market Share Forecast by Product, 2023 & 2033 (%)
Figure 80 U.S. Human Microbiome Market Forecast, 2023-2033 (US$ million, AGR %)
Figure 81 Canada Human Microbiome Market Forecast, 2023-2033 (US$ million, AGR %)
Figure 82 Europe Human Microbiome Market Attractiveness Index
Figure 83 Europe Human Microbiome Market by Region, 2023, 2028 & 2033 (US$ million)
Figure 84 Europe Human Microbiome Market Forecast by Country, 2023-2033 (US$ million)
Figure 85 Europe Human Microbiome Market Share Forecast by Country, 2023 & 2033 (%)
Figure 86 Europe Human Microbiome Market Forecast by Therapeutics, 2023-2033 (US$ million)
Figure 87 Europe Human Microbiome Market Share Forecast by Therapeutics, 2023 & 2033 (%)
Figure 88 Europe Human Microbiome Market Forecast by Technology, 2023-2033 (US$ million)
Figure 89 Europe Human Microbiome Market Share Forecast by Technology, 2023 & 2033 (%)
Figure 90 Europe Human Microbiome Market Forecast by Type, 2023-2033 (US$ million)
Figure 91 Europe Human Microbiome Market Share Forecast by Type, 2023 & 2033 (%)
Figure 92 Europe Human Microbiome Market Forecast by Product, 2023-2033 (US$ million)
Figure 93 Europe Human Microbiome Market Share Forecast by Product, 2023 & 2033 (%)
Figure 94 Germany Human Microbiome Market Forecast, 2023-2033 (US$ million, AGR %)
Figure 95 U.K. Human Microbiome Market Forecast, 2023-2033 (US$ million, AGR %)
Figure 96 France Human Microbiome Market Forecast, 2023-2033 (US$ million, AGR %)
Figure 97 Italy Human Microbiome Market Forecast, 2023-2033 (US$ million, AGR %)
Figure 98 Spain Human Microbiome Market Forecast, 2023-2033 (US$ million, AGR %)
Figure 99 Rest of Europe Human Microbiome Market Forecast, 2023-2033 (US$ million, AGR %)
Figure 100 Asia-Pacific Human Microbiome Market Attractiveness Index
Figure 101 Asia-Pacific Human Microbiome Market by Region, 2023, 2028 & 2033 (US$ million)
Figure 102 Asia-Pacific Human Microbiome Market Forecast by Country, 2023-2033 (US$ million)
Figure 103 Asia-Pacific Human Microbiome Market Share Forecast by Country, 2023 & 2033 (%)
Figure 104 Asia-Pacific Human Microbiome Market Forecast by Therapeutics, 2023-2033 (US$ million)
Figure 105 Asia-Pacific Human Microbiome Market Share Forecast by Therapeutics, 2023 & 2033 (%)
Figure 106 Asia-Pacific Human Microbiome Market Forecast by Technology, 2023-2033 (US$ million)
Figure 107 Asia-Pacific Human Microbiome Market Share Forecast by Technology, 2023 & 2033 (%)
Figure 108 Asia-Pacific Human Microbiome Market Forecast by Type, 2023-2033 (US$ million)
Figure 109 Asia-Pacific Human Microbiome Market Share Forecast by Type, 2023 & 2033 (%)
Figure 110 Asia-Pacific Human Microbiome Market Forecast by Product, 2023-2033 (US$ million)
Figure 111 Asia-Pacific Human Microbiome Market Share Forecast by Product, 2023 & 2033 (%)
Figure 112 China Human Microbiome Market Forecast, 2023-2033 (US$ million, AGR %)
Figure 113 Japan Human Microbiome Market Forecast, 2023-2033 (US$ million, AGR %)
Figure 114 South Korea Human Microbiome Market Forecast, 2023-2033 (US$ million, AGR %)
Figure 115 Taiwan Human Microbiome Market Forecast, 2023-2033 (US$ million, AGR %)
Figure 116 India Human Microbiome Market Forecast, 2023-2033 (US$ million, AGR %)
Figure 117 Rest of Asia Pacific Human Microbiome Market Forecast, 2023-2033 (US$ million, AGR %)
Figure 118 Latin America Human Microbiome Market Attractiveness Index
Figure 119 Latin America Human Microbiome Market by Region, 2023, 2028 & 2033 (US$ million)
Figure 120 Latin America Human Microbiome Market Forecast by Country, 2023-2033 (US$ million)
Figure 121 Latin America Human Microbiome Market Share Forecast by Country, 2023 & 2033 (%)
Figure 122 Latin America Human Microbiome Market Forecast by Therapeutics, 2023-2033 (US$ million)
Figure 123 Latin America Human Microbiome Market Share Forecast by Therapeutics, 2023 & 2033 (%)
Figure 124 Latin America Human Microbiome Market Forecast by Technology, 2023-2033 (US$ million)
Figure 125 Latin America Human Microbiome Market Share Forecast by Technology, 2023 & 2033 (%)
Figure 126 Latin America Human Microbiome Market Forecast by Type, 2023-2033 (US$ million)
Figure 127 Latin America Human Microbiome Market Share Forecast by Type, 2023 & 2033 (%)
Figure 128 Latin America Human Microbiome Market Forecast by Product, 2023-2033 (US$ million)
Figure 129 Latin America Human Microbiome Market Share Forecast by Product, 2023 & 2033 (%)
Figure 130 Brazil Human Microbiome Market Forecast, 2023-2033 (US$ million, AGR %)
Figure 131 Mexico Human Microbiome Market Forecast, 2023-2033 (US$ million, AGR %)
Figure 132 Rest of Latin America Human Microbiome Market Forecast, 2023-2033 (US$ million, AGR %)
Figure 133 Middle East & Africa Human Microbiome Market Attractiveness Index
Figure 134 Middle East & Africa Human Microbiome Market by Region, 2023, 2028 & 2033 (US$ million)
Figure 135 Middle East & Africa Human Microbiome Market Forecast by Country, 2023-2033 (US$ million)
Figure 136 Middle East & Africa Human Microbiome Market Share Forecast by Country, 2023 & 2033 (%)
Figure 137 Middle East & Africa Human Microbiome Market Forecast by Therapeutics, 2023-2033 (US$ million)
Figure 138 Middle East & Africa Human Microbiome Market Share Forecast by Therapeutics, 2023 & 2033 (%)
Figure 139 Middle East & Africa Human Microbiome Market Forecast by Technology, 2023-2033 (US$ million)
Figure 140 Middle East & Africa Human Microbiome Market Share Forecast by Technology, 2023 & 2033 (%)
Figure 141 Middle East & Africa Human Microbiome Market Forecast by Type, 2023-2033 (US$ million)
Figure 142 Middle East & Africa Human Microbiome Market Share Forecast by Type, 2023 & 2033 (%)
Figure 143 Middle East & Africa Human Microbiome Market Forecast by Product, 2023-2033 (US$ million)
Figure 144 Middle East & Africa Human Microbiome Market Share Forecast by Product, 2023 & 2033 (%)
Figure 145 Saudi Arabia Human Microbiome Market Forecast, 2023-2033 (US$ million, AGR %)
Figure 146 UAE Human Microbiome Market Forecast, 2023-2033 (US$ million, AGR %)
Figure 147 South Africa Human Microbiome Market Forecast, 2023-2033 (US$ million, AGR %)
Figure 148 Rest of MEA Human Microbiome Market Forecast, 2023-2033 (US$ million, AGR %)
Figure 149 Rebiotix, Inc.: Net Revenue, 2019-2021 (US$ million)
Figure 150 Rebiotix, Inc.: R&D, 2019-2021 (US$ million)
Figure 151 Seres Therapeutics, Inc.: Revenue, 2017-2021 (US$ million)
Figure 152 Seres Therapeutics, Inc.: R&D, 2017-2021 (US$ million)
Figure 153 4D Pharma plc: Revenue, 2017-2021 (US$ million)
Figure 154 4D Pharma plc: R&D Expenses, 2017-2021 (US$ million)
Figure 155 Vedanta Biosciences (a Puretech Health PLC company): Revenue, 2017-2021 (US$ million)
Figure 156 Finch Therapeutics Group, Inc.: Revenue, 2020-2021 (US$ million)
Figure 157 Finch Therapeutics Group, Inc.: R&D Expenses, 2020-2021 (US$ million)
Figure 158 Theriva Biologics: Revenue, 2017-2021 (US$ million)
Figure 159 Theriva Biologics: R&D 2017-2021 (US$ million)
Figure 160 Synlogic Inc. Revenues: 2017-2021 (US$ million)
Figure 161 Synlogic Inc. R&D Expenses 2017-2021 (US$ million)
ページTOPに戻る
本レポートと同じKEY WORD()の最新刊レポート
- 本レポートと同じKEY WORDの最新刊レポートはありません。
よくあるご質問
Visiongain社はどのような調査会社ですか?
英国の調査会社ヴィジョンゲイン社(Visiongain)は、通信とエネルギーのほか、自動車や化学・医薬品、金属など、広範な市場を対象に調査を行っています。自動車市場については、市場全般に関する調査のほ... もっと見る
調査レポートの納品までの日数はどの程度ですか?
在庫のあるものは速納となりますが、平均的には 3-4日と見て下さい。
但し、一部の調査レポートでは、発注を受けた段階で内容更新をして納品をする場合もあります。
発注をする前のお問合せをお願いします。
注文の手続きはどのようになっていますか?
1)お客様からの御問い合わせをいただきます。
2)見積書やサンプルの提示をいたします。
3)お客様指定、もしくは弊社の発注書をメール添付にて発送してください。
4)データリソース社からレポート発行元の調査会社へ納品手配します。
5) 調査会社からお客様へ納品されます。最近は、pdfにてのメール納品が大半です。
お支払方法の方法はどのようになっていますか?
納品と同時にデータリソース社よりお客様へ請求書(必要に応じて納品書も)を発送いたします。
お客様よりデータリソース社へ(通常は円払い)の御振り込みをお願いします。
請求書は、納品日の日付で発行しますので、翌月最終営業日までの当社指定口座への振込みをお願いします。振込み手数料は御社負担にてお願いします。
お客様の御支払い条件が60日以上の場合は御相談ください。
尚、初めてのお取引先や個人の場合、前払いをお願いすることもあります。ご了承のほど、お願いします。
データリソース社はどのような会社ですか?
当社は、世界各国の主要調査会社・レポート出版社と提携し、世界各国の市場調査レポートや技術動向レポートなどを日本国内の企業・公官庁及び教育研究機関に提供しております。
世界各国の「市場・技術・法規制などの」実情を調査・収集される時には、データリソース社にご相談ください。
お客様の御要望にあったデータや情報を抽出する為のレポート紹介や調査のアドバイスも致します。
|
|


