無菌注射剤の受託製造アウトソーシング(CMO)市場レポート:2022-2032
Contract Manufacturing Outsourcing (CMO) of Sterile Injectable Drugs Market Report 2022-2032
レポート詳細
無菌注射剤の受託製造アウトソーシング(CMO)市場レポート 2022-2032 :本レポートは、新たな収益の柱を目指すリーディングカンパニーが、業界とその背景にあるダイナミクスをより深く... もっと見る
※上記価格は部署ライセンス(Departmental licence)価格です。
その他の価格についてはデータリソースまでお問合せください。
日本語のページは自動翻訳を利用し作成しています。
実際のレポートは英文のみでご納品いたします。
サマリー
レポート詳細
無菌注射剤の受託製造アウトソーシング(CMO)市場レポート 2022-2032:本レポートは、新たな収益の柱を目指すリーディングカンパニーが、業界とその背景にあるダイナミクスをより深く理解する上で、非常に有益なものとなるでしょう。また、異業種への進出や新地域での既存事業の拡大を目指す企業にとっても有用なレポートです。
製薬会社による医薬品製造のアウトソーシング需要の高まりが市場成長を後押し
ここ数十年の間に、医薬品製造受託機関(CMO)は、製薬企業の社内研究・生産部門に代わる有力な選択肢として発展してきました。医薬品製造受託機関(CMO)は、製薬企業のバリューチェーンに組み込まれるようになり、成功するビジネスモデルであることが証明されています。しかし、この分野全体が拡大しているにもかかわらず、多くのCMOは新たな障害に遭遇しています。経費の増加、テクノロジーの絶え間ない向上、M&Aの急増の結果、この分野での競争は激化しています。こうしたことを考慮した結果、組織は自らの地位を守り、向上させるためにどのような行動をとるかを決めなければなりません。
アジア太平洋地域の製造コストは北米やヨーロッパに比べてはるかに低く、有利な法律がCMO事業の隆盛を後押ししています。原薬製造は中国やインドにシフトしていますが、米国は依然として医薬品開発アウトソーシングの主要な拠点となっています。この背景には、豊富な資金や大学への研究拠点の集中などがあります。また、貧困国での医薬品開発は、品質の問題、物流の制約、法的な問題などがあり、不利な状況にあります。
小規模メーカーとの競争激化が市場成長の足かせに
市場廃止は、製品寿命と市場存続のための評価プロセス全体の観点から検討される。医薬品の製造中止とは、安全性や有効性以外の理由で市場から撤去・回収され、二度と製造・販売・輸出・軍事利用されることのない認可製品を指します。製薬会社が市場から医薬品を撤退させる可能性は、経済的損失、信用の失墜、治療研究の中断など深刻な影響を及ぼしかねません。
消費者製品の文献には、特にスキミングや浸透価格といった、よく発達した支配的な価格設定方法が記載されています。医薬品は、他の製品と同じように市場力学的な価格設定メカニズムが用いられている。現在の市場調査によると、製品の価格設定を決定する主な要因は、より大きな治療上の利益である。以前から市場に出回っている医薬品よりも臨床的なメリットが大きければ大きいほど、製品の初期価格は高くなります。もし、無菌注射薬の製品寿命が延びなければ、この事件は企業に大きな損失をもたらし、最終的には製品の製造中止となるかもしれません。
マーケットリサーチレポートを購入する前に、どのような質問をすべきでしょうか?
- 無菌注射剤CMO市場はどのように進化しているのか?
- 無菌注射剤CMO市場の推進要因と抑制要因は何か?
- 無菌注射剤CMOの各サブマーケット区分は予測期間中にどのように成長し、2032年にこれらのサブマーケットが占める売上はどの程度になるのでしょうか?
- 2022年から2032年にかけて、無菌注射剤CMOの各サブマーケットの市場シェアはどのように推移するのでしょうか?
- 2022年から2032年にかけて、市場全体の主なドライバーは何でしょうか?
- 無菌注射剤CMOの主要市場はマクロ経済のダイナミクスに概ね追随するのか、それとも個々の国内市場が他を凌駕するのか?
- 2032年までに各国市場のシェアはどのように変化し、どの地域が2032年に市場をリードするのか?
- 主要プレイヤーは誰か、また予測期間中の見通しは?
- これらの主要企業の無菌注射剤CMOプロジェクトはどのようなものですか?
- 2022年から2032年にかけて、業界はどのように進化していくのか?現在および今後10年間に実施される無菌注射剤CMOプロジェクトにはどのような意味があるのでしょうか?
- 無菌注射剤CMO市場をさらに拡大するために、製品の商業化の必要性は高まっているか?
- 無菌注射剤CMO市場はどこへ向かい、どのようにすれば市場の最前線に立つことができますか?
- 新製品やサービスラインに対する最適な投資オプションは何か?
- 企業を新たな成長軌道に乗せ、C-suiteに移行させるための重要な展望とは?
このことが、現在および今後10年間の無菌注射剤CMO市場にどのような影響を及ぼすかを知る必要があります。
- 本レポートは357ページにわたり、116の表と175のグラフを掲載しています。
- このレポートでは、業界における主要な収益性の高い分野をハイライトしているため、今すぐターゲットを絞ることができます。
- 世界、地域、国別の売上高と成長率を詳細に分析しています。
- 競合他社が成功した主要なトレンド、変化、収益予測をハイライトしています。
本レポートは、無菌注射剤CMO市場が今後10年間にどのように発展し、COVID-19の景気後退と回復の変動に沿うものであるかを教えてくれます。この市場は、過去10年間のどの時点よりも今が重要なのです。
2032年までの予測やその他の分析により、商業的な展望が見えてくる
- 2032年までの収益予測に加え、直近の実績、成長率、市場シェアもご覧いただけます。
- ビジネスの展望や展開など、独自の分析もご覧いただけます。
- 定性的分析(市場力学、促進要因、機会、阻害要因、課題など)、コスト構造、無菌注射剤CMOの価格上昇の影響、最近の開発状況などをご覧いただけます。
本レポートでは、COVID-19が業界と貴社にどのような影響を与えるかについて、データ分析と貴重な洞察を掲載しています。本レポートでは、COVID-19の4つの回収パターンとその影響、すなわち「V」、「L」、「W」、「U」について論じています。
報告書の対象セグメント
分子タイプ
- 低分子
- 高分子
タイプ
- モノクローナル抗体 (mAbs)
- サイトカイン
- インスリン
- ペプチドホルモン
- ワクチン
- 免疫グロブリン
- 血液凝固因子
- ペプチド系抗生物質
- その他
用途
- 癌
- 糖尿病
- 循環器疾患
- 中枢神経系
- 感染症
- その他
容器タイプ
- ボトル
- アンプル
- バイアル
- プレフィルドシリンジ
- バッグ
投与経路
- 皮下投与(SC)
- 静脈内投与(IV)
- 筋肉内投与(IM)
- その他
世界市場全体とセグメントの収益予測に加え、5つの地域と18の主要国市場の収益予測も掲載しています。
北米
- 米国
- カナダ
欧州
- ドイツ
- 英国
- フランス
- スペイン
- イタリア
- ロシア
- その他の欧州
アジア太平洋
- 中国
- 日本
- インド
- オーストラリア
- 韓国
- その他のアジア太平洋地域
ラテンアメリカ
- ブラジル
- メキシコ
- その他のラテンアメリカ地域
MEA
- GCC
- 南アフリカ
- その他のMEA地域
無菌注射剤の受託製造アウトソーシング(CMO)市場の2022年から2032年にかけての主要企業のプロファイルと、これらの企業のこのセグメントを中心とした情報も掲載しています。
主要企業と市場成長の可能性
・ Adare Pharma Solutions
・ Aenova Group
・ Almac Group
・ Avara Pharmaceutical Services, Inc.
・ Baxter International Inc.
・ Boehringer Ingelheim International GmbH
・ Catalent, Inc.
・ CordenPharma
・ Eli Lilly and Company
・ Evonik Industries AG
・ F. Hoffmann-La Roche Ltd
・ FAMAR Health Care Services
・ Fresenius Kabi Ag
・ Grifols SA
・ Hikma Pharmaceuticals PLC
・ Jubilant Pharmova Limited
・ Lonza
・ Nexus Pharmaceuticals, Inc.
・ Patheon, Inc. (Thermo Fischer)
・ Pfizer CentreOne
・ Recipharm AB
・ Siegfried Holding AG
無菌注射剤の受託製造アウトソーシング(CMO)市場の世界全体の収益、金額ベースで2022年から2032年まで、市場は2023年に223億米ドルを突破すると、我々の仕事は計算している。また、2032年までの間に収益が大きく伸びると予測しています。本調査では、最も大きな可能性を秘めた企業を特定します。彼らの能力、進歩、商業的展望を発見することで、一歩先を行くことができます。
無菌注射剤の受託製造アウトソーシング(CMO)市場、2022年から2032年までのレポートはどのように役立つのでしょうか?
370ページを超えるレポートでは、要約すると以下のような知識を得ることができます。
- 無菌注射剤の受託製造アウトソーシング(CMO)市場の2032年までの収益予測、分子タイプ、タイプ、用途、容器タイプ、投与経路の各予測を世界および地域レベルで掲載 - 投資と収益に最も有利な場所を見つけ、業界の展望を発見する。
- 5地域と18主要国市場の2032年までの収益予測 - 北米、欧州、アジア太平洋、LA、MEAの無菌注射剤の受託製造アウトソーシング(CMO)市場、2022年から2032年までの市場予測をご覧いただけます。また、米国、カナダ、メキシコ、ブラジル、ドイツ、フランス、英国、イタリア、中国、インド、日本、オーストラリアなどの主要経済圏の市場も予測されています。
- 既存企業や市場参入を目指す企業の展望 - 無菌注射剤の受託製造アウトソーシング(CMO)市場に関わる主要企業22社の企業プロファイルを含む、2022年から2032年までの市場予測。
定量的・定性的な分析と独自の予測をご覧いただけます。私たちのレポートだけが持つ情報を入手し、貴重なビジネスインテリジェンスを得ることができます。
他にはない情報
私たちの新しいレポートがあれば、知識の遅れを取り戻し、チャンスを逃す可能性が低くなります。私たちの研究が貴社の調査、分析、意思決定にどのように役立つかをご覧ください。Visiongainの調査は、無菌注射剤の受託製造アウトソーシング(CMO)市場、2022年から2032年、市場をリードする企業のための商業分析を必要とするすべての人のためのものです。データ、トレンド、予測を見つけることができます。
ページTOPに戻る
目次
目次
1.レポートの概要
1.1 調査の目的
1.2 無菌注射剤CMO市場の紹介
1.3 本レポートが提供するもの
1.4 本レポートを読むべき理由
1.5 本分析レポートが回答する主な質問には以下が含まれます。
1.6 本レポートは誰のためのものなのか?
1.7 方法論
1.7.1 市場の定義
1.7.2 市場評価・予測手法
1.7.3 データの検証
1.7.3.1 一次調査
1.7.3.2 セカンダリーリサーチ
1.8 よくある質問(FAQ)
1.9 関連するVisiongainのレポート
1.10 Visiongainについて
2 エグゼクティブサマリー
3 市場の概要
3.1 主要な調査結果
3.2 マーケットダイナミクス
3.2.1 市場の推進要因
3.2.1.1 がん治療薬の開発に対する注目の高まり
3.2.1.2 慢性疾患の有病率の上昇
3.2.1.3 FDAによる無菌注射薬の迅速な承認が市場成長を促進する
3.2.1.4 製造業者の新規製造設備への投資により、無菌注射剤の需要は増加すると予想される
3.2.1.5 生物学的製剤の需要増が需要を牽引すると予想される
3.2.2 市場抑制要因
3.2.2.1 小規模メーカーとの競争激化
3.2.2.2 高いオペレーションコスト
3.2.2.3 発展途上国での不十分な医療インフラが市場成長の障害となる
3.2.3 市場機会
3.2.3.1 プレフィルドシリンジは有利な成長見通しを提供する
3.2.3.2 投資の拡大
3.2.3.3 アジア太平洋地域における臨床試験の機会拡大
3.2.4 市場の課題
3.2.4.1 パンデミック発生による臨床試験の中断
3.3 COVID-19影響度分析
3.4 ポーターのファイブフォース分析
3.4.1 供給者パワー
3.4.2 バイヤーパワー
3.4.3 競合他社の競争力
3.4.4 代替品による脅威
3.4.5 新規参入者の脅威
3.5 PEST分析
3.5.1 無菌注射剤CMOの市場に影響を与える政治的要因
3.5.2 無菌注射剤CMOの市場に影響を与える経済的要因
3.5.3 無菌注射剤CMOの市場に影響を与える社会的要因
3.5.4 無菌注射剤CMOの市場に影響を与える技術的要因
4 無菌注射剤CMO市場分析:分子タイプ別
4.1 主な調査結果
4.2 分子タイプセグメント市場魅力度指数
4.3 無菌注射剤CMOの分子タイプ別市場シェア、2022年&2032年
4.4 低分子化合物
4.5 高分子化合物
4.6 無菌注射剤CMOの分子タイプ別市場規模推定・予測
5 無菌注射剤CMO市場分析:タイプ別
5.1 主な調査結果
5.2 タイプ別セグメント市場魅力度指数
5.3 無菌注射剤CMOのタイプ別市場シェア、2022年&2032年
5.4 モノクローナル抗体(mAbs)
5.5 サイトカイン
5.6 インスリン
5.7 ペプチドホルモン
5.8 ワクチン
5.9 免疫グロブリン
5.10 血液凝固因子
5.11 ペプチド抗生物質
5.12 その他
5.13 無菌注射剤のCMOのタイプ別市場規模の推定と予測
6 無菌注射剤CMO市場分析:用途別
6.1 主な調査結果
6.2 用途別セグメント市場魅力度指数
6.3 無菌注射剤CMOの用途別市場シェア、2022年&2032年
6.4 癌
6.5 糖尿病
6.6 循環器系疾患
6.7 中枢神経系
6.8 感染症
6.9 その他
6.10 無菌注射剤CMOの用途別市場規模の推定と予測
7 無菌注射剤CMO市場分析:容器タイプ別
7.1 主な調査結果
7.2 容器タイプセグメント市場魅力度指数
7.3 無菌注射剤CMOの容器タイプ別市場シェア、2022年&2032年
7.4 ボトル
7.5 アンプル
7.6 バイアル
7.7 プレフィルドシリンジ
7.8 バッグ
7.9 無菌注射剤のCMO 容器タイプ別市場規模の推定と予測
8 無菌注射剤CMO市場分析:投与経路別
8.1 主要な調査結果
8.2 投与経路セグメント市場魅力度指数
8.3 無菌注射剤CMOの投与経路別市場シェア、2022年&2032年
8.4 皮下注射
8.5 静脈注射
8.6 筋肉内注射
8.7 その他
8.8 無菌注射剤CMOの投与経路別市場規模推定・予測
9 無菌注射剤CMO市場分析:サービス別
9.1 主な調査結果
9.2 サービスセグメント市場魅力度指数
9.3 無菌注射剤CMOのサービス別市場シェア、2022年&2032年
9.4 バイオアナリティクス試験
9.5 メソッド開発・バリデーション
9.6 安定性試験
9.7 その他
9.8 無菌注射剤CMOのサービス別市場規模の推定と予測
10 無菌注射剤CMO市場分析:地域別
10.1 主な調査結果
10.2 地域別市場規模の推定と予測
11 北米の無菌注射剤CMO市場分析
11.1 主な調査結果
11.2 北米の無菌注射剤CMO市場魅力度指数
11.3 北米の無菌注射剤CMOの国別市場:2022年、2027年&2032年(US$ mn)
11.4 北米の無菌注射剤CMOの国別市場規模予測・予想
11.5 北米の無菌注射剤CMOの分子タイプ別市場規模予測・予測
11.6 北米の無菌注射剤CMOの市場規模予測・タイプ別予測
11.7 北米の無菌注射剤CMOの市場規模予測・用途別予測
11.8 北米の無菌注射剤CMOの容器タイプ別市場規模予測・予想
11.9 北米の無菌注射剤CMOの市場規模予測・投与経路別予測
11.10 北米の無菌注射剤用CMOのサービス別市場規模予測・予測
11.11 米国
11.12 カナダ
12 欧州の無菌注射剤CMOの市場分析
12.1 主な調査結果
12.2 欧州の無菌注射剤CMO市場魅力度指数
12.3 欧州の無菌注射剤CMO国別市場 2022年、2027年&2032年 (US$ mn)
12.4 欧州の無菌注射剤CMOの国別市場規模推定・予測
12.5 欧州の無菌注射剤CMOの分子タイプ別市場規模予測・予測
12.6 欧州の無菌注射剤CMOの市場規模予測・タイプ別予測
12.7 欧州の無菌注射剤CMOの市場規模予測・用途別予測
12.8 欧州の無菌注射剤CMOの容器タイプ別市場規模予測・予想
12.9 欧州の無菌注射剤CMOの市場規模予測・投与経路別予測
12.10 欧州の無菌注射剤用CMOのサービス別市場規模予測・予測
12.11 ドイツ
12.12 イギリス
12.13 フランス
12.14 イタリア
12.15 スペイン
12.16 ロシア
12.17 その他の欧州
13 アジア太平洋地域の無菌注射剤CMO市場分析
13.1 主な調査結果
13.2 アジア太平洋地域の無菌注射剤CMO市場魅力度指数
13.3 アジア太平洋地域の無菌注射剤CMOの国別市場:2022年、2027年、2032年(US$ mn)
13.4 アジア太平洋地域の無菌注射剤CMOの国別市場規模予測・予想
13.5 アジア太平洋地域の無菌注射剤CMOの分子タイプ別市場規模予測・予測
13.6 アジア太平洋地域の無菌注射剤CMOの市場規模予測・タイプ別予測
13.7 アジア太平洋地域の無菌注射剤CMOの市場規模予測・用途別予測
13.8 アジア太平洋地域の無菌注射剤用CMOの容器タイプ別市場規模予測・予想
13.9 アジア太平洋地域の無菌注射剤CMOの市場規模予測・投与経路別予測
13.10 アジア太平洋地域の無菌注射剤用CMOのサービス別市場規模予測・予測
13.11 中国
13.12 日本
13.13 インド
13.14 オーストラリア
13.15 東南アジア
13.16 その他のアジア太平洋地域
14 ラテンアメリカの無菌注射剤CMO市場分析
14.1 主な調査結果
14.2 ラテンアメリカの無菌注射剤CMO市場魅力度指数
14.3 ラテンアメリカの無菌注射剤CMOの国別市場:2022年、2027年&2032年(US$ mn)
14.4 ラテンアメリカの無菌注射剤CMOの国別市場規模予測・予想
14.5 ラテンアメリカの無菌注射剤CMOの分子タイプ別市場規模予測・予測
14.6 ラテンアメリカの無菌注射剤CMOの市場規模予測・タイプ別予測
14.7 ラテンアメリカの無菌注射剤CMOの市場規模予測・用途別予測
14.8 ラテンアメリカの無菌注射剤用CMOの容器タイプ別市場規模予測・予想
14.9 ラテンアメリカの無菌注射剤CMOの市場規模予測・投与経路別予測
14.10 ラテンアメリカの無菌注射剤用CMOのサービス別市場規模予測・予測
14.11 ブラジル
14.12 メキシコ
14.13 ラテンアメリカのその他
15 中東・アフリカの無菌注射剤CMO市場分析
15.1 主な調査結果
15.2 中東・アフリカの無菌注射剤用CMO市場魅力度指数
15.3 中東・アフリカの無菌注射剤CMOの国別市場:2022年、2027年、2032年 (US$ mn)
15.4 中東・アフリカの無菌注射剤CMOの国別市場規模予測・予想
15.5 中東・アフリカの無菌注射剤CMOの分子タイプ別市場規模予測・予測
15.6 中東・アフリカの無菌注射剤CMOの市場規模予測・タイプ別予測
15.7 中東・アフリカの無菌注射剤CMOの市場規模予測・用途別予測
15.8 中東・アフリカの無菌注射剤用CMOの市場規模予測・容器タイプ別予測
15.9 中東・アフリカの無菌注射剤CMOの市場規模予測・投与ルート別予測
15.10 中東・アフリカの無菌注射剤CMOのサービス別市場規模予測・予想
15.11 GCC
15.12 南アフリカ
15.13 その他の中東・アフリカ地域
16 競合他社の状況
16.1 企業シェア分析
16.2 主要事業戦略分析
17 主要企業のプロフィール
17.1 Aenova Group
17.1.1 会社概要
17.1.2 会社概要
17.1.3 製品ベンチマーク
17.1.4 戦略的展望
17.2 Almac Group
17.2.1 企業スナップショット
17.2.2 会社概要
17.2.3 ベンチマーキング
17.2.4 戦略的展望
17.3 Baxter International Inc.
17.3.1 企業スナップショット
17.3.2 会社概要
17.3.3 財務分析
17.3.3.1 純収益、2017-2021年
17.3.3.2 地域別売上高/市場シェア、2020年
17.3.4 製品ベンチマーク
17.3.5 戦略的な展望
17.4 Boehringer Ingelheim International GmbH
17.4.1 企業スナップショット
17.4.2 会社概要
17.4.3 財務分析
17.4.3.1 純収益、2017-2021年
17.4.3.2 地域別収益/市場シェア、2021年
17.4.3.3 セグメント別収益/マーケットシェア、2021年
17.4.4 製品ベンチマーク
17.5 Catalent, Inc.
17.5.1 企業スナップショット
17.5.2 会社概要
17.5.3 財務分析
17.5.3.1 純収益、2017年~2021年
17.5.3.2 地域別収益/市場シェア、2021年
17.5.3.3 セグメント別収益/マーケットシェア、2021年
17.5.4 製品ベンチマーク
17.5.5 戦略的な展望
17.6 CordenPharma
17.6.1 企業スナップショット
17.6.2 会社概要
17.6.3 製品ベンチマーク
17.6.4 戦略的展望
17.7 Evonik Industries AG
17.7.1 企業スナップショット
17.7.2 会社概要
17.7.3 財務分析
17.7.3.1 純収益、2017-2021年
17.7.3.2 地域別収益/マーケットシェア、2021年
17.7.3.3 セグメント別収益/マーケットシェア、2021年
17.7.4 製品ベンチマーク
17.7.5 戦略的な展望
17.8 FAMAR Health Care Services
17.8.1 企業スナップショット
17.8.2 会社概要
17.8.3 ベンチマーキング
17.8.4 戦略的展望
17.9 Fresenius Kabi Ag
17.9.1 企業スナップショット
17.9.2 会社概要
17.9.3 財務分析
17.9.3.1 純収益、2017-2021年
17.9.3.2 地域別収益/マーケットシェア、2021年
17.9.3.3 セグメント別収益/マーケットシェア、2021年
17.9.4 製品ベンチマーク
17.9.5 戦略的な展望
17.10 Grifols SA
17.10.1 企業スナップショット
17.10.2 会社概要
17.10.3 財務分析
17.10.3.1 純収益、2017-2021年
17.10.3.2 地域別収益/市場シェア、2021年
17.10.3.3 セグメント別収益/マーケットシェア、2021年
17.10.4 製品ベンチマーク
17.10.5 戦略的展望
17.11 Hikma Pharmaceuticals PLC
17.11.1 企業スナップショット
17.11.2 会社概要
17.11.3 財務分析
17.11.3.1 純収益、2017-2021年
17.11.3.2 地域別収益/マーケットシェア、2021年
17.11.3.3 セグメント別収益/マーケットシェア,、2021年
17.11.4 製品ベンチマーク
17.11.5 戦略的な展望
17.12 Jubilant Pharmova Limited
17.12.1 企業スナップショット
17.12.2 会社概要
17.12.3 財務分析
17.12.3.1 純収益、2017-2021年
17.12.3.2 地域別収益/マーケットシェア、2021年
17.12.3.3 セグメント別収益/マーケットシェア、2021年
17.12.4 製品ベンチマーク
17.12.5 戦略的な展望
17.13 Lonza
17.13.1 企業スナップショット
17.13.2 会社概要
17.13.3 財務分析
17.13.3.1 純収益、2017-2021年
17.13.3.2 地域別収益/マーケットシェア、2021年
17.13.3.3 セグメント別収益/マーケットシェア、2021年
17.13.4 製品ベンチマーク
17.13.5 戦略的な展望
17.14 Patheon, Inc. (Thermo Fischer)
17.14.1 企業スナップショット
17.14.2 会社概要
17.14.3 財務分析
17.14.3.1 純収益、2017-2021年
17.14.3.2 地域別収益/市場シェア、2021年
17.14.3.3 セグメント別収益/マーケットシェア、2021年
17.14.4 製品ベンチマーク
17.14.5 戦略的な展望
17.15 Pfizer CentreOne
17.15.1 企業スナップショット
17.15.2 会社概要
17.15.3 財務分析
17.15.3.1 純収益、2017-2021年
17.15.3.2 地域別収益/市場シェア、2021年
17.15.3.3 セグメント別収益/マーケットシェア、2021年
17.15.4 製品ベンチマーク
17.15.5 戦略的な展望
17.16 Recipharm AB
17.16.1 企業スナップショット
17.16.2 会社概要
17.16.3 ベンチマーキング
17.16.4 戦略的展望
17.17 Siegfried Holding AG
17.17.1 企業スナップショット
17.17.2 会社概要
17.17.3 財務分析
17.17.3.1 純収益、2017-2021年
17.17.3.2 地域別収益/マーケットシェア、2021年
17.17.3.3 セグメント別収益/マーケットシェア(2021年
17.17.4 製品ベンチマーク
17.17.5 戦略的展望
17.18 Nexus Pharmaceuticals, Inc.
17.18.1 企業スナップショット
17.18.2 会社概要
17.18.3 ベンチマーキング
17.18.4 戦略的展望
17.19 Avara Pharmaceutical Services, Inc.
17.19.1 企業スナップショット
17.19.2 会社概要
17.19.3 ベンチマーキング
17.20 Eli Lilly and Company
17.20.1 企業スナップショット
17.20.2 会社概要
17.20.3 財務分析
17.20.3.1 純収益、2017-2021年
17.20.3.2 地域別収益/市場シェア、2021年
17.20.4 製品ベンチマーク
17.20.5 戦略的な展望
17.21 Adare Pharma Solutions
17.21.1 企業スナップショット
17.21.2 会社概要
17.21.3 製品ベンチマーク
17.21.4 戦略的展望
18 結論と提言
18.1 ヴィジョンゲインからの結論
18.2 市場関係者への提言
表の一覧
Table 1 CMO of Sterile Injectable Drugs Market Snapshot, 2022 & 2032 (US$ million, CAGR %)
Table 2 CMO of Sterile Injectable Drugs Market by Region, 2022-2032 (US$ mn, AGR (%), CAGR (%)): “V” Shaped Recovery Scenario
Table 3 CMO of Sterile Injectable Drugs Market by Region, 2022-2032 (US$ mn, AGR (%), CAGR (%)): “U” Shaped Recovery Scenario
Table 4 CMO of Sterile Injectable Drugs Market by Region, 2022-2032 (US$ mn, AGR (%), CAGR (%)): “W” Shaped Recovery Scenario
Table 5 CMO of Sterile Injectable Drugs Market by Region, 2022-2032 (US$ mn, AGR (%), CAGR (%)): “L” Shaped Recovery Scenario
Table 6 CMO of Sterile Injectable Drugs Market Forecast by Molecule Type, 2022-2032 (US$ million, AGR%, CAGR %)
Table 7 CMO of Sterile Injectable Drugs Market Forecast by Type, 2022-2032 (US$ million, AGR%, CAGR %)
Table 8 CMO of Sterile Injectable Drugs Market Forecast by Application, 2022-2032 (US$ million, AGR%, CAGR %)
Table 9 CMO of Sterile Injectable Drugs Market Forecast by Container Type, 2022-2032 (US$ million, AGR%, CAGR %)
Table 10 CMO of Sterile Injectable Drugs Market Forecast by Route of Administration, 2022-2032 (US$ million, AGR%, CAGR %)
Table 11 CMO of Sterile Injectable Drugs Market Forecast by Service, 2022-2032 (US$ million, AGR%, CAGR %)
Table 12 CMO of Sterile Injectable Drugs Market by Region, 2022-2032 (USD Mn, AGR (%), CAGR (%))
Table 13 North America CMO of Sterile Injectable Drugs Market Forecast by Country, 2022-2032 (US$ million, AGR%, CAGR %)
Table 14 North America CMO of Sterile Injectable Drugs Market Forecast by Molecule Type, 2022-2032 (US$ million, AGR%, CAGR %)
Table 15 North America CMO of Sterile Injectable Drugs Market Forecast by Type, 2022-2032 (US$ million, AGR%, CAGR%)
Table 16 North America CMO of Sterile Injectable Drugs Market Forecast by Application, 2022-2032 (US$ million, AGR%, CAGR%)
Table 17 North America CMO of Sterile Injectable Drugs Market Forecast by Container Type, 2022-2032 (US$ million, AGR%, CAGR%)
Table 18 North America CMO of Sterile Injectable Drugs Market Forecast by Route of Administration, 2022-2032 (US$ million, AGR%, CAGR %)
Table 19 North America CMO of Sterile Injectable Drugs Market Forecast by Service, 2022-2032 (US$ million, AGR%, CAGR %)
Table 20 U.S. CMO of Sterile Injectable Drugs Market Forecast, 2022-2032 (US$ million, AGR%, CAGR%)
Table 21 Canada CMO of Sterile Injectable Drugs Market Forecast, 2022-2032 (US$ million, AGR%, CAGR%)
Table 22 Europe CMO of Sterile Injectable Drugs Market Forecast by Country, 2022-2032 (US$ million, AGR%, CAGR %)
Table 23 Europe CMO of Sterile Injectable Drugs Market Forecast by Molecule Type, 2022-2032 (US$ million, AGR%, CAGR%)
Table 24 Europe CMO of Sterile Injectable Drugs Market Forecast by Type, 2022-2032 (US$ million, AGR%, CAGR %)
Table 25 Europe CMO of Sterile Injectable Drugs Market Forecast by Application, 2022-2032 (US$ million, AGR%, CAGR %)
Table 26 Europe CMO of Sterile Injectable Drugs Market Forecast by Container Type, 2022-2032 (US$ million, AGR%, CAGR %)
Table 27 Europe CMO of Sterile Injectable Drugs Market Forecast by Route of Administration, 2022-2032 (US$ million, AGR%, CAGR %)
Table 28 Europe CMO of Sterile Injectable Drugs Market Forecast by Service, 2022-2032 (US$ million, AGR%, CAGR %)
Table 29 Germany CMO of Sterile Injectable Drugs Market Forecast, 2022-2032 (US$ million, AGR%, CAGR %)
Table 30 U.K. CMO of Sterile Injectable Drugs Market Forecast, 2022-2032 (US$ million, AGR%, CAGR %)
Table 31 France CMO of Sterile Injectable Drugs Market Forecast, 2022-2032 (US$ million, AGR%, CAGR %)
Table 32 Italy CMO of Sterile Injectable Drugs Market Forecast, 2022-2032 (US$ million, AGR%, CAGR %)
Table 33 Spain CMO of Sterile Injectable Drugs Market Forecast, 2022-2032 (US$ million, AGR%, CAGR%)
Table 34 Russia CMO of Sterile Injectable Drugs Market Forecast, 2022-2032 (US$ million, AGR%, CAGR %)
Table 35 Rest of Europe CMO of Sterile Injectable Drugs Market Forecast, 2022-2032 (US$ million, AGR%, CAGR %)
Table 36 Asia Pacific CMO of Sterile Injectable Drugs Market Forecast by Country, 2022-2032 (US$ million, AGR%, CAGR %)
Table 37 Asia Pacific CMO of Sterile Injectable Drugs Market Forecast by Molecule Type, 2022-2032 (US$ million, AGR%, CAGR %)
Table 38 Asia Pacific CMO of Sterile Injectable Drugs Market Forecast by Type, 2022-2032 (US$ million, AGR%, CAGR %)
Table 39 Asia Pacific CMO of Sterile Injectable Drugs Market Forecast by Application, 2022-2032 (US$ million, AGR%, CAGR %)
Table 40 Asia Pacific CMO of Sterile Injectable Drugs Market Forecast by Container Type, 2022-2032 (US$ million, AGR%, CAGR %)
Table 41 Asia Pacific CMO of Sterile Injectable Drugs Market Forecast by Route of Administration, 2022-2032 (US$ million, AGR%, CAGR %)
Table 42 Asia Pacific CMO of Sterile Injectable Drugs Market Forecast by Service, 2022-2032 (US$ million, AGR%, CAGR%)
Table 43 China CMO of Sterile Injectable Drugs Market Forecast, 2022-2032 (US$ million, AGR%, CAGR %)
Table 44 Japan CMO of Sterile Injectable Drugs Market Forecast, 2022-2032 (US$ million, AGR%, CAGR%)
Table 45 India CMO of Sterile Injectable Drugs Market Forecast, 2022-2032 (US$ million, AGR%, CAGR%)
Table 46 Australia CMO of Sterile Injectable Drugs Market Forecast, 2022-2032 (US$ million, AGR%, CAGR%)
Table 47 South-East Asia CMO of Sterile Injectable Drugs Market Forecast, 2022-2032 (US$ million, AGR%, CAGR %)
Table 48 Rest of Asia Pacific CMO of Sterile Injectable Drugs Market Forecast, 2022-2032 (US$ million, AGR%, CAGR %)
Table 49 Latin America CMO of Sterile Injectable Drugs Market Forecast by Country, 2022-2032 (US$ million, AGR%, CAGR %)
Table 50 Latin America CMO of Sterile Injectable Drugs Market Forecast by Molecule Type, 2022-2032 (US$ million, AGR%, CAGR%)
Table 51 Latin America CMO of Sterile Injectable Drugs Market Forecast by Type, 2022-2032 (US$ million, AGR%, CAGR %)
Table 52 Latin America CMO of Sterile Injectable Drugs Market Forecast by Application, 2022-2032 (US$ million, AGR%, CAGR %)
Table 53 Latin America CMO of Sterile Injectable Drugs Market Forecast by Container Type, 2022-2032 (US$ million, AGR%, CAGR%)
Table 54 Latin America CMO of Sterile Injectable Drugs Market Forecast by Route of Administration, 2022-2032 (US$ million, AGR%, CAGR %)
Table 55 Latin America CMO of Sterile Injectable Drugs Market Forecast by Service, 2022-2032 (US$ million, AGR%, CAGR %)
Table 56 Brazil CMO of Sterile Injectable Drugs Market Forecast, 2022-2032 (US$ million, AGR%, CAGR %)
Table 57 Mexico CMO of Sterile Injectable Drugs Market Forecast, 2022-2032 (US$ million, AGR%, CAGR%)
Table 58 Rest of Latin America CMO of Sterile Injectable Drugs Market Forecast, 2022-2032 (US$ million, AGR%, CAGR%)
Table 59 Middle East & Africa CMO of Sterile Injectable Drugs Market Forecast by Country, 2022-2032 (US$ million, AGR%, CAGR %)
Table 60 Middle East & Africa CMO of Sterile Injectable Drugs Market Forecast by Molecule Type, 2022-2032 (US$ million, AGR%, CAGR%)
Table 61 Middle East & Africa CMO of Sterile Injectable Drugs Market Forecast by Type, 2022-2032 (US$ million, AGR%, CAGR %)
Table 62 Middle East & Africa CMO of Sterile Injectable Drugs Market Forecast by Application, 2022-2032 (US$ million, AGR%, CAGR %)
Table 63 Middle East & Africa CMO of Sterile Injectable Drugs Market Forecast by Container Type, 2022-2032 (US$ million, AGR%, CAGR%)
Table 64 Middle East & Africa CMO of Sterile Injectable Drugs Market Forecast by Route of Administration, 2022-2032 (US$ million, AGR%, CAGR %)
Table 65 Middle East & Africa CMO of Sterile Injectable Drugs Market Forecast by Service, 2022-2032 (US$ million, AGR%, CAGR %)
Table 66 GCC CMO of Sterile Injectable Drugs Market Forecast, 2022-2032 (US$ million, AGR%, CAGR%)
Table 67 South Africa CMO of Sterile Injectable Drugs Market Forecast, 2022-2032 (US$ million, AGR%, CAGR %)
Table 68 Rest of Middle East & Africa CMO of Sterile Injectable Drugs Market Forecast, 2022-2032 (US$ million, AGR%, CAGR%)
Table 69 Company Ranking, 2021
Patheon, Inc. (Thermo Fischer)
Table 70 Strategic Outlook 2018-2022
Table 71 Aenova Group: Key Details, (CEO, HQ, Revenue, Founded, No. of Employees, Company Type, Website, Business Segment)
Table 72 Aenova Group: Product Benchmarking
Table 73
Aenova Group: Strategic Outlook
Table 74 Almac Group: Key Details, (CEO, HQ, Revenue, Founded, No. of Employees, Company Type, Website, Business Segment)
Table 75 Almac Group: Product Benchmarking
Table 76
Almac Group: Strategic Outlook
Table 77 Baxter International Inc.: Key Details, (CEO, HQ, Revenue, Founded, No. of Employees, Company Type, Website, Business Segment)
Table 78 Baxter International Inc.: Product Benchmarking
Table 79
Baxter International Inc. : Strategic Outlook
Table 80 Boehringer Ingelheim International GmbH: Key Details, (CEO, HQ, Revenue, Founded, No. of Employees, Company Type, Website, Business Segment)
Table 81 Boehringer Ingelheim International GmbH: Product Benchmarking
Table 82 Catalent, Inc. : Key Details, (CEO, HQ, Revenue, Founded, No. of Employees, Company Type, Website, Business Segment)
Table 83 Catalent, Inc.: Product Benchmarking
Table 84
Catalent, Inc: Strategic Outlook
Table 85 CordenPharma: Key Details, (CEO, HQ, Revenue, Founded, No. of Employees, Company Type, Website, Business Segment)
Table 86 CordenPharma: Product Benchmarking
Table 87
CordenPharma: Strategic Outlook
Table 88 Evonik Industries AG: Key Details, (CEO, HQ, Revenue, Founded, No. of Employees, Company Type, Website, Business Segment)
Table 89 Evonik Industries AG: Product Benchmarking
Table 90
Evonik Industries AG: Strategic Outlook
Table 91 FAMAR Health Care Services: Key Details, (CEO, HQ, Revenue, Founded, No. of Employees, Company Type, Website, Business Segment)
Table 92 FAMAR Health Care Services: Product Benchmarking
Table 93
FAMAR Health Care Services: Strategic Outlook
Table 94 Fresenius Kabi Ag: Key Details, (CEO, HQ, Revenue, Founded, No. of Employees, Company Type, Website, Business Segment)
Table 95 Fresenius Kabi Ag: Product Benchmarking
Table 96
Fresenius Kabi Ag: Strategic Outlook
Table 97 Grifols SA: Key Details, (CEO, HQ, Revenue, Founded, No. of Employees, Company Type, Website, Business Segment)
Table 98 Grifols SA: Product Benchmarking
Table 99
Grifols SA: Strategic Outlook
Table 100 Hikma Pharmaceuticals PLC: Key Details, (CEO, HQ, Revenue, Founded, No. of Employees, Company Type, Website, Business Segment)
Table 101 Hikma Pharmaceuticals PLC: Product Benchmarking
Table 102
Hikma Pharmaceuticals PLC: Strategic Outlook
Table 103 Jubilant Pharmova Limited: Key Details, (CEO, HQ, Revenue, Founded, No. of Employees, Company Type, Website, Business Segment)
Table 104 Jubilant Pharmova Limited: Product Benchmarking
Table 105
Jubilant Pharmova Limited: Strategic Outlook
Table 106 Lonza: Key Details, (CEO, HQ, Revenue, Founded, No. of Employees, Company Type, Website, Business Segment)
Table 107 Lonza: Product Benchmarking
Table 108
Lonza: Strategic Outlook
Table 109 Patheon, Inc. (Thermo Fischer): Key Details, (CEO, HQ, Revenue, Founded, No. of Employees, Company Type, Website, Business Segment)
Table 110 Patheon, Inc. (Thermo Fischer): Product Benchmarking
Table 111
Patheon, Inc. (Thermo Fischer): Strategic Outlook
Table 112 Pfizer CentreOne: Key Details, (CEO, HQ, Revenue, Founded, No. of Employees, Company Type, Website, Business Segment)
Table 113 Pfizer CentreOne: Product Benchmarking
Table 114
Pfizer CentreOne: Strategic Outlook
Table 115 Recipharm AB: Key Details, (CEO, HQ, Revenue, Founded, No. of Employees, Company Type, Website, Business Segment)
Table 116 Recipharm AB : Product Benchmarking
Table 117
Recipharm AB: Strategic Outlook
Table 118 Siegfrid Holding AG: Key Details, (CEO, HQ, Revenue, Founded, No. of Employees, Company Type, Website, Business Segment)
Table 119 Siegfried Holding AG: Product Benchmarking
Table 120
Siegfried Holding AG: Strategic Outlook
Table 121 Nexus Pharmaceuticals, Inc. Key Details, (CEO, HQ, Revenue, Founded, No. of Employees, Company Type, Website, Business Segment)
Table 122 Nexcus Pharmaceuticals, Inc.: Product Benchmarking
Table 123
Nexus Pharmaceuticals, Inc.: Strategic Outlook
Table 124 Avara Pharmaceutical Services, Inc.: Key Details, (CEO, HQ, Revenue, Founded, No. of Employees, Company Type, Website, Business Segment)
Table 125 Avara Pharmaceutical Services, inc.: Product Benchmarking
Table 126 Patheon, Inc. (Thermo Fischer): Key Details, (CEO, HQ, Revenue, Founded, No. of Employees, Company Type, Website, Business Segment)
Table 127 Eli Lilly and Company: Product Benchmarking
Table 128 Eli Lilly and Company : Strategic Outlook
Table 129 Adare Pharma Solutions: Key Details, (CEO, HQ, Revenue, Founded, No. of Employees, Company Type, Website, Business Segment)
Table 130 Adare Pharma Solutions: Product Benchmarking
Table 131
Adare Pharma Solutions: Strategic Outlook
図の一覧
Figure 1 CMO of Sterile Injectable Drugs Market Segmentation
Figure 2 CMO of Sterile Injectable Drugs Market Forecast by Region: Market Attractiveness Index
Figure 3 CMO of Sterile Injectable Drugs Market by Molecule Type: Market Attractiveness Index
Figure 4 CMO of Sterile Injectable Drugs Market by Type: Market Attractiveness Index
Figure 5 CMO of Sterile Injectable Drugs Market by Application: Market Attractiveness Index
Figure 6 CMO of Sterile Injectable Drugs Market by Container Type: Market Attractiveness Index
Figure 7 CMO of Sterile Injectable Drugs Market by Route of Administration: Market Attractiveness Index
Figure 8 CMO of Sterile Injectable Drugs Market by Service: Market Attractiveness Index
Figure 9 CMO of Sterile Injectable Drugs Market: Market Dynamics
Figure 10 Pharmaceutical R&D Expenditure in Europe, U.S., Japan & China, 2019 and 2020
Figure 11 CMO of Sterile Injectable Drugs Market by Region, 2022-2032 (US$ mn, AGR (%), CAGR (%)): “V” Shaped Recovery
Figure 12 CMO of Sterile Injectable Drugs Market by Region, 2022-2032 (US$ mn, AGR (%), CAGR (%)): “U” Shaped Recovery
Figure 13 CMO of Sterile Injectable Drugs Market by Region, 2022-2032 (US$ mn, AGR (%), CAGR (%)): “W” Shaped Recovery
Figure 14 CMO of Sterile Injectable Drugs Market by Region, 2022-2032 (US$ mn, AGR (%), CAGR (%)): “L” Shaped Recovery
Figure 15 CMO of Sterile Injectable Drugs Market: Porter’s Five Forces Analysis
Figure 16 CMO of Sterile Injectable Drugs Market: PEST Analysis
Figure 17 CMO of Sterile Injectable Drugs Market Forecast by Molecule Type 2022, 2027, 2032 (Revenue, CAGR %)
Figure 18 CMO of Sterile Injectable Drugs Market Share Forecast by Molecule Type, 2022, 2032 (%)
Figure 19 CMO of Sterile Injectable Drugs Market Forecast by Molecule Type, 2022-2032 (US$ million, AGR %)
Figure 20 CMO of Sterile Injectable Drugs Market Share Forecast by Molecule Type, 2022, 2027, 2032 (%)
Figure 21 CMO of Sterile Injectable Drugs Market Forecast by Type 2022, 2027, 2032 (Revenue, CAGR %)
Figure 22 CMO of Sterile Injectable Drugs Market Share Forecast by Type, 2022, 2032 (%)
Figure 23 CMO of Sterile Injectable Drugs Market Forecast by Type, 2022-2032 (US$ million, AGR %)
Figure 24 CMO of Sterile Injectable Drugs Market Share Forecast by Type, 2022, 2027, 2032 (%)
Figure 25 CMO of Sterile Injectable Drugs Market Forecast by Application 2022, 2027, 2032 (Revenue, CAGR %)
Figure 26 CMO of Sterile Injectable Drugs Market Share Forecast by Application, 2022, 2032 (%)
Figure 27 CMO of Sterile Injectable Drugs Market Forecast by Application, 2022-2032 (US$ million, AGR %)
Figure 28 CMO of Sterile Injectable Drugs Market Share Forecast by Application, 2022, 2027, 2032 (%)
Figure 29 CMO of Sterile Injectable Drugs Market Forecast by Container Type 2022, 2027, 2032 (Revenue, CAGR %)
Figure 30 CMO of Sterile Injectable Drugs Market Share Forecast by Container Type, 2022, 2032 (%)
Figure 31 CMO of Sterile Injectable Drugs Market Forecast by Container Type, 2022-2032 (US$ million, AGR %)
Figure 32 CMO of Sterile Injectable Drugs Market Share Forecast by Container Type, 2022, 2027, 2032 (%)
Figure 33 CMO of Sterile Injectable Drugs Market Forecast by Route of Administration 2022, 2027, 2032 (Revenue, CAGR %)
Figure 34 CMO of Sterile Injectable Drugs Market Share Forecast by Route of Administration, 2022, 2032 (%)
Figure 35 CMO of Sterile Injectable Drugs Market Forecast by Route of Administration, 2022-2032 (US$ million, AGR %)
Figure 36 CMO of Sterile Injectable Drugs Market Share Forecast by Route of Administration, 2022, 2027, 2032 (%)
Figure 37 CMO of Sterile Injectable Drugs Market Forecast by Service 2022, 2027, 2032 (Revenue, CAGR %)
Figure 38 CMO of Sterile Injectable Drugs Market Share Forecast by Service, 2022, 2032 (%)
Figure 39 CMO of Sterile Injectable Drugs Market Forecast by Service, 2022-2032 (US$ million, AGR %)
Figure 40 CMO of Sterile Injectable Drugs Market Share Forecast by Service, 2022, 2027, 2032 (%)
Figure 41 CMO of Sterile Injectable Drugs Market Share Forecast by Region 2022, 2027, 2032(%)
Figure 42 CMO of Sterile Injectable Drugs Market by Region, 2022-2032 (US$ mn, AGR (%), CAGR (%))
Figure 43 North America CMO of Sterile Injectable Drugs Market Attractiveness Index
Figure 44 North America CMO of Sterile Injectable Drugs Market by Region, 2022, 2027 & 2032 (US$ million)
Figure 45 North America CMO of Sterile Injectable Drugs Market Forecast by Country, 2022-2032 (US$ million, AGR %)
Figure 46 North America CMO of Sterile Injectable Drugs Market Share Forecast by Country, 2022 & 2032 (%)
Figure 47 North America CMO of Sterile Injectable Drugs Market Forecast by Molecule Type, 2022-2032 (US$ million, AGR %)
Figure 48 North America CMO of Sterile Injectable Drugs Market Share Forecast by Molecule Type, 2022 & 2032 (%)
Figure 49 North America CMO of Sterile Injectable Drugs Market Forecast by Type, 2022-2032 (US$ million, AGR %)
Figure 50 North America CMO of Sterile Injectable Drugs Market Share Forecast by Type, 2022 & 2032 (%)
Figure 51 North America CMO of Sterile Injectable Drugs Market Forecast by Application, 2022-2032 (US$ million, AGR %)
Figure 52 North America CMO of Sterile Injectable Drugs Market Share Forecast by Application, 2022 & 2032 (%)
Figure 53 North America CMO of Sterile Injectable Drugs Market Forecast by Container Type, 2022-2032 (US$ million, AGR %)
Figure 54 North America CMO of Sterile Injectable Drugs Market Share Forecast by Container Type, 2022 & 2032 (%)
Figure 55 North America CMO of Sterile Injectable Drugs Market Forecast by Route of Administration, 2022-2032 (US$ million, AGR %)
Figure 56 North America CMO of Sterile Injectable Drugs Market Share Forecast by Route of Administration, 2022 & 2032 (%)
Figure 57 North America CMO of Sterile Injectable Drugs Market Forecast by Service, 2022-2032 (US$ million, AGR %)
Figure 58 North America CMO of Sterile Injectable Drugs Market Share Forecast by Service, 2022 & 2032 (%)
Figure 59 U.S. CMO of Sterile Injectable Drugs Market Forecast, 2022-2032 (US$ million, AGR %)
Figure 60 Canada CMO of Sterile Injectable Drugs Market Forecast, 2022-2032 (US$ million, AGR %)
Figure 61 Europe CMO of Sterile Injectable Drugs Market Attractiveness Index
Figure 62 Europe CMO of Sterile Injectable Drugs Market by Region, 2022, 2027 & 2032 (US$ million)
Figure 63 Europe CMO of Sterile Injectable Drugs Market Forecast by Country, 2022-2032 (US$ million, AGR %)
Figure 64 Europe CMO of Sterile Injectable Drugs Market Share Forecast by Country, 2022 & 2032 (%)
Figure 65 Europe CMO of Sterile Injectable Drugs Market Forecast by Molecule Type, 2022-2032 (US$ million, AGR %)
Figure 66 Europe CMO of Sterile Injectable Drugs Market Share Forecast by Molecule Type, 2022 & 2032 (%)
Figure 67 Europe CMO of Sterile Injectable Drugs Market Forecast by Type, 2022-2032 (US$ million, AGR %)
Figure 68 Europe CMO of Sterile Injectable Drugs Market Share Forecast by Type, 2022 & 2032 (%)
Figure 69 Europe CMO of Sterile Injectable Drugs Market Forecast by Application, 2022-2032 (US$ million, AGR %)
Figure 70 Europe CMO of Sterile Injectable Drugs Market Share Forecast by Application, 2022 & 2032 (%)
Figure 71 Europe CMO of Sterile Injectable Drugs Market Forecast by Container Type, 2022-2032 (US$ million, AGR %)
Figure 72 Europe CMO of Sterile Injectable Drugs Market Share Forecast by Container Type, 2022 & 2032 (%)
Figure 73 Europe CMO of Sterile Injectable Drugs Market Forecast by Route of Administration, 2022-2032 (US$ million, AGR %)
Figure 74 Europe CMO of Sterile Injectable Drugs Market Share Forecast by Route of Administration, 2022 & 2032 (%)
Figure 75 Europe CMO of Sterile Injectable Drugs Market Forecast by Service, 2022-2032 (US$ million, AGR %)
Figure 76 Europe CMO of Sterile Injectable Drugs Market Share Forecast by Service, 2022 & 2032 (%)
Figure 77 Germany CMO of Sterile Injectable Drugs Market Forecast, 2022-2032 (US$ million, AGR %)
Figure 78 U.K. CMO of Sterile Injectable Drugs Market Forecast, 2022-2032 (US$ million, AGR %)
Figure 79 France CMO of Sterile Injectable Drugs Market Forecast, 2022-2032 (US$ million, AGR %)
Figure 80 Italy CMO of Sterile Injectable Drugs Market Forecast, 2022-2032 (US$ million, AGR %)
Figure 81 Spain CMO of Sterile Injectable Drugs Market Forecast, 2022-2032 (US$ million, AGR %)
Figure 82 Russia CMO of Sterile Injectable Drugs Market Forecast, 2022-2032 (US$ million, AGR %)
Figure 83 Rest of Europe CMO of Sterile Injectable Drugs Market Forecast, 2022-2032 (US$ million, AGR %)
Figure 84 Asia Pacific CMO of Sterile Injectable Drugs Market Attractiveness Index
Figure 85 Asia Pacific CMO of Sterile Injectable Drugs Market by Region, 2022, 2027 & 2032 (US$ million)
Figure 86 Asia Pacific CMO of Sterile Injectable Drugs Market Forecast by Country, 2022-2032 (US$ million, AGR %)
Figure 87 Asia Pacific CMO of Sterile Injectable Drugs Market Share Forecast by Country, 2022 & 2032 (%)
Figure 88 Asia Pacific CMO of Sterile Injectable Drugs Market Forecast by Molecule Type, 2022-2032 (US$ million, AGR %)
Figure 89 Asia Pacific CMO of Sterile Injectable Drugs Market Share Forecast by Molecule Type, 2022 & 2032 (%)
Figure 90 Asia Pacific CMO of Sterile Injectable Drugs Market Forecast by Type, 2022-2032 (US$ million, AGR %)
Figure 91 Asia Pacific CMO of Sterile Injectable Drugs Market Share Forecast by Type, 2022 & 2032 (%)
Figure 92 Asia Pacific CMO of Sterile Injectable Drugs Market Forecast by Type, 2022-2032 (US$ million, AGR %)
Figure 93 Asia Pacific CMO of Sterile Injectable Drugs Market Share Forecast by Type, 2022 & 2032 (%)
Figure 94 Asia Pacific CMO of Sterile Injectable Drugs Market Forecast by Container Type, 2022-2032 (US$ million, AGR %)
Figure 95 Asia Pacific CMO of Sterile Injectable Drugs Market Share Forecast by Container Type, 2022 & 2032 (%)
Figure 96 Asia Pacific CMO of Sterile Injectable Drugs Market Forecast by Route of Administration, 2022-2032 (US$ million, AGR %)
Figure 97 Asia Pacific CMO of Sterile Injectable Drugs Market Share Forecast by Route of Administration, 2022 & 2032 (%)
Figure 98 Asia Pacific CMO of Sterile Injectable Drugs Market Forecast by Service, 2022-2032 (US$ million, AGR %)
Figure 99 Asia Pacific CMO of Sterile Injectable Drugs Market Share Forecast by Service, 2022 & 2032 (%)
Figure 100 China CMO of Sterile Injectable Drugs Market Forecast, 2022-2032 (US$ million, AGR %)
Figure 101 Japan CMO of Sterile Injectable Drugs Market Forecast, 2022-2032 (US$ million, AGR %)
Figure 102 India CMO of Sterile Injectable Drugs Market Forecast, 2022-2032 (US$ million, AGR %)
Figure 103 Australia CMO of Sterile Injectable Drugs Market Forecast, 2022-2032 (US$ million, AGR %)
Figure 104 South-East Asia CMO of Sterile Injectable Drugs Market Forecast, 2022-2032 (US$ million, AGR %)
Figure 105 Rest of Asia Pacific CMO of Sterile Injectable Drugs Market Forecast, 2022-2032 (US$ million, AGR %)
Figure 106 Latin America CMO of Sterile Injectable Drugs Market Attractiveness Index
Figure 107 Latin America CMO of Sterile Injectable Drugs Market by Region, 2022, 2027 & 2032 (US$ million)
Figure 108 Latin America CMO of Sterile Injectable Drugs Market Forecast by Country, 2022-2032 (US$ million, AGR %)
Figure 109 Latin America CMO of Sterile Injectable Drugs Market Share Forecast by Country, 2022 & 2032 (%)
Figure 110 Latin America CMO of Sterile Injectable Drugs Market Forecast by Molecule Type, 2022-2032 (US$ million, AGR %)
Figure 111 Latin America CMO of Sterile Injectable Drugs Market Share Forecast by Molecule Type, 2022 & 2032 (%)
Figure 112 Latin America CMO of Sterile Injectable Drugs Market Forecast by Type, 2022-2032 (US$ million, AGR %)
Figure 113 Latin America CMO of Sterile Injectable Drugs Market Share Forecast by Type, 2022 & 2032 (%)
Figure 114 Latin America CMO of Sterile Injectable Drugs Market Forecast by Application, 2022-2032 (US$ million, AGR %)
Figure 115 Latin America CMO of Sterile Injectable Drugs Market Share Forecast by Application, 2022 & 2032 (%)
Figure 116 Latin America CMO of Sterile Injectable Drugs Market Forecast by Container Type, 2022-2032 (US$ million, AGR %)
Figure 117 Latin America CMO of Sterile Injectable Drugs Market Share Forecast by Container Type, 2022 & 2032 (%)
Figure 118 Latin America CMO of Sterile Injectable Drugs Market Forecast by Route of Administration, 2022-2032 (US$ million, AGR %)
Figure 119 Latin America CMO of Sterile Injectable Drugs Market Share Forecast by Route of Administration, 2022 & 2032 (%)
Figure 120 Latin America CMO of Sterile Injectable Drugs Market Forecast by Service, 2022-2032 (US$ million, AGR %)
Figure 121 Latin America CMO of Sterile Injectable Drugs Market Share Forecast by Service, 2022 & 2032 (%)
Figure 122 Brazil CMO of Sterile Injectable Drugs Market Forecast, 2022-2032 (US$ million, AGR %)
Figure 123 Mexico CMO of Sterile Injectable Drugs Market Forecast, 2022-2032 (US$ million, AGR %)
Figure 124 Rest of Latin America CMO of Sterile Injectable Drugs Market Forecast, 2022-2032 (US$ million, AGR %)
Figure 125 Middle East & Africa CMO of Sterile Injectable Drugs Market Attractiveness Index
Figure 126 Middle East & Africa CMO of Sterile Injectable Drugs Market by Region, 2022, 2027 & 2032 (US$ million)
Figure 127 Middle East & Africa CMO of Sterile Injectable Drugs Market Forecast by Country, 2022-2032 (US$ million, AGR %)
Figure 128 Middle East & Africa CMO of Sterile Injectable Drugs Market Share Forecast by Country, 2022 & 2032 (%)
Figure 129 Middle East & Africa CMO of Sterile Injectable Drugs Market Forecast by Molecule Type, 2022-2032 (US$ million, AGR %)
Figure 130 Middle East & Africa CMO of Sterile Injectable Drugs Market Share Forecast by Molecule Type, 2022 & 2032 (%)
Figure 131 Middle East & Africa CMO of Sterile Injectable Drugs Market Forecast by Type, 2022-2032 (US$ million, AGR %)
Figure 132 Middle East & Africa CMO of Sterile Injectable Drugs Market Share Forecast by Type, 2022 & 2032 (%)
Figure 133 Middle East & Africa CMO of Sterile Injectable Drugs Market Forecast by Application, 2022-2032 (US$ million, AGR %)
Figure 134 Middle East & Africa CMO of Sterile Injectable Drugs Market Share Forecast by Application, 2022 & 2032 (%)
Figure 135 Middle East & Africa CMO of Sterile Injectable Drugs Market Forecast by Container Type, 2022-2032 (US$ million, AGR %)
Figure 136 Middle East & Africa CMO of Sterile Injectable Drugs Market Share Forecast by Container Type, 2022 & 2032 (%)
Figure 137 Middle East & Africa CMO of Sterile Injectable Drugs Market Forecast by Route of Administration, 2022-2032 (US$ million, AGR %)
Figure 138 Middle East & Africa CMO of Sterile Injectable Drugs Market Share Forecast by Route of Administration, 2022 & 2032 (%)
Figure 139 Middle East & Africa CMO of Sterile Injectable Drugs Market Forecast by Service, 2022-2032 (US$ million, AGR %)
Figure 140 Middle East & Africa CMO of Sterile Injectable Drugs Market Share Forecast by Service, 2022 & 2032 (%)
Figure 141 GCC CMO of Sterile Injectable Drugs Market Forecast, 2022-2032 (US$ million, AGR %)
Figure 142 South Africa CMO of Sterile Injectable Drugs Market Forecast, 2022-2032 (US$ million, AGR %)
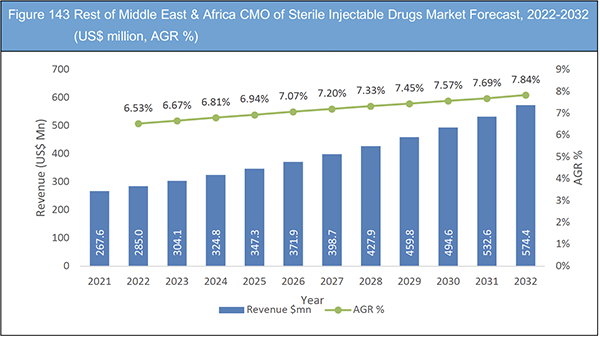
Figure 143 Rest of Middle East & Africa CMO of Sterile Injectable Drugs Market Forecast, 2022-2032 (US$ million, AGR %)
Figure 144 Baxter International Inc. : Net Revenue, 2017-2021 (US$ million, AGR %)
Figure 145 Baxter International Inc. : Regional Revenue Shares, 2021
Figure 146 Boehringer Ingelheim International GmbH: Net Revenue, 2017-2021 (US$ million, AGR %)
Figure 147 Boehringer Ingelheim International GmbH: Regional Revenue Shares, 2021
Figure 148 Boehringer Ingelheim International GmbH : Segmental Revenue Shares, 2021
Figure 149 Catalent, Inc.: Net Revenue, 2017-2021 (US$ million, AGR %)
Figure 150 Catalent, Inc.: Regional Revenue Shares, 2021
Figure 151 Catalent, Inc.: Segmental Revenue Shares, 2021
Figure 152 Evonik Industries AG: Net Revenue, 2017-2021 (US$ million, AGR %)
Figure 153 Evonik Industries AG : Regional Revenue Shares, 2021
Figure 154 Evonik Industries AG: Segmental Revenue Shares, 2021
Figure 155 Fresenius Kabi Ag: Net Revenue, 2017-2021 (US$ million, AGR %)
Figure 156 Fresenius Kabi Ag: Regional Revenue Shares, 2021
Figure 157 Fresenius Kabi Ag: Segmental Revenue Shares, 2021
Figure 158 Grifols SA: Net Revenue, 2017-2021 (US$ million, AGR %)
Figure 159 Grifols SA: Regional Revenue Shares, 2021
Figure 160 Grifols SA : Segmental Revenue Shares, 2021
Figure 161 Hikma Pharmaceuticals PLC: Net Revenue, 2017-2021 (US$ million, AGR %)
Figure 162 Hikma Pharmaceuticals PLC: Regional Revenue Shares, 2021
Figure 163 Hikma Pharmaceuticals PLC: Segmental Revenue Shares, 2021
Figure 164 Jubilant Pharmova Limited: Net Revenue, 2017-2021 (US$ million, AGR %)
Figure 165 Jubilant Pharmova Limited. : Regional Revenue Shares, 2021
Figure 166 Jubilant Pharmova Limited : Segmental Revenue Shares, 2021
Figure 167 Lonza: Net Revenue, 2017-2021 (US$ million, AGR %)
Figure 168 Lonza: Regional Revenue Shares, 2021
Figure 169 Lonza: Segmental Revenue Shares, 2021
Figure 170 Patheon, Inc. (Thermo Fischer): Net Revenue, 2017-2021 (US$ million, AGR %)
Figure 171 Patheon, Inc. (thermo Fischer): Regional Revenue Shares, 2021
Figure 172 Patheon, Inc. (Thermo Fischer): Segmental Revenue Shares, 2021
Figure 173 Pfizer CentreOne: Net Revenue, 2017-2021 (US$ million, AGR %)
Figure 174 Pfizer CentreOne : Regional Revenue Shares, 2021
Figure 175 Pfizer CentreOne : Segmental Revenue Shares, 2021
Figure 176 Siegfried Holding AG: Net Revenue, 2017-2021 (US$ million, AGR %)
Figure 177 Siegfried Holding AG: Regional Revenue Shares, 2021
Figure 178 Siegfried Holding AG: Segmental Revenue Shares, 2021
Figure 179 Eli Lilly and Company: Net Revenue, 2017-2021 (US$ million, AGR %)
Figure 180 Eli Lilly and Company: Regional Revenue Shares, 2021
ページTOPに戻る
Summary
Report Details
The Contract Manufacturing Outsourcing (CMO) of Sterile Injectable Drugs Market Report 2022-2032: This report will prove invaluable to leading firms striving for new revenue pockets if they wish to better understand the industry and its underlying dynamics. It will be useful for companies that would like to expand into different industries or to expand their existing operations in a new region.
Rising Demand for Outsourcing Drug Manufacturing by Pharmaceutical Companies to Boost Market Growth
Over the last few decades, contract manufacturing organisations (CMOs) have evolved as a viable alternative to pharmaceutical businesses’ in-house research and production departments. Contract manufacturing organisations (CMOs) are proven to be a successful business model as they become more integrated into pharmaceutical firms’ value chains. Despite the fact that the sector as a whole is expanding, many CMOs are encountering new obstacles. As a result of growing expenses, constantly improving technology, and a surge in mergers and acquisitions, competition in this sector has intensified. As a result of these considerations, organisations must decide what actions they might take to defend or improve their position.
Manufacturing costs are much lower in the Asia-Pacific area than in North America and Europe, and favourable laws are fuelling the rise of the CMO business. Despite the fact that API manufacturing services have mostly shifted to China and India, the United States remains the major site for pharmaceutical development outsourcing. Several reasons contribute to this predicament, including the abundance of funding and the concentration of pharmaceutical research hubs in universities. Pharmaceutical development in poor countries is also unfavourable owing to quality difficulties, logistical constraints, and legal challenges.
Market Growth is Hindered by Growing Competition from Small Manufacturers
The market’s discontinuance is considered in the perspective of the whole evaluation process for product lifespan and market viability. Drug discontinuation is defined as authorised products that are removed from the market or withdrawn for reasons other than safety or efficacy and are never again discontinued, marketed, exported, or used in the military. The possibility for a pharmaceutical corporation to pull a medicine from the market can have serious effects, including financial losses, loss of goodwill, and disrupted therapeutic research.
The consumer product literature contains well-developed dominating pricing methods, particularly skimming and penetration pricing. Pharmaceutical items use the same market-dynamic pricing mechanisms as other products. According to the current market study, the primary factor determining a product’s pricing is a larger therapeutic benefit. The greater the clinical benefit over previously accessible medications on the market, the higher the initial price of the product. If the sterile injectables medication product’s life cycle was not extended, this incident might result in significant losses for the corporation and, finally, product termination.
What Questions Should You Ask before Buying a Market Research Report?
• How is the CMO of Sterile Injectable Drugs market evolving?
• What is driving and restraining the CMO of Sterile Injectable Drugs market?
• How will each CMO of Sterile Injectable Drugs submarket segment grow over the forecast period and how much revenue will these submarkets account for in 2032?
• How will the market shares for each CMO of Sterile Injectable Drugs submarket develop from 2022 to 2032?
• What will be the main driver for the overall market from 2022 to 2032?
• Will leading CMO of Sterile Injectable Drugs markets broadly follow the macroeconomic dynamics, or will individual national markets outperform others?
• How will the market shares of the national markets change by 2032 and which geographical region will lead the market in 2032?
• Who are the leading players and what are their prospects over the forecast period?
• What are the CMO of Sterile Injectable Drugs projects for these leading companies?
• How will the industry evolve during the period between 2022 and 2032? What are the implications of CMO of Sterile Injectable Drugs projects taking place now and over the next 10 years?
• Is there a greater need for product commercialisation to further scale the CMO of Sterile Injectable Drugs market?
• Where is the CMO of Sterile Injectable Drugs market heading and how can you ensure you are at the forefront of the market?
• What are the best investment options for new product and service lines?
• What are the key prospects for moving companies into a new growth path and C-suite?
You need to discover how this will impact the CMO of Sterile Injectable Drugs market today, and over the next 10 years:
• Our 357-page report provides 116 tables and 175 charts/graphs exclusively to you.
• The report highlights key lucrative areas in the industry so you can target them – NOW.
• It contains in-depth analysis of global, regional and national sales and growth.
• It highlights for you the key successful trends, changes and revenue projections made by your competitors.
This report tells you TODAY how the CMO of Sterile Injectable Drugs market will develop in the next 10 years, and in line with the variations in COVID-19 economic recession and bounce. This market is more critical now than at any point over the last 10 years.
Forecasts to 2032 and other analyses reveal commercial prospects
• In addition to revenue forecasting to 2032, our new study provides you with recent results, growth rates, and market shares.
• You will find original analyses, with business outlooks and developments.
• Discover qualitative analyses (including market dynamics, drivers, opportunities, restraints and challenges), cost structure, impact of rising CMO of Sterile Injectable Drugs prices and recent developments.
This report includes data analysis and invaluable insight into how COVID-19 will affect the industry and your company. Four COVID-19 recovery patterns and their impact, namely, “V”, “L”, “W” and “U” are discussed in this report.
Segments Covered in the Report
Molecule Type
• Small Molecule
• Large Molecule
Type
• Monoclonal Antibodies (mAbs)
• Cytokines
• Insulin
• Peptide Hormones
• Vaccines
• Immunoglobulins
• Blood Factors
• Peptide Antibiotics
• Others
Application
• Cancer
• Diabetes
• Cardiovascular diseases
• CNS
• Infectious
• Others
Container Type
• Bottles
• Ampoules
• Vials
• Prefilled syringes
• Bags
Route of Administration
• Subcutaneous (SC)
• Intravenous (IV)
• Intramuscular (IM)
• Others
In addition to the revenue predictions for the overall world market and segments, you will also find revenue forecasts for five regional and 18 leading national markets:
North America
• U.S.
• Canada
Europe
• Germany
• UK
• France
• Spain
• Italy
• Russia
• Rest of Europe
Asia Pacific
• China
• Japan
• India
• Australia
• South Korea
• Rest of Asia Pacific
Latin America
• Brazil
• Mexico
• Rest of Latin America
MEA
• GCC
• South Africa
• Rest of MEA
The report also includes profiles and for some of the leading companies in the Contract Manufacturing Outsourcing (CMO) of Sterile Injectable Drugs Market, 2022 to 2032, with a focus on this segment of these companies’ operations.
Leading companies and the potential for market growth
• Adare Pharma Solutions
• Aenova Group
• Almac Group
• Avara Pharmaceutical Services, Inc.
• Baxter International Inc.
• Boehringer Ingelheim International GmbH
• Catalent, Inc.
• CordenPharma
• Eli Lilly and Company
• Evonik Industries AG
• F. Hoffmann-La Roche Ltd
• FAMAR Health Care Services
• Fresenius Kabi Ag
• Grifols SA
• Hikma Pharmaceuticals PLC
• Jubilant Pharmova Limited
• Lonza
• Nexus Pharmaceuticals, Inc.
• Patheon, Inc. (Thermo Fischer)
• Pfizer CentreOne
• Recipharm AB
• Siegfried Holding AG
Overall world revenue for Contract Manufacturing Outsourcing (CMO) of Sterile Injectable Drugs Market, 2022 to 2032 in terms of value the market will surpass US$22,300.0 million in 2023, our work calculates. We predict strong revenue growth through to 2032. Our work identifies which organizations hold the greatest potential. Discover their capabilities, progress, and commercial prospects, helping you stay ahead.
How will the Contract Manufacturing Outsourcing (CMO) of Sterile Injectable Drugs Market, 2022 to 2032 report help you?
In summary, our 370+ page report provides you with the following knowledge:
• Revenue forecasts to 2032 for Contract Manufacturing Outsourcing (CMO) of Sterile Injectable Drugs Market, 2022 to 2032 Market, with forecasts for molecule type, type, application, container type, and route of administration, each forecast at a global and regional level – discover the industry’s prospects, finding the most lucrative places for investments and revenues.
• Revenue forecasts to 2032 for five regional and 18 key national markets – See forecasts for the Contract Manufacturing Outsourcing (CMO) of Sterile Injectable Drugs Market, 2022 to 2032 market in North America, Europe, Asia-Pacific, LA, and MEA. Also forecasted is the market in the US, Canada, Mexico, Brazil, Germany, France, UK, Italy, China, India, Japan, and Australia among other prominent economies.
• Prospects for established firms and those seeking to enter the market – including company profiles for 22 of the major companies involved in the Contract Manufacturing Outsourcing (CMO) of Sterile Injectable Drugs Market, 2022 to 2032.
Find quantitative and qualitative analyses with independent predictions. Receive information that only our report contains, staying informed with invaluable business intelligence.
Information found nowhere else
With our new report, you are less likely to fall behind in knowledge or miss out on opportunities. See how our work could benefit your research, analyses, and decisions. Visiongain’s study is for everybody needing commercial analyses for the Contract Manufacturing Outsourcing (CMO) of Sterile Injectable Drugs Market, 2022 to 2032, market-leading companies. You will find data, trends and predictions.
ページTOPに戻る
Table of Contents
Table of Contents
1. Report Overview
1.1 Objectives of the Study
1.2 Introduction to CMO of Sterile Injectable Drugs Market
1.3 What This Report Delivers
1.4 Why You Should Read This Report
1.5 Key Questions Answered by This Analytical Report Include:
1.6 Who is This Report For?
1.7 Methodology
1.7.1 Market Definitions
1.7.2 Market Evaluation & Forecasting Methodology
1.7.3 Data Validation
1.7.3.1 Primary Research
1.7.3.2 Secondary Research
1.8 Frequently Asked Questions (FAQs)
1.9 Associated Visiongain Reports
1.10 About Visiongain
2 Executive Summary
3 Market Overview
3.1 Key Findings
3.2 Market Dynamics
3.2.1 Market Driving Factors
3.2.1.1 Growing Focus on Development to Treat Cancer
3.2.1.2 Rising Prevalence of Chronic Diseases
3.2.1.3 Rapid FDA Approvals of Sterile Injectable Drugs to Fuel Market Growth
3.2.1.4 As Manufacturers Invest in New Manufacturing Facilities, The Demand for Sterile Injectables is Expected to Rise
3.2.1.5 Increasing Demand for Biologicals is Expected to Drive the Demand
3.2.2 Market Restraining Factors
3.2.2.1 Growing Competition from Small Manufacturers
3.2.2.2 High Operational Costs
3.2.2.3 Inadequate Healthcare Infrastructure Across Developing Economies Challenging Market Growth
3.2.3 Market Opportunities
3.2.3.1 Prefilled Syringes to Offer Lucrative Growth Prospects
3.2.3.2 Growing Investments
3.2.3.3 Expanding Clinical Trial Opportunities in the Asia Pacific Region
3.2.4 Market Challenges
3.2.4.1 Disruption of Clinical Trials Due to Pandemic Breakout
3.3 COVID-19 Impact Analysis
3.4 Porter’s Five Forces Analysis
3.4.1 Supplier Power
3.4.2 Buyer Power
3.4.3 Competitive Rivalry
3.4.4 Threat from Substitutes
3.4.5 Threat of New Entrants
3.5 PEST Analysis
3.5.1 Political Factors Impacting CMO of Sterile Injectable Drugs Market
3.5.2 Economic Factors Impacting CMO of Sterile Injectable Drugs Market
3.5.3 Social Factors Impacting CMO of Sterile Injectable Drugs Market
3.5.4 Technological Factors Impacting CMO of Sterile Injectable Drugs Market
4 CMO of Sterile Injectable Drugs Market Analysis by Molecule Type
4.1 Key Findings
4.2 Molecule Type Segment: Market Attractiveness Index
4.3 CMO of Sterile Injectable Drugs Market Share by Molecule Type, 2022 & 2032
4.4 Small Molecule
4.5 Large Molecule
4.6 CMO of Sterile Injectable Drugs Market Size Estimation and Forecast by Molecule Type
5 CMO of Sterile Injectable Drugs Market Analysis by Type
5.1 Key Findings
5.2 Type Segment: Market Attractiveness Index
5.3 CMO of Sterile Injectable Drugs Market Share by Type, 2022 & 2032
5.4 Monoclonal Antibodies (mAbs)
5.5 Cytokines
5.6 Insulin
5.7 Peptide Hormones
5.8 Vaccines
5.9 Immunoglobulins
5.10 Blood Factor
5.11 Peptide Antibiotics
5.12 Others
5.13 CMO of Sterile Injectable Drugs Market Size Estimation and Forecast by Type
6 CMO of Sterile Injectable Drugs Market Analysis by Application
6.1 Key Findings
6.2 Application Segment: Market Attractiveness Index
6.3 CMO of Sterile Injectable Drugs Market Share by Application, 2022 & 2032
6.4 Cancer
6.5 Diabetes
6.6 Cardiovascular Diseases
6.7 CNS
6.8 Infectious
6.9 Others
6.10 CMO of Sterile Injectable Drugs Market Size Estimation and Forecast by Application
7 CMO of Sterile Injectable Drugs Market Analysis by Container Type
7.1 Key Findings
7.2 Container Type Segment: Market Attractiveness Index
7.3 CMO of Sterile Injectable Drugs Market Share by Container Type, 2022 & 2032
7.4 Bottles
7.5 Ampoules
7.6 Vials
7.7 Prefilled Syringes
7.8 Bags
7.9 CMO of Sterile Injectable Drugs Market Size Estimation and Forecast by Container Type
8 CMO of Sterile Injectable Drugs Market Analysis by Route of Administration
8.1 Key Findings
8.2 Route of Administration Segment: Market Attractiveness Index
8.3 CMO of Sterile Injectable Drugs Market Share by Route of Administration, 2022 & 2032
8.4 Subcutaneous
8.5 Intravenous
8.6 Intramuscular
8.7 Others
8.8 CMO of Sterile Injectable Drugs Market Size Estimation and Forecast by Route of Administration
9 CMO of Sterile Injectable Drugs Market Analysis by Service
9.1 Key Findings
9.2 Service Segment: Market Attractiveness Index
9.3 CMO of Sterile Injectable Drugs Market Share by Service, 2022 & 2032
9.4 Bioanalytical Testing
9.5 Method Development & Validation
9.6 Stability Testing
9.7 Others
9.8 CMO of Sterile Injectable Drugs Market Size Estimation and Forecast by Service
10 CMO of Sterile Injectable Drugs Market Analysis by Region
10.1 Key Findings
10.2 Regional Market Size Estimation and Forecast
11 North America CMO of Sterile Injectable Drugs Market Analysis
11.1 Key Findings
11.2 North America CMO of Sterile Injectable Drugs Market Attractiveness Index
11.3 North America CMO of Sterile Injectable Drugs Market by Country, 2022, 2027 & 2032 (US$ mn)
11.4 North America CMO of Sterile Injectable Drugs Market Size Estimation and Forecast by Country
11.5 North America CMO of Sterile Injectable Drugs Market Size Estimation and Forecast by Molecule Type
11.6 North America CMO of Sterile Injectable Drugs Market Size Estimation and Forecast by Type
11.7 North America CMO of Sterile Injectable Drugs Market Size Estimation and Forecast by Application
11.8 North America CMO of Sterile Injectable Drugs Market Size Estimation and Forecast by Container Type
11.9 North America CMO of Sterile Injectable Drugs Market Size Estimation and Forecast by Route of Administration
11.10 North America CMO of Sterile Injectable Drugs Market Size Estimation and Forecast by Service
11.11 U.S.
11.12 Canada
12 Europe CMO of Sterile Injectable Drugs Market Analysis
12.1 Key Findings
12.2 Europe CMO of Sterile Injectable Drugs Market Attractiveness Index
12.3 Europe CMO of Sterile Injectable Drugs Market by Country, 2022, 2027 & 2032 (US$ mn)
12.4 Europe CMO of Sterile Injectable Drugs Market Size Estimation and Forecast by Country
12.5 Europe CMO of Sterile Injectable Drugs Market Size Estimation and Forecast by Molecule Type
12.6 Europe CMO of Sterile Injectable Drugs Market Size Estimation and Forecast by Type
12.7 Europe CMO of Sterile Injectable Drugs Market Size Estimation and Forecast by Application
12.8 Europe CMO of Sterile Injectable Drugs Market Size Estimation and Forecast by Container Type
12.9 Europe CMO of Sterile Injectable Drugs Market Size Estimation and Forecast by Route of Administration
12.10 Europe CMO of Sterile Injectable Drugs Market Size Estimation and Forecast by Service
12.11 Germany
12.12 U.K.
12.13 France
12.14 Italy
12.15 Spain
12.16 Russia
12.17 Rest of Europe
13 Asia Pacific CMO of Sterile Injectable Drugs Market Analysis
13.1 Key Findings
13.2 Asia Pacific CMO of Sterile Injectable Drugs Market Attractiveness Index
13.3 Asia Pacific CMO of Sterile Injectable Drugs Market by Country, 2022, 2027 & 2032 (US$ mn)
13.4 Asia Pacific CMO of Sterile Injectable Drugs Market Size Estimation and Forecast by Country
13.5 Asia Pacific CMO of Sterile Injectable Drugs Market Size Estimation and Forecast by Molecule Type
13.6 Asia Pacific CMO of Sterile Injectable Drugs Market Size Estimation and Forecast by Type
13.7 Asia Pacific CMO of Sterile Injectable Drugs Market Size Estimation and Forecast by Application
13.8 Asia Pacific CMO of Sterile Injectable Drugs Market Size Estimation and Forecast by Container Type
13.9 Asia Pacific CMO of Sterile Injectable Drugs Market Size Estimation and Forecast by Route of Administration
13.10 Asia Pacific CMO of Sterile Injectable Drugs Market Size Estimation and Forecast by Service
13.11 China
13.12 Japan
13.13 India
13.14 Australia
13.15 South-East Asia
13.16 Rest of Asia Pacific
14 Latin America CMO of Sterile Injectable Drugs Market Analysis
14.1 Key Findings
14.2 Latin America CMO of Sterile Injectable Drugs Market Attractiveness Index
14.3 Latin America CMO of Sterile Injectable Drugs Market by Country, 2022, 2027 & 2032 (US$ mn)
14.4 Latin America CMO of Sterile Injectable Drugs Market Size Estimation and Forecast by Country
14.5 Latin America CMO of Sterile Injectable Drugs Market Size Estimation and Forecast by Molecule Type
14.6 Latin America CMO of Sterile Injectable Drugs Market Size Estimation and Forecast by Type
14.7 Latin America CMO of Sterile Injectable Drugs Market Size Estimation and Forecast by Application
14.8 Latin America CMO of Sterile Injectable Drugs Market Size Estimation and Forecast by Container Type
14.9 Latin America CMO of Sterile Injectable Drugs Market Size Estimation and Forecast by Route of Administration
14.10 Latin America CMO of Sterile Injectable Drugs Market Size Estimation and Forecast by Service
14.11 Brazil
14.12 Mexico
14.13 Rest of Latin America
15 Middle East & Africa CMO of Sterile Injectable Drugs Market Analysis
15.1 Key Findings
15.2 Middle East & Africa CMO of Sterile Injectable Drugs Market Attractiveness Index
15.3 Middle East & Africa CMO of Sterile Injectable Drugs Market by Country, 2022, 2027 & 2032 (US$ mn)
15.4 Middle East & Africa CMO of Sterile Injectable Drugs Market Size Estimation and Forecast by Country
15.5 Middle East & Africa CMO of Sterile Injectable Drugs Market Size Estimation and Forecast by Molecule Type
15.6 Middle East & Africa CMO of Sterile Injectable Drugs Market Size Estimation and Forecast by Type
15.7 Middle East & Africa CMO of Sterile Injectable Drugs Market Size Estimation and Forecast by Application
15.8 Middle East & Africa CMO of Sterile Injectable Drugs Market Size Estimation and Forecast by Container Type
15.9 Middle East & Africa CMO of Sterile Injectable Drugs Market Size Estimation and Forecast by Route of Administration
15.10 Middle East & Africa CMO of Sterile Injectable Drugs Market Size Estimation and Forecast by Service
15.11 GCC
15.12 South Africa
15.13 Rest of Middle East & Africa
16 Competitive Landscape
16.1 Company Share Analysis
16.2 Key Business Strategy Analysis
17 Company Profiles
17.1 Aenova Group
17.1.1 Company Snapshot
17.1.2 Company Overview
17.1.3 Product Benchmarking
17.1.4 Strategic Outlook
17.2 Almac Group
17.2.1 Company Snapshot
17.2.2 Company Overview
17.2.3 Product Benchmarking
17.2.4 Strategic Outlook
17.3 Baxter International Inc.
17.3.1 Company Snapshot
17.3.2 Company Overview
17.3.3 Financial Analysis
17.3.3.1 Net Revenue, 2017-2021
17.3.3.2 Regional Revenue/Market Shares, 2020
17.3.4 Product Benchmarking
17.3.5 Strategic Outlook
17.4 Boehringer Ingelheim International GmbH
17.4.1 Company Snapshot
17.4.2 Company Overview
17.4.3 Financial Analysis
17.4.3.1 Net Revenue, 2017-2021
17.4.3.2 Regional Revenue/Market Shares, 2021
17.4.3.3 Segmental Revenue/Market Shares, 2021
17.4.4 Product Benchmarking
17.5 Catalent, Inc.
17.5.1 Company Snapshot
17.5.2 Company Overview
17.5.3 Financial Analysis
17.5.3.1 Net Revenue, 2017-2021
17.5.3.2 Regional Revenue/Market Shares, 2021
17.5.3.3 Segmental Revenue/Market Shares, 2021
17.5.4 Product Benchmarking
17.5.5 Strategic Outlook
17.6 CordenPharma
17.6.1 Company Snapshot
17.6.2 Company Overview
17.6.3 Product Benchmarking
17.6.4 Strategic Outlook
17.7 Evonik Industries AG
17.7.1 Company Snapshot
17.7.2 Company Overview
17.7.3 Financial Analysis
17.7.3.1 Net Revenue, 2017-2021
17.7.3.2 Regional Revenue/Market Shares, 2021
17.7.3.3 Segmental Revenue/Market Shares, 2021
17.7.4 Product Benchmarking
17.7.5 Strategic Outlook
17.8 FAMAR Health Care Services
17.8.1 Company Snapshot
17.8.2 Company Overview
17.8.3 Product Benchmarking
17.8.4 Strategic Outlook
17.9 Fresenius Kabi Ag
17.9.1 Company Snapshot
17.9.2 Company Overview
17.9.3 Financial Analysis
17.9.3.1 Net Revenue, 2017-2021
17.9.3.2 Regional Revenue/Market Shares, 2021
17.9.3.3 Segmental Revenue/Market Shares, 2021
17.9.4 Product Benchmarking
17.9.5 Strategic Outlook
17.10 Grifols SA
17.10.1 Company Snapshot
17.10.2 Company Overview
17.10.3 Financial Analysis
17.10.3.1 Net Revenue, 2017-2021
17.10.3.2 Regional Revenue/Market Shares, 2021
17.10.3.3 Segmental Revenue/Market Shares, 2021
17.10.4 Product Benchmarking
17.10.5 Strategic Outlook
17.11 Hikma Pharmaceuticals PLC
17.11.1 Company Snapshot
17.11.2 Company Overview
17.11.3 Financial Analysis
17.11.3.1 Net Revenue, 2017-2021
17.11.3.2 Regional Revenue/Market Shares, 2021
17.11.3.3 Segmental Revenue/Market Shares, 2021
17.11.4 Product Benchmarking
17.11.5 Strategic Outlook
17.12 Jubilant Pharmova Limited
17.12.1 Company Snapshot
17.12.2 Company Overview
17.12.3 Financial Analysis
17.12.3.1 Net Revenue, 2017-2021
17.12.3.2 Regional Revenue/Market Shares, 2021
17.12.3.3 Segmental Revenue/Market Shares, 2021
17.12.4 Product Benchmarking
17.12.5 Strategic Outlook
17.13 Lonza
17.13.1 Company Snapshot
17.13.2 Company Overview
17.13.3 Financial Analysis
17.13.3.1 Net Revenue, 2017-2021
17.13.3.2 Regional Revenue/Market Shares, 2021
17.13.3.3 Segmental Revenue/Market Shares, 2021
17.13.4 Product Benchmarking
17.13.5 Strategic Outlook
17.14 Patheon, Inc. (Thermo Fischer)
17.14.1 Company Snapshot
17.14.2 Company Overview
17.14.3 Financial Analysis
17.14.3.1 Net Revenue, 2017-2021
17.14.3.2 Regional Revenue/Market Shares, 2021
17.14.3.3 Segmental Revenue/Market Shares, 2021
17.14.4 Product Benchmarking
17.14.5 Strategic Outlook
17.15 Pfizer CentreOne
17.15.1 Company Snapshot
17.15.2 Company Overview
17.15.3 Financial Analysis
17.15.3.1 Net Revenue, 2017-2021
17.15.3.2 Regional Revenue/Market Shares, 2021
17.15.3.3 Segmental Revenue/Market Shares, 2021
17.15.4 Product Benchmarking
17.15.5 Strategic Outlook
17.16 Recipharm AB
17.16.1 Company Snapshot
17.16.2 Company Overview
17.16.3 Product Benchmarking
17.16.4 Strategic Outlook
17.17 Siegfried Holding AG
17.17.1 Company Snapshot
17.17.2 Company Overview
17.17.3 Financial Analysis
17.17.3.1 Net Revenue, 2017-2021
17.17.3.2 Regional Revenue/Market Shares, 2021
17.17.3.3 Segmental Revenue/Market Shares, 2021
17.17.4 Product Benchmarking
17.17.5 Strategic Outlook
17.18 Nexus Pharmaceuticals, Inc.
17.18.1 Company Snapshot
17.18.2 Company Overview
17.18.3 Product Benchmarking
17.18.4 Strategic Outlook
17.19 Avara Pharmaceutical Services, Inc.
17.19.1 Company Snapshot
17.19.2 Company Overview
17.19.3 Product Benchmarking
17.20 Eli Lilly and Company
17.20.1 Company Snapshot
17.20.2 Company Overview
17.20.3 Financial Analysis
17.20.3.1 Net Revenue, 2017-2021
17.20.3.2 Regional Revenue/Market Shares, 2021
17.20.4 Product Benchmarking
17.20.5 Strategic Outlook
17.21 Adare Pharma Solutions
17.21.1 Company Snapshot
17.21.2 Company Overview
17.21.3 Product Benchmarking
17.21.4 Strategic Outlook
18 Conclusion and Recommendations
18.1 Concluding Remarks from Visiongain
18.2 Recommendations for Market Players
List of Tables
Table 1 CMO of Sterile Injectable Drugs Market Snapshot, 2022 & 2032 (US$ million, CAGR %)
Table 2 CMO of Sterile Injectable Drugs Market by Region, 2022-2032 (US$ mn, AGR (%), CAGR (%)): “V” Shaped Recovery Scenario
Table 3 CMO of Sterile Injectable Drugs Market by Region, 2022-2032 (US$ mn, AGR (%), CAGR (%)): “U” Shaped Recovery Scenario
Table 4 CMO of Sterile Injectable Drugs Market by Region, 2022-2032 (US$ mn, AGR (%), CAGR (%)): “W” Shaped Recovery Scenario
Table 5 CMO of Sterile Injectable Drugs Market by Region, 2022-2032 (US$ mn, AGR (%), CAGR (%)): “L” Shaped Recovery Scenario
Table 6 CMO of Sterile Injectable Drugs Market Forecast by Molecule Type, 2022-2032 (US$ million, AGR%, CAGR %)
Table 7 CMO of Sterile Injectable Drugs Market Forecast by Type, 2022-2032 (US$ million, AGR%, CAGR %)
Table 8 CMO of Sterile Injectable Drugs Market Forecast by Application, 2022-2032 (US$ million, AGR%, CAGR %)
Table 9 CMO of Sterile Injectable Drugs Market Forecast by Container Type, 2022-2032 (US$ million, AGR%, CAGR %)
Table 10 CMO of Sterile Injectable Drugs Market Forecast by Route of Administration, 2022-2032 (US$ million, AGR%, CAGR %)
Table 11 CMO of Sterile Injectable Drugs Market Forecast by Service, 2022-2032 (US$ million, AGR%, CAGR %)
Table 12 CMO of Sterile Injectable Drugs Market by Region, 2022-2032 (USD Mn, AGR (%), CAGR (%))
Table 13 North America CMO of Sterile Injectable Drugs Market Forecast by Country, 2022-2032 (US$ million, AGR%, CAGR %)
Table 14 North America CMO of Sterile Injectable Drugs Market Forecast by Molecule Type, 2022-2032 (US$ million, AGR%, CAGR %)
Table 15 North America CMO of Sterile Injectable Drugs Market Forecast by Type, 2022-2032 (US$ million, AGR%, CAGR%)
Table 16 North America CMO of Sterile Injectable Drugs Market Forecast by Application, 2022-2032 (US$ million, AGR%, CAGR%)
Table 17 North America CMO of Sterile Injectable Drugs Market Forecast by Container Type, 2022-2032 (US$ million, AGR%, CAGR%)
Table 18 North America CMO of Sterile Injectable Drugs Market Forecast by Route of Administration, 2022-2032 (US$ million, AGR%, CAGR %)
Table 19 North America CMO of Sterile Injectable Drugs Market Forecast by Service, 2022-2032 (US$ million, AGR%, CAGR %)
Table 20 U.S. CMO of Sterile Injectable Drugs Market Forecast, 2022-2032 (US$ million, AGR%, CAGR%)
Table 21 Canada CMO of Sterile Injectable Drugs Market Forecast, 2022-2032 (US$ million, AGR%, CAGR%)
Table 22 Europe CMO of Sterile Injectable Drugs Market Forecast by Country, 2022-2032 (US$ million, AGR%, CAGR %)
Table 23 Europe CMO of Sterile Injectable Drugs Market Forecast by Molecule Type, 2022-2032 (US$ million, AGR%, CAGR%)
Table 24 Europe CMO of Sterile Injectable Drugs Market Forecast by Type, 2022-2032 (US$ million, AGR%, CAGR %)
Table 25 Europe CMO of Sterile Injectable Drugs Market Forecast by Application, 2022-2032 (US$ million, AGR%, CAGR %)
Table 26 Europe CMO of Sterile Injectable Drugs Market Forecast by Container Type, 2022-2032 (US$ million, AGR%, CAGR %)
Table 27 Europe CMO of Sterile Injectable Drugs Market Forecast by Route of Administration, 2022-2032 (US$ million, AGR%, CAGR %)
Table 28 Europe CMO of Sterile Injectable Drugs Market Forecast by Service, 2022-2032 (US$ million, AGR%, CAGR %)
Table 29 Germany CMO of Sterile Injectable Drugs Market Forecast, 2022-2032 (US$ million, AGR%, CAGR %)
Table 30 U.K. CMO of Sterile Injectable Drugs Market Forecast, 2022-2032 (US$ million, AGR%, CAGR %)
Table 31 France CMO of Sterile Injectable Drugs Market Forecast, 2022-2032 (US$ million, AGR%, CAGR %)
Table 32 Italy CMO of Sterile Injectable Drugs Market Forecast, 2022-2032 (US$ million, AGR%, CAGR %)
Table 33 Spain CMO of Sterile Injectable Drugs Market Forecast, 2022-2032 (US$ million, AGR%, CAGR%)
Table 34 Russia CMO of Sterile Injectable Drugs Market Forecast, 2022-2032 (US$ million, AGR%, CAGR %)
Table 35 Rest of Europe CMO of Sterile Injectable Drugs Market Forecast, 2022-2032 (US$ million, AGR%, CAGR %)
Table 36 Asia Pacific CMO of Sterile Injectable Drugs Market Forecast by Country, 2022-2032 (US$ million, AGR%, CAGR %)
Table 37 Asia Pacific CMO of Sterile Injectable Drugs Market Forecast by Molecule Type, 2022-2032 (US$ million, AGR%, CAGR %)
Table 38 Asia Pacific CMO of Sterile Injectable Drugs Market Forecast by Type, 2022-2032 (US$ million, AGR%, CAGR %)
Table 39 Asia Pacific CMO of Sterile Injectable Drugs Market Forecast by Application, 2022-2032 (US$ million, AGR%, CAGR %)
Table 40 Asia Pacific CMO of Sterile Injectable Drugs Market Forecast by Container Type, 2022-2032 (US$ million, AGR%, CAGR %)
Table 41 Asia Pacific CMO of Sterile Injectable Drugs Market Forecast by Route of Administration, 2022-2032 (US$ million, AGR%, CAGR %)
Table 42 Asia Pacific CMO of Sterile Injectable Drugs Market Forecast by Service, 2022-2032 (US$ million, AGR%, CAGR%)
Table 43 China CMO of Sterile Injectable Drugs Market Forecast, 2022-2032 (US$ million, AGR%, CAGR %)
Table 44 Japan CMO of Sterile Injectable Drugs Market Forecast, 2022-2032 (US$ million, AGR%, CAGR%)
Table 45 India CMO of Sterile Injectable Drugs Market Forecast, 2022-2032 (US$ million, AGR%, CAGR%)
Table 46 Australia CMO of Sterile Injectable Drugs Market Forecast, 2022-2032 (US$ million, AGR%, CAGR%)
Table 47 South-East Asia CMO of Sterile Injectable Drugs Market Forecast, 2022-2032 (US$ million, AGR%, CAGR %)
Table 48 Rest of Asia Pacific CMO of Sterile Injectable Drugs Market Forecast, 2022-2032 (US$ million, AGR%, CAGR %)
Table 49 Latin America CMO of Sterile Injectable Drugs Market Forecast by Country, 2022-2032 (US$ million, AGR%, CAGR %)
Table 50 Latin America CMO of Sterile Injectable Drugs Market Forecast by Molecule Type, 2022-2032 (US$ million, AGR%, CAGR%)
Table 51 Latin America CMO of Sterile Injectable Drugs Market Forecast by Type, 2022-2032 (US$ million, AGR%, CAGR %)
Table 52 Latin America CMO of Sterile Injectable Drugs Market Forecast by Application, 2022-2032 (US$ million, AGR%, CAGR %)
Table 53 Latin America CMO of Sterile Injectable Drugs Market Forecast by Container Type, 2022-2032 (US$ million, AGR%, CAGR%)
Table 54 Latin America CMO of Sterile Injectable Drugs Market Forecast by Route of Administration, 2022-2032 (US$ million, AGR%, CAGR %)
Table 55 Latin America CMO of Sterile Injectable Drugs Market Forecast by Service, 2022-2032 (US$ million, AGR%, CAGR %)
Table 56 Brazil CMO of Sterile Injectable Drugs Market Forecast, 2022-2032 (US$ million, AGR%, CAGR %)
Table 57 Mexico CMO of Sterile Injectable Drugs Market Forecast, 2022-2032 (US$ million, AGR%, CAGR%)
Table 58 Rest of Latin America CMO of Sterile Injectable Drugs Market Forecast, 2022-2032 (US$ million, AGR%, CAGR%)
Table 59 Middle East & Africa CMO of Sterile Injectable Drugs Market Forecast by Country, 2022-2032 (US$ million, AGR%, CAGR %)
Table 60 Middle East & Africa CMO of Sterile Injectable Drugs Market Forecast by Molecule Type, 2022-2032 (US$ million, AGR%, CAGR%)
Table 61 Middle East & Africa CMO of Sterile Injectable Drugs Market Forecast by Type, 2022-2032 (US$ million, AGR%, CAGR %)
Table 62 Middle East & Africa CMO of Sterile Injectable Drugs Market Forecast by Application, 2022-2032 (US$ million, AGR%, CAGR %)
Table 63 Middle East & Africa CMO of Sterile Injectable Drugs Market Forecast by Container Type, 2022-2032 (US$ million, AGR%, CAGR%)
Table 64 Middle East & Africa CMO of Sterile Injectable Drugs Market Forecast by Route of Administration, 2022-2032 (US$ million, AGR%, CAGR %)
Table 65 Middle East & Africa CMO of Sterile Injectable Drugs Market Forecast by Service, 2022-2032 (US$ million, AGR%, CAGR %)
Table 66 GCC CMO of Sterile Injectable Drugs Market Forecast, 2022-2032 (US$ million, AGR%, CAGR%)
Table 67 South Africa CMO of Sterile Injectable Drugs Market Forecast, 2022-2032 (US$ million, AGR%, CAGR %)
Table 68 Rest of Middle East & Africa CMO of Sterile Injectable Drugs Market Forecast, 2022-2032 (US$ million, AGR%, CAGR%)
Table 69 Company Ranking, 2021
Patheon, Inc. (Thermo Fischer)
Table 70 Strategic Outlook 2018-2022
Table 71 Aenova Group: Key Details, (CEO, HQ, Revenue, Founded, No. of Employees, Company Type, Website, Business Segment)
Table 72 Aenova Group: Product Benchmarking
Table 73
Aenova Group: Strategic Outlook
Table 74 Almac Group: Key Details, (CEO, HQ, Revenue, Founded, No. of Employees, Company Type, Website, Business Segment)
Table 75 Almac Group: Product Benchmarking
Table 76
Almac Group: Strategic Outlook
Table 77 Baxter International Inc.: Key Details, (CEO, HQ, Revenue, Founded, No. of Employees, Company Type, Website, Business Segment)
Table 78 Baxter International Inc.: Product Benchmarking
Table 79
Baxter International Inc. : Strategic Outlook
Table 80 Boehringer Ingelheim International GmbH: Key Details, (CEO, HQ, Revenue, Founded, No. of Employees, Company Type, Website, Business Segment)
Table 81 Boehringer Ingelheim International GmbH: Product Benchmarking
Table 82 Catalent, Inc. : Key Details, (CEO, HQ, Revenue, Founded, No. of Employees, Company Type, Website, Business Segment)
Table 83 Catalent, Inc.: Product Benchmarking
Table 84
Catalent, Inc: Strategic Outlook
Table 85 CordenPharma: Key Details, (CEO, HQ, Revenue, Founded, No. of Employees, Company Type, Website, Business Segment)
Table 86 CordenPharma: Product Benchmarking
Table 87
CordenPharma: Strategic Outlook
Table 88 Evonik Industries AG: Key Details, (CEO, HQ, Revenue, Founded, No. of Employees, Company Type, Website, Business Segment)
Table 89 Evonik Industries AG: Product Benchmarking
Table 90
Evonik Industries AG: Strategic Outlook
Table 91 FAMAR Health Care Services: Key Details, (CEO, HQ, Revenue, Founded, No. of Employees, Company Type, Website, Business Segment)
Table 92 FAMAR Health Care Services: Product Benchmarking
Table 93
FAMAR Health Care Services: Strategic Outlook
Table 94 Fresenius Kabi Ag: Key Details, (CEO, HQ, Revenue, Founded, No. of Employees, Company Type, Website, Business Segment)
Table 95 Fresenius Kabi Ag: Product Benchmarking
Table 96
Fresenius Kabi Ag: Strategic Outlook
Table 97 Grifols SA: Key Details, (CEO, HQ, Revenue, Founded, No. of Employees, Company Type, Website, Business Segment)
Table 98 Grifols SA: Product Benchmarking
Table 99
Grifols SA: Strategic Outlook
Table 100 Hikma Pharmaceuticals PLC: Key Details, (CEO, HQ, Revenue, Founded, No. of Employees, Company Type, Website, Business Segment)
Table 101 Hikma Pharmaceuticals PLC: Product Benchmarking
Table 102
Hikma Pharmaceuticals PLC: Strategic Outlook
Table 103 Jubilant Pharmova Limited: Key Details, (CEO, HQ, Revenue, Founded, No. of Employees, Company Type, Website, Business Segment)
Table 104 Jubilant Pharmova Limited: Product Benchmarking
Table 105
Jubilant Pharmova Limited: Strategic Outlook
Table 106 Lonza: Key Details, (CEO, HQ, Revenue, Founded, No. of Employees, Company Type, Website, Business Segment)
Table 107 Lonza: Product Benchmarking
Table 108
Lonza: Strategic Outlook
Table 109 Patheon, Inc. (Thermo Fischer): Key Details, (CEO, HQ, Revenue, Founded, No. of Employees, Company Type, Website, Business Segment)
Table 110 Patheon, Inc. (Thermo Fischer): Product Benchmarking
Table 111
Patheon, Inc. (Thermo Fischer): Strategic Outlook
Table 112 Pfizer CentreOne: Key Details, (CEO, HQ, Revenue, Founded, No. of Employees, Company Type, Website, Business Segment)
Table 113 Pfizer CentreOne: Product Benchmarking
Table 114
Pfizer CentreOne: Strategic Outlook
Table 115 Recipharm AB: Key Details, (CEO, HQ, Revenue, Founded, No. of Employees, Company Type, Website, Business Segment)
Table 116 Recipharm AB : Product Benchmarking
Table 117
Recipharm AB: Strategic Outlook
Table 118 Siegfrid Holding AG: Key Details, (CEO, HQ, Revenue, Founded, No. of Employees, Company Type, Website, Business Segment)
Table 119 Siegfried Holding AG: Product Benchmarking
Table 120
Siegfried Holding AG: Strategic Outlook
Table 121 Nexus Pharmaceuticals, Inc. Key Details, (CEO, HQ, Revenue, Founded, No. of Employees, Company Type, Website, Business Segment)
Table 122 Nexcus Pharmaceuticals, Inc.: Product Benchmarking
Table 123
Nexus Pharmaceuticals, Inc.: Strategic Outlook
Table 124 Avara Pharmaceutical Services, Inc.: Key Details, (CEO, HQ, Revenue, Founded, No. of Employees, Company Type, Website, Business Segment)
Table 125 Avara Pharmaceutical Services, inc.: Product Benchmarking
Table 126 Patheon, Inc. (Thermo Fischer): Key Details, (CEO, HQ, Revenue, Founded, No. of Employees, Company Type, Website, Business Segment)
Table 127 Eli Lilly and Company: Product Benchmarking
Table 128 Eli Lilly and Company : Strategic Outlook
Table 129 Adare Pharma Solutions: Key Details, (CEO, HQ, Revenue, Founded, No. of Employees, Company Type, Website, Business Segment)
Table 130 Adare Pharma Solutions: Product Benchmarking
Table 131
Adare Pharma Solutions: Strategic Outlook
List of Figures
Figure 1 CMO of Sterile Injectable Drugs Market Segmentation
Figure 2 CMO of Sterile Injectable Drugs Market Forecast by Region: Market Attractiveness Index
Figure 3 CMO of Sterile Injectable Drugs Market by Molecule Type: Market Attractiveness Index
Figure 4 CMO of Sterile Injectable Drugs Market by Type: Market Attractiveness Index
Figure 5 CMO of Sterile Injectable Drugs Market by Application: Market Attractiveness Index
Figure 6 CMO of Sterile Injectable Drugs Market by Container Type: Market Attractiveness Index
Figure 7 CMO of Sterile Injectable Drugs Market by Route of Administration: Market Attractiveness Index
Figure 8 CMO of Sterile Injectable Drugs Market by Service: Market Attractiveness Index
Figure 9 CMO of Sterile Injectable Drugs Market: Market Dynamics
Figure 10 Pharmaceutical R&D Expenditure in Europe, U.S., Japan & China, 2019 and 2020
Figure 11 CMO of Sterile Injectable Drugs Market by Region, 2022-2032 (US$ mn, AGR (%), CAGR (%)): “V” Shaped Recovery
Figure 12 CMO of Sterile Injectable Drugs Market by Region, 2022-2032 (US$ mn, AGR (%), CAGR (%)): “U” Shaped Recovery
Figure 13 CMO of Sterile Injectable Drugs Market by Region, 2022-2032 (US$ mn, AGR (%), CAGR (%)): “W” Shaped Recovery
Figure 14 CMO of Sterile Injectable Drugs Market by Region, 2022-2032 (US$ mn, AGR (%), CAGR (%)): “L” Shaped Recovery
Figure 15 CMO of Sterile Injectable Drugs Market: Porter’s Five Forces Analysis
Figure 16 CMO of Sterile Injectable Drugs Market: PEST Analysis
Figure 17 CMO of Sterile Injectable Drugs Market Forecast by Molecule Type 2022, 2027, 2032 (Revenue, CAGR %)
Figure 18 CMO of Sterile Injectable Drugs Market Share Forecast by Molecule Type, 2022, 2032 (%)
Figure 19 CMO of Sterile Injectable Drugs Market Forecast by Molecule Type, 2022-2032 (US$ million, AGR %)
Figure 20 CMO of Sterile Injectable Drugs Market Share Forecast by Molecule Type, 2022, 2027, 2032 (%)
Figure 21 CMO of Sterile Injectable Drugs Market Forecast by Type 2022, 2027, 2032 (Revenue, CAGR %)
Figure 22 CMO of Sterile Injectable Drugs Market Share Forecast by Type, 2022, 2032 (%)
Figure 23 CMO of Sterile Injectable Drugs Market Forecast by Type, 2022-2032 (US$ million, AGR %)
Figure 24 CMO of Sterile Injectable Drugs Market Share Forecast by Type, 2022, 2027, 2032 (%)
Figure 25 CMO of Sterile Injectable Drugs Market Forecast by Application 2022, 2027, 2032 (Revenue, CAGR %)
Figure 26 CMO of Sterile Injectable Drugs Market Share Forecast by Application, 2022, 2032 (%)
Figure 27 CMO of Sterile Injectable Drugs Market Forecast by Application, 2022-2032 (US$ million, AGR %)
Figure 28 CMO of Sterile Injectable Drugs Market Share Forecast by Application, 2022, 2027, 2032 (%)
Figure 29 CMO of Sterile Injectable Drugs Market Forecast by Container Type 2022, 2027, 2032 (Revenue, CAGR %)
Figure 30 CMO of Sterile Injectable Drugs Market Share Forecast by Container Type, 2022, 2032 (%)
Figure 31 CMO of Sterile Injectable Drugs Market Forecast by Container Type, 2022-2032 (US$ million, AGR %)
Figure 32 CMO of Sterile Injectable Drugs Market Share Forecast by Container Type, 2022, 2027, 2032 (%)
Figure 33 CMO of Sterile Injectable Drugs Market Forecast by Route of Administration 2022, 2027, 2032 (Revenue, CAGR %)
Figure 34 CMO of Sterile Injectable Drugs Market Share Forecast by Route of Administration, 2022, 2032 (%)
Figure 35 CMO of Sterile Injectable Drugs Market Forecast by Route of Administration, 2022-2032 (US$ million, AGR %)
Figure 36 CMO of Sterile Injectable Drugs Market Share Forecast by Route of Administration, 2022, 2027, 2032 (%)
Figure 37 CMO of Sterile Injectable Drugs Market Forecast by Service 2022, 2027, 2032 (Revenue, CAGR %)
Figure 38 CMO of Sterile Injectable Drugs Market Share Forecast by Service, 2022, 2032 (%)
Figure 39 CMO of Sterile Injectable Drugs Market Forecast by Service, 2022-2032 (US$ million, AGR %)
Figure 40 CMO of Sterile Injectable Drugs Market Share Forecast by Service, 2022, 2027, 2032 (%)
Figure 41 CMO of Sterile Injectable Drugs Market Share Forecast by Region 2022, 2027, 2032(%)
Figure 42 CMO of Sterile Injectable Drugs Market by Region, 2022-2032 (US$ mn, AGR (%), CAGR (%))
Figure 43 North America CMO of Sterile Injectable Drugs Market Attractiveness Index
Figure 44 North America CMO of Sterile Injectable Drugs Market by Region, 2022, 2027 & 2032 (US$ million)
Figure 45 North America CMO of Sterile Injectable Drugs Market Forecast by Country, 2022-2032 (US$ million, AGR %)
Figure 46 North America CMO of Sterile Injectable Drugs Market Share Forecast by Country, 2022 & 2032 (%)
Figure 47 North America CMO of Sterile Injectable Drugs Market Forecast by Molecule Type, 2022-2032 (US$ million, AGR %)
Figure 48 North America CMO of Sterile Injectable Drugs Market Share Forecast by Molecule Type, 2022 & 2032 (%)
Figure 49 North America CMO of Sterile Injectable Drugs Market Forecast by Type, 2022-2032 (US$ million, AGR %)
Figure 50 North America CMO of Sterile Injectable Drugs Market Share Forecast by Type, 2022 & 2032 (%)
Figure 51 North America CMO of Sterile Injectable Drugs Market Forecast by Application, 2022-2032 (US$ million, AGR %)
Figure 52 North America CMO of Sterile Injectable Drugs Market Share Forecast by Application, 2022 & 2032 (%)
Figure 53 North America CMO of Sterile Injectable Drugs Market Forecast by Container Type, 2022-2032 (US$ million, AGR %)
Figure 54 North America CMO of Sterile Injectable Drugs Market Share Forecast by Container Type, 2022 & 2032 (%)
Figure 55 North America CMO of Sterile Injectable Drugs Market Forecast by Route of Administration, 2022-2032 (US$ million, AGR %)
Figure 56 North America CMO of Sterile Injectable Drugs Market Share Forecast by Route of Administration, 2022 & 2032 (%)
Figure 57 North America CMO of Sterile Injectable Drugs Market Forecast by Service, 2022-2032 (US$ million, AGR %)
Figure 58 North America CMO of Sterile Injectable Drugs Market Share Forecast by Service, 2022 & 2032 (%)
Figure 59 U.S. CMO of Sterile Injectable Drugs Market Forecast, 2022-2032 (US$ million, AGR %)
Figure 60 Canada CMO of Sterile Injectable Drugs Market Forecast, 2022-2032 (US$ million, AGR %)
Figure 61 Europe CMO of Sterile Injectable Drugs Market Attractiveness Index
Figure 62 Europe CMO of Sterile Injectable Drugs Market by Region, 2022, 2027 & 2032 (US$ million)
Figure 63 Europe CMO of Sterile Injectable Drugs Market Forecast by Country, 2022-2032 (US$ million, AGR %)
Figure 64 Europe CMO of Sterile Injectable Drugs Market Share Forecast by Country, 2022 & 2032 (%)
Figure 65 Europe CMO of Sterile Injectable Drugs Market Forecast by Molecule Type, 2022-2032 (US$ million, AGR %)
Figure 66 Europe CMO of Sterile Injectable Drugs Market Share Forecast by Molecule Type, 2022 & 2032 (%)
Figure 67 Europe CMO of Sterile Injectable Drugs Market Forecast by Type, 2022-2032 (US$ million, AGR %)
Figure 68 Europe CMO of Sterile Injectable Drugs Market Share Forecast by Type, 2022 & 2032 (%)
Figure 69 Europe CMO of Sterile Injectable Drugs Market Forecast by Application, 2022-2032 (US$ million, AGR %)
Figure 70 Europe CMO of Sterile Injectable Drugs Market Share Forecast by Application, 2022 & 2032 (%)
Figure 71 Europe CMO of Sterile Injectable Drugs Market Forecast by Container Type, 2022-2032 (US$ million, AGR %)
Figure 72 Europe CMO of Sterile Injectable Drugs Market Share Forecast by Container Type, 2022 & 2032 (%)
Figure 73 Europe CMO of Sterile Injectable Drugs Market Forecast by Route of Administration, 2022-2032 (US$ million, AGR %)
Figure 74 Europe CMO of Sterile Injectable Drugs Market Share Forecast by Route of Administration, 2022 & 2032 (%)
Figure 75 Europe CMO of Sterile Injectable Drugs Market Forecast by Service, 2022-2032 (US$ million, AGR %)
Figure 76 Europe CMO of Sterile Injectable Drugs Market Share Forecast by Service, 2022 & 2032 (%)
Figure 77 Germany CMO of Sterile Injectable Drugs Market Forecast, 2022-2032 (US$ million, AGR %)
Figure 78 U.K. CMO of Sterile Injectable Drugs Market Forecast, 2022-2032 (US$ million, AGR %)
Figure 79 France CMO of Sterile Injectable Drugs Market Forecast, 2022-2032 (US$ million, AGR %)
Figure 80 Italy CMO of Sterile Injectable Drugs Market Forecast, 2022-2032 (US$ million, AGR %)
Figure 81 Spain CMO of Sterile Injectable Drugs Market Forecast, 2022-2032 (US$ million, AGR %)
Figure 82 Russia CMO of Sterile Injectable Drugs Market Forecast, 2022-2032 (US$ million, AGR %)
Figure 83 Rest of Europe CMO of Sterile Injectable Drugs Market Forecast, 2022-2032 (US$ million, AGR %)
Figure 84 Asia Pacific CMO of Sterile Injectable Drugs Market Attractiveness Index
Figure 85 Asia Pacific CMO of Sterile Injectable Drugs Market by Region, 2022, 2027 & 2032 (US$ million)
Figure 86 Asia Pacific CMO of Sterile Injectable Drugs Market Forecast by Country, 2022-2032 (US$ million, AGR %)
Figure 87 Asia Pacific CMO of Sterile Injectable Drugs Market Share Forecast by Country, 2022 & 2032 (%)
Figure 88 Asia Pacific CMO of Sterile Injectable Drugs Market Forecast by Molecule Type, 2022-2032 (US$ million, AGR %)
Figure 89 Asia Pacific CMO of Sterile Injectable Drugs Market Share Forecast by Molecule Type, 2022 & 2032 (%)
Figure 90 Asia Pacific CMO of Sterile Injectable Drugs Market Forecast by Type, 2022-2032 (US$ million, AGR %)
Figure 91 Asia Pacific CMO of Sterile Injectable Drugs Market Share Forecast by Type, 2022 & 2032 (%)
Figure 92 Asia Pacific CMO of Sterile Injectable Drugs Market Forecast by Type, 2022-2032 (US$ million, AGR %)
Figure 93 Asia Pacific CMO of Sterile Injectable Drugs Market Share Forecast by Type, 2022 & 2032 (%)
Figure 94 Asia Pacific CMO of Sterile Injectable Drugs Market Forecast by Container Type, 2022-2032 (US$ million, AGR %)
Figure 95 Asia Pacific CMO of Sterile Injectable Drugs Market Share Forecast by Container Type, 2022 & 2032 (%)
Figure 96 Asia Pacific CMO of Sterile Injectable Drugs Market Forecast by Route of Administration, 2022-2032 (US$ million, AGR %)
Figure 97 Asia Pacific CMO of Sterile Injectable Drugs Market Share Forecast by Route of Administration, 2022 & 2032 (%)
Figure 98 Asia Pacific CMO of Sterile Injectable Drugs Market Forecast by Service, 2022-2032 (US$ million, AGR %)
Figure 99 Asia Pacific CMO of Sterile Injectable Drugs Market Share Forecast by Service, 2022 & 2032 (%)
Figure 100 China CMO of Sterile Injectable Drugs Market Forecast, 2022-2032 (US$ million, AGR %)
Figure 101 Japan CMO of Sterile Injectable Drugs Market Forecast, 2022-2032 (US$ million, AGR %)
Figure 102 India CMO of Sterile Injectable Drugs Market Forecast, 2022-2032 (US$ million, AGR %)
Figure 103 Australia CMO of Sterile Injectable Drugs Market Forecast, 2022-2032 (US$ million, AGR %)
Figure 104 South-East Asia CMO of Sterile Injectable Drugs Market Forecast, 2022-2032 (US$ million, AGR %)
Figure 105 Rest of Asia Pacific CMO of Sterile Injectable Drugs Market Forecast, 2022-2032 (US$ million, AGR %)
Figure 106 Latin America CMO of Sterile Injectable Drugs Market Attractiveness Index
Figure 107 Latin America CMO of Sterile Injectable Drugs Market by Region, 2022, 2027 & 2032 (US$ million)
Figure 108 Latin America CMO of Sterile Injectable Drugs Market Forecast by Country, 2022-2032 (US$ million, AGR %)
Figure 109 Latin America CMO of Sterile Injectable Drugs Market Share Forecast by Country, 2022 & 2032 (%)
Figure 110 Latin America CMO of Sterile Injectable Drugs Market Forecast by Molecule Type, 2022-2032 (US$ million, AGR %)
Figure 111 Latin America CMO of Sterile Injectable Drugs Market Share Forecast by Molecule Type, 2022 & 2032 (%)
Figure 112 Latin America CMO of Sterile Injectable Drugs Market Forecast by Type, 2022-2032 (US$ million, AGR %)
Figure 113 Latin America CMO of Sterile Injectable Drugs Market Share Forecast by Type, 2022 & 2032 (%)
Figure 114 Latin America CMO of Sterile Injectable Drugs Market Forecast by Application, 2022-2032 (US$ million, AGR %)
Figure 115 Latin America CMO of Sterile Injectable Drugs Market Share Forecast by Application, 2022 & 2032 (%)
Figure 116 Latin America CMO of Sterile Injectable Drugs Market Forecast by Container Type, 2022-2032 (US$ million, AGR %)
Figure 117 Latin America CMO of Sterile Injectable Drugs Market Share Forecast by Container Type, 2022 & 2032 (%)
Figure 118 Latin America CMO of Sterile Injectable Drugs Market Forecast by Route of Administration, 2022-2032 (US$ million, AGR %)
Figure 119 Latin America CMO of Sterile Injectable Drugs Market Share Forecast by Route of Administration, 2022 & 2032 (%)
Figure 120 Latin America CMO of Sterile Injectable Drugs Market Forecast by Service, 2022-2032 (US$ million, AGR %)
Figure 121 Latin America CMO of Sterile Injectable Drugs Market Share Forecast by Service, 2022 & 2032 (%)
Figure 122 Brazil CMO of Sterile Injectable Drugs Market Forecast, 2022-2032 (US$ million, AGR %)
Figure 123 Mexico CMO of Sterile Injectable Drugs Market Forecast, 2022-2032 (US$ million, AGR %)
Figure 124 Rest of Latin America CMO of Sterile Injectable Drugs Market Forecast, 2022-2032 (US$ million, AGR %)
Figure 125 Middle East & Africa CMO of Sterile Injectable Drugs Market Attractiveness Index
Figure 126 Middle East & Africa CMO of Sterile Injectable Drugs Market by Region, 2022, 2027 & 2032 (US$ million)
Figure 127 Middle East & Africa CMO of Sterile Injectable Drugs Market Forecast by Country, 2022-2032 (US$ million, AGR %)
Figure 128 Middle East & Africa CMO of Sterile Injectable Drugs Market Share Forecast by Country, 2022 & 2032 (%)
Figure 129 Middle East & Africa CMO of Sterile Injectable Drugs Market Forecast by Molecule Type, 2022-2032 (US$ million, AGR %)
Figure 130 Middle East & Africa CMO of Sterile Injectable Drugs Market Share Forecast by Molecule Type, 2022 & 2032 (%)
Figure 131 Middle East & Africa CMO of Sterile Injectable Drugs Market Forecast by Type, 2022-2032 (US$ million, AGR %)
Figure 132 Middle East & Africa CMO of Sterile Injectable Drugs Market Share Forecast by Type, 2022 & 2032 (%)
Figure 133 Middle East & Africa CMO of Sterile Injectable Drugs Market Forecast by Application, 2022-2032 (US$ million, AGR %)
Figure 134 Middle East & Africa CMO of Sterile Injectable Drugs Market Share Forecast by Application, 2022 & 2032 (%)
Figure 135 Middle East & Africa CMO of Sterile Injectable Drugs Market Forecast by Container Type, 2022-2032 (US$ million, AGR %)
Figure 136 Middle East & Africa CMO of Sterile Injectable Drugs Market Share Forecast by Container Type, 2022 & 2032 (%)
Figure 137 Middle East & Africa CMO of Sterile Injectable Drugs Market Forecast by Route of Administration, 2022-2032 (US$ million, AGR %)
Figure 138 Middle East & Africa CMO of Sterile Injectable Drugs Market Share Forecast by Route of Administration, 2022 & 2032 (%)
Figure 139 Middle East & Africa CMO of Sterile Injectable Drugs Market Forecast by Service, 2022-2032 (US$ million, AGR %)
Figure 140 Middle East & Africa CMO of Sterile Injectable Drugs Market Share Forecast by Service, 2022 & 2032 (%)
Figure 141 GCC CMO of Sterile Injectable Drugs Market Forecast, 2022-2032 (US$ million, AGR %)
Figure 142 South Africa CMO of Sterile Injectable Drugs Market Forecast, 2022-2032 (US$ million, AGR %)
Figure 143 Rest of Middle East & Africa CMO of Sterile Injectable Drugs Market Forecast, 2022-2032 (US$ million, AGR %)
Figure 144 Baxter International Inc. : Net Revenue, 2017-2021 (US$ million, AGR %)
Figure 145 Baxter International Inc. : Regional Revenue Shares, 2021
Figure 146 Boehringer Ingelheim International GmbH: Net Revenue, 2017-2021 (US$ million, AGR %)
Figure 147 Boehringer Ingelheim International GmbH: Regional Revenue Shares, 2021
Figure 148 Boehringer Ingelheim International GmbH : Segmental Revenue Shares, 2021
Figure 149 Catalent, Inc.: Net Revenue, 2017-2021 (US$ million, AGR %)
Figure 150 Catalent, Inc.: Regional Revenue Shares, 2021
Figure 151 Catalent, Inc.: Segmental Revenue Shares, 2021
Figure 152 Evonik Industries AG: Net Revenue, 2017-2021 (US$ million, AGR %)
Figure 153 Evonik Industries AG : Regional Revenue Shares, 2021
Figure 154 Evonik Industries AG: Segmental Revenue Shares, 2021
Figure 155 Fresenius Kabi Ag: Net Revenue, 2017-2021 (US$ million, AGR %)
Figure 156 Fresenius Kabi Ag: Regional Revenue Shares, 2021
Figure 157 Fresenius Kabi Ag: Segmental Revenue Shares, 2021
Figure 158 Grifols SA: Net Revenue, 2017-2021 (US$ million, AGR %)
Figure 159 Grifols SA: Regional Revenue Shares, 2021
Figure 160 Grifols SA : Segmental Revenue Shares, 2021
Figure 161 Hikma Pharmaceuticals PLC: Net Revenue, 2017-2021 (US$ million, AGR %)
Figure 162 Hikma Pharmaceuticals PLC: Regional Revenue Shares, 2021
Figure 163 Hikma Pharmaceuticals PLC: Segmental Revenue Shares, 2021
Figure 164 Jubilant Pharmova Limited: Net Revenue, 2017-2021 (US$ million, AGR %)
Figure 165 Jubilant Pharmova Limited. : Regional Revenue Shares, 2021
Figure 166 Jubilant Pharmova Limited : Segmental Revenue Shares, 2021
Figure 167 Lonza: Net Revenue, 2017-2021 (US$ million, AGR %)
Figure 168 Lonza: Regional Revenue Shares, 2021
Figure 169 Lonza: Segmental Revenue Shares, 2021
Figure 170 Patheon, Inc. (Thermo Fischer): Net Revenue, 2017-2021 (US$ million, AGR %)
Figure 171 Patheon, Inc. (thermo Fischer): Regional Revenue Shares, 2021
Figure 172 Patheon, Inc. (Thermo Fischer): Segmental Revenue Shares, 2021
Figure 173 Pfizer CentreOne: Net Revenue, 2017-2021 (US$ million, AGR %)
Figure 174 Pfizer CentreOne : Regional Revenue Shares, 2021
Figure 175 Pfizer CentreOne : Segmental Revenue Shares, 2021
Figure 176 Siegfried Holding AG: Net Revenue, 2017-2021 (US$ million, AGR %)
Figure 177 Siegfried Holding AG: Regional Revenue Shares, 2021
Figure 178 Siegfried Holding AG: Segmental Revenue Shares, 2021
Figure 179 Eli Lilly and Company: Net Revenue, 2017-2021 (US$ million, AGR %)
Figure 180 Eli Lilly and Company: Regional Revenue Shares, 2021
ページTOPに戻る
- 本レポートと同じKEY WORDの最新刊レポートはありません。
よくあるご質問
Visiongain社はどのような調査会社ですか?
英国の調査会社ヴィジョンゲイン社(Visiongain)は、通信とエネルギーのほか、自動車や化学・医薬品、金属など、広範な市場を対象に調査を行っています。自動車市場については、市場全般に関する調査のほ... もっと見る
調査レポートの納品までの日数はどの程度ですか?
在庫のあるものは速納となりますが、平均的には 3-4日と見て下さい。
但し、一部の調査レポートでは、発注を受けた段階で内容更新をして納品をする場合もあります。
発注をする前のお問合せをお願いします。
注文の手続きはどのようになっていますか?
1)お客様からの御問い合わせをいただきます。
2)見積書やサンプルの提示をいたします。
3)お客様指定、もしくは弊社の発注書をメール添付にて発送してください。
4)データリソース社からレポート発行元の調査会社へ納品手配します。
5) 調査会社からお客様へ納品されます。最近は、pdfにてのメール納品が大半です。
お支払方法の方法はどのようになっていますか?
納品と同時にデータリソース社よりお客様へ請求書(必要に応じて納品書も)を発送いたします。
お客様よりデータリソース社へ(通常は円払い)の御振り込みをお願いします。
請求書は、納品日の日付で発行しますので、翌月最終営業日までの当社指定口座への振込みをお願いします。振込み手数料は御社負担にてお願いします。
お客様の御支払い条件が60日以上の場合は御相談ください。
尚、初めてのお取引先や個人の場合、前払いをお願いすることもあります。ご了承のほど、お願いします。
データリソース社はどのような会社ですか?
当社は、世界各国の主要調査会社・レポート出版社と提携し、世界各国の市場調査レポートや技術動向レポートなどを日本国内の企業・公官庁及び教育研究機関に提供しております。
世界各国の「市場・技術・法規制などの」実情を調査・収集される時には、データリソース社にご相談ください。
お客様の御要望にあったデータや情報を抽出する為のレポート紹介や調査のアドバイスも致します。
|
|


