仮想発電所(VPP)市場レポート:2023-2033
Virtual Power Plant (VPP) Market Report 2023-2033
レポート詳細
仮想発電所(VPP)市場レポート 2023-2033 :本レポートは、新たな収益の柱を目指すリーディングカンパニーが、業界とその背景にあるダイナミクスをより深く理解する上で、非常に有益な... もっと見る
※上記価格は部署ライセンス(Departmental licence)価格です。
その他の価格についてはデータリソースまでお問合せください。
日本語のページは自動翻訳を利用し作成しています。
実際のレポートは英文のみでご納品いたします。
サマリー
レポート詳細
仮想発電所(VPP)市場レポート 2023-2033:本レポートは、新たな収益の柱を目指すリーディングカンパニーが、業界とその背景にあるダイナミクスをより深く理解する上で、非常に有益なものとなるでしょう。また、異業種への進出や新地域での既存事業の拡大を目指す企業にとっても有用なレポートです。
電力流通分野で重要性を増すバーチャルパワープラント
電力の需要と供給は一致させる必要があり、両者のバランスが崩れると周波数が乱れ、電力品質に影響を与え、停電などのトラブルが発生する。これまで電力会社は、火力発電や水力発電を緻密な計算に基づいて制御することで、供給量を調整していた。しかし、制御が難しい太陽光発電や風力発電などの再生可能エネルギーが主力電源となるにつれ、これらの電源の調整能力を確保することが課題となっています。このような背景から、仮想発電所(VPP)が注目されている。VPPは、太陽光発電設備や蓄電池、消費者が所有する電気自動車などの分散型電源資源を束ね、遠隔制御するものである。また、VPPは災害時の耐性をさらに高めることが期待されている。
VPPは、太陽光発電や風力発電などの再生可能エネルギーだけでなく、ビルや工場などの需要家の自家発電設備や燃料電池などの分散型エネルギー資源をネットワークで接続し、IoTで集約・制御・遠隔統合管理します。エネルギー需給最適化技術により、ネットワーク全体の電力を安定化させ、余剰分を抑制することで、非常時には他の需要家やネットワークに電力を供給する発電所として機能させることができます。
マーケットリサーチレポートを購入する前に、どのような質問をすべきでしょうか?
-仮想発電所(VPP)市場はどのように進化しているのか?
- 仮想発電所(VPP)市場の推進要因と抑制要因は何か?
- 仮想発電所(VPP)の各サブ市場セグメントは予測期間中にどのように成長し、2033年にこれらのサブ市場が占める収益はどの程度になるのか?
- 2023年から2033年にかけて、各仮想発電所(VPP)サブマーケットの市場シェアはどのように推移するのか?
- 2023年から2033年にかけて、市場全体の主なドライバーは何でしょうか?
- 主要な仮想発電所(VPP)市場はマクロ経済のダイナミクスに広く追随するのか、それとも個々の国内市場が他を凌駕するのか?
- 2033年までに各国市場のシェアはどのように変化し、どの地域が2033年の市場をリードするのか?
- 主要プレイヤーは誰か、また予測期間中の見通しは?
- これらの主要企業の仮想発電所(VPP)プロジェクトはどのようなものですか?
- 2023年から2033年の間に、業界はどのように進化するのか?現在および今後10年間に行われる仮想発電所(VPP)プロジェクトにはどのような意味があるのか?
- 仮想発電所(VPP)市場をさらに拡大するために、製品の商業化の必要性は高いか?
- 仮想発電所(VPP)市場はどこに向かい、どのようにすれば市場の最前線に立てるか?
- 新製品やサービスラインに対する最適な投資オプションは何か?
- 企業を新たな成長軌道に乗せ、C-suiteに移行させるための重要な展望とは?
このことが、現在、そして今後10年間の仮想発電所(VPP)市場にどのような影響を与えるかを知る必要があります。
- 本レポートは347ページにわたり、158の表と199のグラフを掲載しています。
- このレポートでは、業界における主要な収益性の高い分野をハイライトしているため、今すぐターゲットを絞ることができます。
- 世界、地域、国別の売上高と成長率を詳細に分析しています。
- 競合他社が成功した主要なトレンド、変化、収益予測をハイライトしています。
本レポートは、仮想発電所(VPP)市場が今後10年間にどのように発展し、COVID-19の景気後退と回復の変動に沿ったものであることを今日あなたに伝えます。この市場は、過去10年間のどの時点よりも、今がより重要なのです。
2033年までの予測やその他の分析により、商業的な展望が見えてきた
- 2033年までの収益予測に加え、直近の実績、成長率、市場シェアもご覧いただけます。
- ビジネスの展望や展開など、独自の分析もご覧いただけます。
- 定性的分析(市場力学、ドライバー、機会、阻害要因、課題など)、コスト構造、仮想発電所(VPP)価格上昇の影響、最近の動向などをご覧いただけます。
本レポートでは、COVID-19が業界と貴社にどのような影響を及ぼすかについて、データ分析と貴重な洞察を掲載しています。本レポートでは、COVID-19の4つの回収パターンとその影響、すなわち「V」、「L」、「W」、「U」について論じています。
報告書の対象セグメント
コンポーネント別市場セグメント
- エネルギー生成技術
- エネルギー貯蔵技術
- 情報通信技術(ICT)
エンドユーザー別市場セグメント
- 産業用VPP
- 商業用VPP
- 住宅用VPP
- その他エンドユーザー
情報通信技術(ICT)別市場セグメント
- エネルギーマネジメントシステム (EMS)
- 監視制御・データ収集システム (SCADA)
- 配電管理システム(DMS)
- スマートメータ
- その他情報通信技術(ICT)
エネルギー生成技術別市場セグメント
- 風力発電
- 小水力発電
- 太陽光発電
- 熱電併給(CHP)
- 小規模発電所
- その他のエネルギー生成技術
エネルギー貯蔵技術別市場セグメント
- バッテリーエネルギー貯蔵システム(BESS)
- スーパーキャパシタ蓄電システム(SCES)
- 超伝導磁気エネルギー貯蔵(SMES)
- 油圧ポンプ式エネルギー貯蔵(HPES)
- フライホイールエネルギーストレージ(FWES)
- その他のエネルギー貯蔵技術
世界市場全体とセグメントの収益予測に加え、4地域と主要20カ国市場の収益予測も掲載しています。
北米
- アメリカ
- カナダ
欧州
- ドイツ
- スペイン
- イギリス
- フランス
- イタリア
- その他の地域
アジア太平洋地域
- 中国
- 日本
- インド
- オーストラリア
- 韓国
- その他のアジア太平洋地域
中東・アフリカ
- GCC
- 南アフリカ
- その他の中東・アフリカ地域
ラテンアメリカ
- ブラジル
- メキシコ
-その他のラテンアメリカ地域
仮想発電所(VPP)市場の2023年から2033年までの主要企業のプロファイルと、これらの企業の事業のこのセグメントに焦点を当てたものも含まれています。
主要企業と市場成長の可能性
・ ABB Ltd.
・ AGL Energy Ltd
・ AutoGrid
・ Blue Pillar
・ Cisco Systems, Inc.
・ Enel S.P.A
・ Enernoc, Inc.
・ General Electric Company
・ Hitachi, Ltd.
・ International Business Machines Corporation
・ Next Kraftwerke
・ Robert Bosch GmbH
・ Schneider Electric SE
・ Siemens AG
・ Toshiba Corporation
仮想発電所(VPP)市場の世界全体の収益、金額で2023年から2033年まで、市場は2023年に5億2070万米ドルを突破すると、我々の仕事は計算しています。また、2033年までの間に収益が大きく伸びると予測しています。本調査では、最も大きな可能性を秘めた企業を特定しています。彼らの能力、進歩、商業的展望を知ることで、一歩先を行くことができます。
仮想発電所(VPP)市場、2023年から2033年までのレポートはどのようにあなたのお役に立ちますか?
340ページを超えるレポートでは、要約すると以下のような知識を得ることができます。
- 仮想発電所(VPP)市場の2033年までの収益予測、コンポーネント、エンドユーザー、情報通信技術(ICT)、エネルギー生成技術、企業規模の各予測を世界と地域レベルで掲載 - 業界の展望を見出し、投資と収益に最も有利な場所を見つけることができます。
- 4つの地域と20の主要国市場の2033年までの収益予測 - 北米、欧州、アジア太平洋、中南米、中東&アフリカの仮想発電所(VPP)市場、2023年から2033年の市場予測をご覧いただけます。また、米国、カナダ、メキシコ、ブラジル、ドイツ、フランス、イギリス、イタリア、中国、インド、日本、オーストラリアなどの主要経済圏の市場も予測されています。
- 既存企業や市場参入を目指す企業の展望 - 仮想発電所(VPP)市場に関わる主要企業15社の企業プロファイルを含む、2023年から2033年までの展望を掲載しています。
定量的・定性的な分析と独自の予測をご覧いただけます。私たちのレポートだけが持つ情報を入手し、貴重なビジネスインテリジェンスを得ることができます。
他にはない情報
私たちの新しいレポートがあれば、知識の遅れを取り戻し、チャンスを逃す可能性が低くなります。私たちの研究が貴社の調査、分析、意思決定にどのように役立つかをご覧ください。Visiongainの研究は、仮想発電所(VPP)市場、2023年から2033年、市場をリードする企業のための商業分析を必要とするすべての人のためのものです。データ、トレンド、予測を見つけることができます。
ページTOPに戻る
目次
目次
1.レポートの概要
1.1 調査の目的
1.2 仮想発電所(VPP)市場の紹介
1.3 本レポートが提供するもの
1.4 本レポートを読むべき理由
1.5 本分析レポートが回答する主な質問には以下が含まれる。
1.6 本レポートは誰のためのものなのか?
1.7 方法論
1.7.1 市場の定義
1.7.2 市場評価・予測手法
1.7.3 データの検証
1.8 よくある質問と回答(FAQ)
1.9 関連するVisiongainレポート
1.10 Visiongainについて
2 エグゼクティブサマリー
3 プレミアムインサイト
3.1 地域別スナップショット仮想発電所(VPP)の世界市場
3.2 コンポーネント・セグメント市場魅力度指数
3.3 エンドユーザセグメント市場魅力度指標
3.4 情報通信技術:市場魅力度指標
3.5 エネルギー生成技術:市場魅力度指標
3.6 エネルギー貯蔵技術:市場魅力度指標
4 市場概要
4.1 主要な調査結果
4.2 マーケットダイナミクス
4.2.1 市場の推進要因
4.2.2 市場の抑制要因
4.2.3 市場機会
4.3 ポーターのファイブフォース分析
4.3.1 供給者のバーゲニングパワー
4.3.2 バイヤーのバーゲニングパワー
4.3.3 競争相手との競合
4.3.4 代替品による脅威
4.3.5 新規参入者の脅威
4.4 環境要因分析
4.4.1 政治的要因
4.4.2 経済的要因
4.4.3 社会的要因
4.4.4 技術的要因
5 世界の仮想発電所(VPP)市場分析:コンポーネント別
5.1 主な調査結果
5.2 仮想発電所(VPP)の世界におけるコンポーネント別市場魅力度指数
5.2.1 コンポーネント別仮想発電所(VPP)の世界市場魅力度指数
5.2.2 コンポーネント別仮想発電所(VPP)の世界市場規模推定・予測
5.3 エネルギー生成技術
5.4 エネルギー生成技術の世界市場規模推計予測、2023年~2033年(US$ Mn)
出典ビジョンゲインレポート株式会社、2023年
5.4.1 エネルギー生成技術の世界市場規模予測、地域別、2023年~2033年(US$ Mn)
5.5 エネルギー貯蔵技術
5.5.1 エネルギー貯蔵技術の世界市場規模予測、2023年~2033年 (US$ Mn)
5.5.2 エネルギー貯蔵技術の世界市場規模予測、地域別、2023年~2033年 (US$ Mn)
5.6 情報通信技術(ICT)
5.6.1 情報通信技術(ICT)の世界市場規模予測、2023年~2033年(US$ Mn)
5.6.2 情報通信技術(ICT)の世界市場規模予測、2023年~2033年(US$ Mn)
6 世界の仮想発電所(VPP)市場分析:エンドユーザー別
6.1 主な調査結果
6.2 仮想発電所(VPP)の世界におけるエンドユーザー別市場魅力度指数
6.2.1 仮想発電所(VPP)の世界におけるエンドユーザー別市場魅力度指数
6.2.2 世界の仮想発電所(VPP)市場規模予測・予測:エンドユーザー別
6.3 産業用VPP
6.4 産業用VPPの世界市場規模推計予測、2023年~2033年(US$ Mn)
出典:Visiongain Reports Ltd:ビジョンゲインレポート株式会社、2023年
6.4.1 産業用VPPの世界市場規模予測、地域別、2023年~2033年 (US$ Mn)
6.5 商用VPP
6.5.1 商用VPPの世界市場規模予測、2023年~2033年(US$ Mn)
6.5.2 商用VPPの世界市場規模予測、地域別、2023年~2033年(US$ Mn)
6.6 住宅用VPP
6.6.1 住宅用VPPの世界市場規模予測、2023年~2033年(US$ Mn)
6.6.2 住宅用VPPの世界市場規模予測、地域別、2023年~2033年(US$ Mn)
6.7 その他のエンドユーザー
6.7.1 その他のエンドユーザーの世界市場規模予測、2023年~2033年 (US$ Mn)
6.7.2 その他のエンドユーザーの世界市場規模予測、地域別、2023年~2033年 (US$ Mn)
7 世界の仮想発電所(VPP)市場分析:情報通信技術別
7.1 主な調査結果
7.2 仮想発電所(VPP)の世界市場魅力度指数:情報通信技術別
7.2.1 仮想発電所(VPP)の世界市場魅力度指数:エンドユーザー別
7.2.2 仮想発電所(VPP)の世界市場規模予測・予測:情報通信技術別
7.3 エネルギーマネジメントシステム(EMS)
7.4 エネルギーマネジメントシステム(EMS)の世界市場規模推計予測、2023-2033 (US$ Mn)
出典ビジョンゲインレポート株式会社、2023年
7.4.1 エネルギーマネジメントシステム(EMS)の世界市場規模予測、地域別、2023年~2033年(US$ Mn)
7.5 監視制御とデータ収集(SCADA)
7.5.1 監視制御とデータ収集(SCADA)の世界市場規模予測、2023年~2033年(US$ Mn)
7.5.2 監視制御とデータ収集(SCADA)の世界市場規模予測、地域別、2023年~2033年(US$ Mn)
7.6 配電管理システム(DMS)
7.6.1 配電管理システム(DMS)の世界市場規模予測、2023年~2033年(US$ Mn)
7.6.2 配電管理システム(DMS)の世界市場規模予測、地域別、2023-2033年(US$ Mn)
7.7 スマートメーター
7.7.1 スマートメーターの世界市場規模予測、2023年~2033年 (US$ Mn)
7.7.2 スマートメーターの世界市場規模予測、地域別、2023年~2033年 (US$ Mn)
7.8 その他の情報通信技術(ICT)
7.8.1 その他の情報通信技術(ICT)の世界市場規模予測、2023年~2033年(US$ Mn)
7.8.2 その他の情報通信技術(ICT)の世界市場規模予測、地域別、2023年~2033年(US$ Mn)
8 世界の仮想発電所(VPP)市場分析:エネルギー生成技術別
8.1 主な調査結果
8.2 仮想発電所(VPP)の世界市場魅力度指数:エネルギー生成技術別
8.1.1 世界の仮想発電所(VPP)市場魅力度指数:エネルギー生成技術別
8.1.2 世界の仮想発電所(VPP)市場規模予測・予測:エネルギー生成技術別
8.2 風力発電
8.3 風力発電の世界市場規模予測、2023年~2033年(US$ Mn)
出典ビジョンゲインレポート株式会社、2023年
8.3.1 エネルギーマネジメントシステム(EMS)の世界地域別市場規模予測、2023年~2033年(US$ Mn)
8.4 小型水力発電所
8.4.1 小型水力発電所の世界市場規模予測、2023年~2033年 (US$ Mn)
8.4.2 小型水力発電所の世界市場規模予測、地域別、2023年~2033年(US$ Mn)
8.5 太陽電池生産
8.5.1 太陽電池生産の世界市場規模予測、2023年~2033年 (US$ Mn)
8.5.2 太陽電池生産の世界市場規模予測、地域別、2023年~2033年(US$ Mn)
8.6 熱電併給(CHP)
8.6.1 熱電併給(CHP)の世界市場規模予測、2023年~2033年(US$ Mn)
8.6.2 熱電併給(CHP)の世界地域別市場予測、2023年~2033年(US$ Mn)
8.7 小型発電所
8.7.1 小型発電所の世界市場規模予測、2023年~2033年(US$ Mn)
8.7.2 小型発電所の世界市場規模予測、地域別、2023年~2033年(US$ Mn)
8.8 その他のエネルギー生成技術
8.8.1 その他のエネルギー生成技術の世界市場規模予測、2023-2033年(US$ Mn)
8.8.2 その他のエネルギー生成技術の世界市場規模予測、地域別、2023年~2033年(US$ Mn)
9 仮想発電所(VPP)の世界市場分析:エネルギー貯蔵技術別
9.1 主な調査結果
9.2 仮想発電所(VPP)の世界市場魅力度指標:エネルギー貯蔵技術別
9.1.1 エネルギー生成技術別仮想発電所(VPP)の世界市場魅力度指数
9.1.2 エネルギー貯蔵技術別仮想発電所(VPP)の世界市場規模推計・予測
9.2 バッテリーエネルギー貯蔵システム(BESS)
9.3 バッテリーエネルギー貯蔵システム(BESS)の世界市場規模推計予測、2023年~2033年(US$ Mn)
出典ビジョンゲインレポート株式会社、2023年
9.3.1 バッテリーエネルギー貯蔵システム(BESS)の世界市場規模予測、地域別、2023年~2033年(US$ Mn)
9.4 スーパーキャパシタ蓄電システム(SCES)
9.4.1 スーパーキャパシタ蓄電システム(SCES)の世界市場規模予測、2023年~2033年(US$ Mn)
9.4.2 スーパーキャパシタ型エネルギー貯蔵(SCES)の世界市場規模予測、地域別、2023年~2033年(US$ Mn)
9.5 超伝導磁気エネルギー貯蔵(SMES)
9.5.1 超伝導磁気エネルギー貯蔵(SMES)の世界市場規模予測、2023年~2033年(US$ Mn)
9.5.2 超伝導磁気エネルギー貯蔵(SMES)の世界地域別市場予測、2023年~2033年(US$ Mn)
9.6 油圧ポンプ式エネルギー貯蔵装置(HPES)
9.6.1 油圧式揚水エネルギー貯蔵(HPES)の世界市場規模予測、2023年~2033年(US$ Mn)
9.6.2 油圧式揚水エネルギー貯蔵(HPES)の世界市場規模予測、地域別、2023年~2033年(US$ Mn)
9.7 フライホイールエネルギー貯蔵(FWES)
9.7.1 フライホイールエネルギーストレージ(FWES)の世界市場規模予測、2023年~2033年(US$ Mn)
9.7.2 フライホイールエネルギーストレージ(FWES)の世界市場規模予測、地域別、2023年~2033年(US$ Mn)
9.8 その他のエネルギー貯蔵技術
9.8.1 その他のエネルギー貯蔵技術の世界市場規模予測、2023年~2033年(US$ Mn)
9.8.2 その他のエネルギー貯蔵技術の世界市場規模予測、地域別、2023年~2033年(US$ Mn)
10 世界の仮想発電所(VPP)地域別市場分析
10.1 主な調査結果
10.2 地域別市場規模の推定と予測
10.3 COVID-19の影響度分析。回復シナリオ(V, U, W, L)
11 北米の仮想発電所(VPP)市場分析
11.1 主な調査結果
11.1.1 北米仮想発電所(VPP)市場魅力度指数
11.1.2 北米仮想発電所(VPP)地域別市場シェア、2023年&2033年
11.2 北米仮想発電所(VPP)国別市場規模予測・予想
11.3 北米仮想発電所(VPP)市場 コンポーネント別市場規模予測・予想
11.4 北米仮想発電所(VPP)のエンドユーザー別市場規模予測・予想
11.5 北米の仮想発電所(VPP)市場の情報通信技術(ICT)別規模の予測・予想
11.6 北米仮想発電所(VPP)市場規模予測・予測:エネルギー生成技術別
11.7 北米仮想発電所(VPP)市場規模予測・予測:エネルギー貯蔵技術別
11.8 アメリカ市場分析
11.9 カナダの市場分析
12 欧州の仮想発電所(VPP)市場分析
12.1 主要な調査結果
12.1.1 欧州仮想発電所(VPP)市場魅力度指数
12.1.2 欧州仮想発電所(VPP)地域別市場シェア(2023年&2033年
12.2 欧州仮想発電所(VPP)国別市場規模予測・予想
12.3 欧州仮想発電所(VPP)市場 コンポーネント別市場規模予測・予測
12.4 欧州仮想発電所(VPP)市場のエンドユーザー別市場規模予測・予想
12.5 欧州仮想発電所(VPP)市場規模予測・予測:情報通信技術(ICT)別
12.6 欧州仮想発電所(VPP)市場規模予測・予測:エネルギー生成技術別
12.7 欧州仮想発電所(VPP)市場規模予測・予測:エネルギー貯蔵技術別
12.8 ドイツの市場分析
12.9 イギリスの市場分析
12.10 フランスの市場分析
12.11 イタリアの市場分析
12.12 スペインの市場分析
12.13 その他の欧州の市場分析
13 アジア太平洋地域の仮想発電所(VPP)市場分析
13.1 主要な調査結果
13.1.1 アジア太平洋地域の仮想発電所(VPP)市場魅力度指数
13.1.2 アジア太平洋地域の仮想発電所(VPP)市場地域別シェア、2023年&2033年
13.2 アジア太平洋地域の仮想発電所(VPP)国別市場規模の推定と予測
13.3 アジア太平洋地域の仮想発電所(VPP)市場規模予測・予測:コンポーネント別
13.4 アジア太平洋地域の仮想発電所(VPP)市場規模予測・エンドユーザー別予測
13.5 アジア太平洋地域の仮想発電所(VPP)市場規模予測・予測:情報通信技術(ICT)別
13.6 アジア太平洋地域の仮想発電所(VPP)市場規模予測・予測:エネルギー生成技術別
13.7 アジア太平洋地域の仮想発電所(VPP)市場規模予測・予測:エネルギー貯蔵技術別
13.8 中国市場の分析
13.9 インド市場の分析
13.10 日本の市場分析
13.11 韓国市場の分析
13.12 オーストラリアの市場分析
13.13 その他のアジア太平洋地域の市場分析
14 中東・アフリカの仮想発電所(VPP)市場分析
14.1 主要な調査結果
14.1.1 中東・アフリカの仮想発電所(VPP)市場魅力度指数
14.1.2 中東・アフリカ地域別仮想発電所(VPP)市場シェア、2023年~2033年
14.2 中東・アフリカ 仮想発電所(VPP)国別市場規模予測・予想
14.3 中東・アフリカ 仮想発電所(VPP)市場 コンポーネント別市場規模予測・予想
14.4 中東・アフリカ地域の仮想発電所(VPP)市場のエンドユーザー別市場規模予測・予想
14.5 中東・アフリカ 仮想発電所(VPP)の情報通信技術(ICT)別市場規模予測・予想
14.6 中東・アフリカ地域 仮想発電所(VPP)市場規模予測・予測:エネルギー生成技術別
14.7 中東・アフリカ地域の仮想発電所(VPP)市場規模予測・予測:エネルギー貯蔵技術別
14.8 GCCの市場分析
14.9 南アフリカの市場分析
14.10 その他の中東・アフリカ地域の市場分析
15 ラテンアメリカの仮想発電所(VPP)市場分析
15.1 主要な調査結果
15.1.1 ラテンアメリカの仮想発電所(VPP)市場魅力度指数
15.1.2 ラテンアメリカの仮想発電所(VPP)地域別市場シェア(2023年&2033年
15.2 ラテンアメリカの仮想発電所(VPP)国別市場規模予測・予想
15.3 ラテンアメリカの仮想発電所(VPP)市場規模予測・予測:コンポーネント別
15.4 ラテンアメリカの仮想発電所(VPP)市場のエンドユーザー別市場規模予測・予想
15.5 ラテンアメリカの仮想発電所(VPP)市場規模予測・予測:情報通信技術(ICT)別
15.6 ラテンアメリカの仮想発電所(VPP)市場規模予測・予測:エネルギー生成技術別
15.7 ラテンアメリカの仮想発電所(VPP)市場規模予測・予測:エネルギー貯蔵技術別
15.8 ブラジルの市場分析
15.9 メキシコの市場分析
15.10 その他のラテンアメリカの市場分析
16 主要企業のプロフィール
16.1 ゼネラル・エレクトリック社
16.1.1 会社概要
16.1.2 会社概要
16.1.3 財務分析
16.1.4 製品ベンチマーク
16.1.5 戦略的展望
16.2 株式会社東芝
16.2.1 会社概要
16.2.2 会社概要
16.2.3 財務分析
16.2.4 製品ベンチマーク
16.2.5 戦略的展望
16.3 エネル・エスピーエー
16.3.1 企業スナップショット
16.3.2 会社概要
16.3.3 製品ベンチマーク
16.3.4 戦略的展望
16.4 シュナイダーエレクトリックSE
16.4.1 企業スナップショット
16.4.2 会社概要
16.4.3 財務分析
16.4.4 製品ベンチマーク
16.4.5 戦略的な展望
16.5 ABB社
16.5.1 企業スナップショット
16.5.2 会社概要
16.5.3 財務分析
16.5.4 製品ベンチマーク
16.5.5 戦略的展望
16.6 株式会社日立製作所
16.6.1 企業スナップショット
16.6.2 会社概要
16.6.3 財務分析
16.6.4 製品ベンチマーク
16.6.5 戦略的展望
16.7 シーメンスAG
16.7.1 企業スナップショット
16.7.2 会社概要
16.7.3 財務分析
16.7.4 製品ベンチマーク
16.7.5 戦略的展望
16.8 ロバート・ボッシュGmbH
16.8.1 企業スナップショット
16.8.2 会社概要
16.8.3 製品ベンチマーク
16.8.4 戦略的展望
16.9 ブルーピラー
16.9.1 企業スナップショット
16.9.2 会社概要
16.9.3 ベンチマーキング
16.9.4 戦略的展望
16.10 インターナショナル・ビジネス・マシーンズ・コーポレーション
16.10.1 企業スナップショット
16.10.2 会社概要
16.10.3 財務分析
16.10.4 製品ベンチマーク
16.10.5 戦略的展望
16.11 シスコシステムズ
16.11.1 企業スナップショット
16.11.2 会社概要
16.11.3 財務分析
16.11.4 製品ベンチマーク
16.11.5 戦略的な展望
16.12 AGLエナジー
16.12.1 会社概要
16.12.2 会社概要
16.12.3 製品ベンチマーク
16.12.4 戦略的展望
16.13 エナーノック社
16.13.1 企業スナップショット
16.13.2 会社概要
16.13.3 ベンチマーキング
16.13.4 戦略的展望
16.14 ネクスト・クラフトヴェルケ
16.14.1 企業スナップショット
16.14.2 会社概要
16.14.3 製品ベンチマーク
16.14.4 戦略的展望
16.15 オートグリッド
16.15.1 企業スナップショット
16.15.2 会社概要
16.15.3 ベンチマーキング
16.15.4 戦略的展望
17 結論と提言
17.1 ヴィジョンゲインからの結論
17.2 市場関係者への提言
17.1 インセンティブと規制措置の改善により、仮想効率発電所構想への広範な投資を促進することができる。
17.2 エネルギー効率化チャンピオンは、新しい省エネ技術に関する知識のギャップを埋めることができる。
17.3 クレジットと融資は、中小企業のエネルギー効率化イニシアチブの資金調達を支援することができる。
17.4 その他の注目すべきプレーヤー一覧
表の一覧
Table 1 Global Virtual Power Plant (VPP) Market Snapshot, 2023 & 2033 (US$ billion, CAGR %)
Table 2 Global Virtual Power Plant Market by Component, 2023-2033 (US$ Mn, AGR (%), CAGR (%))
Table 3 Global Energy Generation Technology Market Forecast, 2023-2033 (US$ Mn, AGR (%), CAGR (%))
Table 4 Global Energy Generation Technology Market by Region, 2023-2033 (US$ Mn, AGR (%), CAGR (%))
Table 5 Global Energy Storage Technologies Market Forecast, 2023-2033 (US$ Mn, AGR (%), CAGR (%))
Table 6 Global Energy Storage Technologies Market by Region, 2023-2033 (US$ Mn, AGR (%), CAGR (%))
Table 7 Global Information Communication Technology (ICT) Market Forecast, 2023-2033 (US$ Mn, AGR (%), CAGR (%))
Table 8 Global Information Communication Technology (ICT) Market by Region, 2023-2033 (US$ Mn, AGR (%), CAGR (%))
Table 9 Global Virtual Power Plant Market by End-User, 2023-2033 (US$ Mn, AGR (%), CAGR (%))
Table 10 Global Industrial VPP Market Forecast, 2023-2033 (US$ Mn, AGR (%), CAGR (%))
Table 11 Global Industrial VPP Market by Region, 2023-2033 (US$ Mn, AGR (%), CAGR (%))
Table 12 Global Commercial VPP Market Forecast, 2023-2033 (US$ Mn, AGR (%), CAGR (%))
Table 13 Global Commercial VPP Market by Region, 2023-2033 (US$ Mn, AGR (%), CAGR (%))
Table 14 Global Residential VPP Market Forecast, 2023-2033 (US$ Mn, AGR (%), CAGR (%))
Table 15 Global Residential VPP Market by Region, 2023-2033 (US$ Mn, AGR (%), CAGR (%))
Table 16 Global Other End-User Market Forecast, 2023-2033 (US$ Mn, AGR (%), CAGR (%))
Table 17 Global Other End-User Market by Region, 2023-2033 (US$ Mn, AGR (%), CAGR (%))
Table 18 Global Virtual Power Plant Market by Information Communication Technology (ICT), 2023-2033 (US$ Mn, AGR (%), CAGR (%))
Table 19 Global Energy Management Systems (EMS) Market Forecast, 2023-2033 (US$ Mn, AGR (%), CAGR (%))
Table 20 Global Energy Management Systems (EMS) Market by Region, 2023-2033 (US$ Mn, AGR (%), CAGR (%))
Table 21 Global Supervisory Control and Data Acquisition (SCADA) Market Forecast, 2023-2033 (US$ Mn, AGR (%), CAGR (%))
Table 22 Global Supervisory Control and Data Acquisition (SCADA) Market by Region, 2023-2033 (US$ Mn, AGR (%), CAGR (%))
Table 23 Global Distribution Management System (DMS) Market Forecast, 2023-2033 (US$ Mn, AGR (%), CAGR (%))
Table 24 Global Distribution Management System (DMS) Market by Region, 2023-2033 (US$ Mn, AGR (%), CAGR (%))
Table 25 Global Smart Meters Market Forecast, 2023-2033 (US$ Mn, AGR (%), CAGR (%))
Table 26 Global Smart Meters Market by Region, 2023-2033 (US$ Mn, AGR (%), CAGR (%))
Table 27 Global Other Information Communication Technology (ICT) Market Forecast, 2023-2033 (US$ Mn, AGR (%), CAGR (%))
Table 28 Global Other Information Communication Technology (ICT) Market by Region, 2023-2033 (US$ Mn, AGR (%), CAGR (%))
Table 29 Global Virtual Power Plant Market by Energy Generation Technology, 2023-2033 (US$ Mn, AGR (%), CAGR (%))
Table 30 Global Wind Based Energy Generation Market Forecast, 2023-2033 (US$ Mn, AGR (%), CAGR (%))
Table 31 Global Wind Based Energy Generation Market by Region, 2023-2033 (US$ Mn, AGR (%), CAGR (%))
Table 32 Global Small Hydro-Plants Market Forecast, 2023-2033 (US$ Mn, AGR (%), CAGR (%))
Table 33 Global Small Hydro-Plants Market by Region, 2023-2033 (US$ Mn, AGR (%), CAGR (%))
Table 34 Global Solar Production Market Forecast, 2023-2033 (US$ Mn, AGR (%), CAGR (%))
Table 35 Global Solar Production Market by Region, 2023-2033 (US$ Mn, AGR (%), CAGR (%))
Table 36 Global Combined Heat and Power (CHP) Market Forecast, 2023-2033 (US$ Mn, AGR (%), CAGR (%))
Table 37 Global Combined Heat and Power (CHP) Market by Region, 2023-2033 (US$ Mn, AGR (%), CAGR (%))
Table 38 Global Small Power Plants Market Forecast, 2023-2033 (US$ Mn, AGR (%), CAGR (%))
Table 39 Global Small Power Plants Market by Region, 2023-2033 (US$ Mn, AGR (%), CAGR (%))
Table 40 Global Other Energy Generation Technology Market Forecast, 2023-2033 (US$ Mn, AGR (%), CAGR (%))
Table 41 Global Other Energy Generation Technology Market by Region, 2023-2033 (US$ Mn, AGR (%), CAGR (%))
Table 42 Global Virtual Power Plant Market by Energy Storage Technology, 2023-2033 (US$ Mn, AGR (%), CAGR (%))
Table 43 Global Battery Energy Storage System (BESS) Market Forecast, 2023-2033 (US$ Mn, AGR (%), CAGR (%))
Table 44 Global Battery Energy Storage System (BESS) Market by Region, 2023-2033 (US$ Mn, AGR (%), CAGR (%))
Table 45 Global Supercapacitor Energy Storage (SCES) Market Forecast, 2023-2033 (US$ Mn, AGR (%), CAGR (%))
Table 46 Global Supercapacitor Energy Storage (SCES) Market by Region, 2023-2033 (US$ Mn, AGR (%), CAGR (%))
Table 47 Global Super Conductor Magnetic Energy Storage (SMES) Market Forecast, 2023-2033 (US$ Mn, AGR (%), CAGR (%))
Table 48 Global Super Conductor Magnetic Energy Storage (SMES) Market by Region, 2023-2033 (US$ Mn, AGR (%), CAGR (%))
Table 49 Global Hydraulic Pumped Energy Storage (HPES) Market Forecast, 2023-2033 (US$ Mn, AGR (%), CAGR (%))
Table 50 Global Hydraulic Pumped Energy Storage (HPES) Market by Region, 2023-2033 (US$ Mn, AGR (%), CAGR (%))
Table 51 Global Flywheel Energy Storage (FWES) Market Forecast, 2023-2033 (US$ Mn, AGR (%), CAGR (%))
Table 52 Global Flywheel Energy Storage (FWES) Market by Region, 2023-2033 (US$ Mn, AGR (%), CAGR (%))
Table 53 Global Other Energy Storage Technology Market Forecast, 2023-2033 (US$ Mn, AGR (%), CAGR (%))
Table 54 Global Other Energy Storage Technology Market by Region, 2023-2033 (US$ Mn, AGR (%), CAGR (%))
Table 55 Global Virtual Power Plant Market by Region, 2023-2033 (US$ Mn, AGR (%), CAGR (%))
Table 56 Global Virtual Power Plant Market Forecast, 2023-2033 (US$ Mn, AGR (%), CAGR (%)) (V-Shaped Recovery Scenario)
Table 57 Global Virtual Power Plant Market by Region, 2023-2033 (US$ Mn, AGR (%), CAGR (%)) (V-Shaped Recovery Scenario)
Table 58 Global Virtual Power Plant Market Forecast, 2023-2033 (US$ Mn, AGR (%), CAGR (%)) (U-Shaped Recovery Scenario)
Table 59 Global Virtual Power Plant Market by Region, 2023-2033 (US$ Mn, AGR (%), CAGR (%)) (U-Shaped Recovery Scenario)
Table 60 Global Virtual Power Plant Market Forecast, 2023-2033 (US$ Mn, AGR (%), CAGR (%)) (W-Shaped Recovery Scenario)
Table 61 Global Virtual Power Plant Market by Region, 2023-2033 (US$ Mn, AGR (%), CAGR (%)) (W-Shaped Recovery Scenario)
Table 62 Global Virtual Power Plant Market Forecast, 2023-2033 (US$ Mn, AGR (%), CAGR (%)) (L-Shaped Recovery Scenario)
Table 63 Global Virtual Power Plant Market by Region, 2023-2033 (US$ Mn, AGR (%), CAGR (%)) (L-Shaped Recovery Scenario)
Table 64 North America Virtual Power Plant Market by Country, 2023-2033 (US$ Mn, AGR (%), CAGR (%))
Table 65 North America Virtual Power Plant Market by Component, 2023-2033 (US$ Mn, AGR (%), CAGR (%))
Table 66 North America Virtual Power Plant Market by End-User, 2023-2033 (US$ Mn, AGR (%), CAGR (%))
Table 67 North America Virtual Power Plant Market by Information Communication Technology (ICT), 2023-2033 (US$ Mn, AGR (%), CAGR (%))
Table 68 North America Virtual Power Plant Market by Energy Generation Technology, 2023-2033 (US$ Mn, AGR (%), CAGR (%))
Table 69 North America Virtual Power Plant Market by Energy Storage Technology, 2023-2033 (US$ Mn, AGR (%), CAGR (%))
Table 70 US Virtual Power Plant Market by Value, 2023-2033 (US$ Mn, AGR (%), CAGR (%))
Table 71 Canada Virtual Power Plant Market by Value, 2023-2033 (US$ Mn, AGR (%), CAGR (%))
Table 72 Europe Virtual Power Plant Market by Country, 2023-2033 (US$ Mn, AGR (%), CAGR (%))
Table 73 Europe Virtual Power Plant Market by Component, 2023-2033 (US$ Mn, AGR (%), CAGR (%))
Table 74 Europe Virtual Power Plant Market by End-User, 2023-2033 (US$ Mn, AGR (%), CAGR (%))
Table 75 Europe Virtual Power Plant Market by Information Communication Technology (ICT), 2023-2033 (US$ Mn, AGR (%), CAGR (%))
Table 76 Europe Virtual Power Plant Market by Energy Generation Technology, 2023-2033 (US$ Mn, AGR (%), CAGR (%))
Table 77 Europe Virtual Power Plant Market by Energy Storage Technology, 2023-2033 (US$ Mn, AGR (%), CAGR (%))
Table 78 Germany Virtual Power Plant Market by Value, 2023-2033 (US$ Mn, AGR (%), CAGR (%))
Table 79 UK Virtual Power Plant Market by Value, 2023-2033 (US$ Mn, AGR (%), CAGR (%))
Table 80 France Virtual Power Plant Market by Value, 2023-2033 (US$ Mn, AGR (%), CAGR (%))
Table 81 Italy Virtual Power Plant Market by Value, 2023-2033 (US$ Mn, AGR (%), CAGR (%))
Table 82 Spain Virtual Power Plant Market by Value, 2023-2033 (US$ Mn, AGR (%), CAGR (%))
Table 83 Rest of Europe Virtual Power Plant Market by Value, 2023-2033 (US$ Mn, AGR (%), CAGR (%))
Table 84 Asia-Pacific Virtual Power Plant Market by Country, 2023-2033 (US$ Mn, AGR (%), CAGR (%))
Table 85 Asia-Pacific Virtual Power Plant Market by Component, 2023-2033 (US$ Mn, AGR (%), CAGR (%))
Table 86 Asia-Pacific Virtual Power Plant Market by End-User, 2023-2033 (US$ Mn, AGR (%), CAGR (%))
Table 87 Asia-Pacific Virtual Power Plant Market by Information Communication Technology (ICT), 2023-2033 (US$ Mn, AGR (%), CAGR (%))
Table 88 Asia-Pacific Virtual Power Plant Market by Energy Generation Technology, 2023-2033 (US$ Mn, AGR (%), CAGR (%))
Table 89 Asia-Pacific Virtual Power Plant Market by Energy Storage Technology, 2023-2033 (US$ Mn, AGR (%), CAGR (%))
Table 90 China Virtual Power Plant Market by Value, 2023-2033 (US$ Mn, AGR (%), CAGR (%))
Table 91 India Virtual Power Plant Market by Value, 2023-2033 (US$ Mn, AGR (%), CAGR (%))
Table 92 Japan Virtual Power Plant Market by Value, 2023-2033 (US$ Mn, AGR (%), CAGR (%))
Table 93 South Korea Virtual Power Plant Market by Value, 2023-2033 (US$ Mn, AGR (%), CAGR (%))
Table 94 Australia Virtual Power Plant Market by Value, 2023-2033 (US$ Mn, AGR (%), CAGR (%))
Table 95 Rest of Asia-Pacific Virtual Power Plant Market by Value, 2023-2033 (US$ Mn, AGR (%), CAGR (%))
Table 96 Middle East & Africa Virtual Power Plant Market by Country, 2023-2033 (US$ Mn, AGR (%), CAGR (%))
Table 97 Middle East & Africa Virtual Power Plant Market by Component, 2023-2033 (US$ Mn, AGR (%), CAGR (%))
Table 98 Middle East & Africa Virtual Power Plant Market by End-User, 2023-2033 (US$ Mn, AGR (%), CAGR (%))
Table 99 Middle East & Africa Virtual Power Plant Market by Information Communication Technology (ICT), 2023-2033 (US$ Mn, AGR (%), CAGR (%))
Table 100 Middle East & Africa Virtual Power Plant Market by Energy Generation Technology, 2023-2033 (US$ Mn, AGR (%), CAGR (%))
Table 101 Middle East & Africa Virtual Power Plant Market by Energy Storage Technology, 2023-2033 (US$ Mn, AGR (%), CAGR (%))
Table 102 GCC Virtual Power Plant Market by Value, 2023-2033 (US$ Mn, AGR (%), CAGR (%))
Table 103 South Africa Virtual Power Plant Market by Value, 2023-2033 (US$ Mn, AGR (%), CAGR (%))
Table 104 Rest of Middle East & Africa Virtual Power Plant Market by Value, 2023-2033 (US$ Mn, AGR (%), CAGR (%))
Table 105 North America Virtual Power Plant Market by Country, 2023-2033 (US$ Mn, AGR (%), CAGR (%))
Table 106 North America Virtual Power Plant Market by Component, 2023-2033 (US$ Mn, AGR (%), CAGR (%))
Table 107 North America Virtual Power Plant Market by End-User, 2023-2033 (US$ Mn, AGR (%), CAGR (%))
Table 108 North America Virtual Power Plant Market by Information Communication Technology (ICT), 2023-2033 (US$ Mn, AGR (%), CAGR (%))
Table 109 North America Virtual Power Plant Market by Energy Generation Technology, 2023-2033 (US$ Mn, AGR (%), CAGR (%))
Table 110 North America Virtual Power Plant Market by Energy Storage Technology, 2023-2033 (US$ Mn, AGR (%), CAGR (%))
Table 111 Brazil Virtual Power Plant Market by Value, 2023-2033 (US$ Mn, AGR (%), CAGR (%))
Table 112 Mexico Virtual Power Plant Market by Value, 2023-2033 (US$ Mn, AGR (%), CAGR (%))
Table 113 Rest of Latin America Virtual Power Plant Market by Value, 2023-2033 (US$ Mn, AGR (%), CAGR (%))
Table 114 General Electric: Key Details, (CEO, HQ, Revenue, Founded, No. of Employees, Company Type, Website, Business Segment)
Table 115 General Electric: Product Benchmarking
Table 116 General Electric: Strategic Outlook
Table 117 Toshiba Corporation: Key Details, (CEO, HQ, Revenue, Founded, No. of Employees, Company Type, Website, Business Segment)
Table 118 Toshiba Corporation: Product Benchmarking
Table 119 Toshiba Corporation: Strategic Outlook
Table 120 Enel S.P.A:: Key Details, (CEO, HQ, Revenue, Founded, No. of Employees, Company Type, Website, Business Segment)
Table 121 Enel S.P.A: Product Benchmarking
Table 122 Enel S.P.A: Strategic Outlook
Table 123 Schneider Electric SE: Key Details, (CEO, HQ, Revenue, Founded, No. of Employees, Company Type, Website, Business Segment)
Table 124 Schneider Electric SE: Product Benchmarking
Table 125 Schneider Electric SE: Strategic Outlook
Table 126 ABB Ltd: Key Details, (CEO, HQ, Revenue, Founded, No. of Employees, Company Type, Website, Business Segment)
Table 127 ABB Ltd: Product Benchmarking
Table 128 ABB Ltd: Strategic Outlook
Table 129 Hitachi Ltd: Key Details, (CEO, HQ, Revenue, Founded, No. of Employees, Company Type, Website, Business Segment)
Table 130 Hitachi Ltd: Product Benchmarking
Table 131 Hitachi Ltd: Strategic Outlook
Table 132 Siemens AG: Key Details, (CEO, HQ, Revenue, Founded, No. of Employees, Company Type, Website, Business Segment)
Table 133 Siemens AG: Product Benchmarking
Table 134 Siemens AG: Strategic Outlook
Table 135 Robert Bosch GmbH: Key Details, (CEO, HQ, Revenue, Founded, No. of Employees, Company Type, Website, Business Segment)
Table 136 Robert Bosch GmbH: Product Benchmarking
Table 137 Robert Bosch GmbH: Strategic Outlook
Table 138 Blue Pillar: Key Details, (CEO, HQ, Revenue, Founded, No. of Employees, Company Type, Website, Business Segment)
Table 139 Blue Pillar: Product Benchmarking
Table 140 Blue Pillar: Strategic Outlook
Table 141 International Business Machines Corporation: Key Details, (CEO, HQ, Revenue, Founded, No. of Employees, Company Type, Website, Business Segment)
Table 142 International Business Machines Corporation: Product Benchmarking
Table 143 International Business Machines Corporation: Strategic Outlook
Table 144 Cisco Systems, Inc: Key Details, (CEO, HQ, Revenue, Founded, No. of Employees, Company Type, Website, Business Segment)
Table 145 Cisco Systems, Inc: Product Benchmarking
Table 146 Cisco Systems, Inc: Strategic Outlook
Table 147 AGL Energy: Key Details, (CEO, HQ, Revenue, Founded, No. of Employees, Company Type, Website, Business Segment)
Table 148 AGL Energy: Product Benchmarking
Table 149 AGL Energy: Strategic Outlook
Table 150 Enernoc, Inc: Key Details, (CEO, HQ, Revenue, Founded, No. of Employees, Company Type, Website, Business Segment)
Table 151 Enernoc, Inc: Product Benchmarking
Table 152 Enernoc, Inc: Strategic Outlook
Table 153 Next Kraftwerke: Key Details, (CEO, HQ, Revenue, Founded, No. of Employees, Company Type, Website, Business Segment)
Table 154 Next Kraftwerke: Product Benchmarking
Table 155 Next Kraftwerke: Strategic Outlook
Table 156 AutoGrid: Key Details, (CEO, HQ, Revenue, Founded, No. of Employees, Company Type, Website, Business Segment)
Table 157 AutoGrid: Product Benchmarking
Table 158 AutoGrid: Strategic Outlook
図の一覧
Figure 1 Global Virtual Power Plant (VPP) Market Segmentation
Figure 2 Breakdown of Primary Interviews: By Company Type, Designation, & Region
Figure 3 Global Virtual Power Plant (VPP) Market Forecast by Region: Market Attractiveness Index
Figure 4 Global Virtual Power Plant (VPP) Market by Component: Market Attractiveness Index
Figure 5 Global Virtual Power Plant (VPP) Market by End-User: Market Attractiveness Index
Figure 6 Global Virtual Power Plant (VPP) Market by Information Communication Technology: Market Attractiveness Index
Figure 7 Global Virtual Power Plant (VPP) Market by Energy Generation Technology: Market Attractiveness Index
Figure 8 Global Virtual Power Plant (VPP) Market by Energy Storage Technology: Market Attractiveness Index
Figure 9 Global Virtual Power Plant (VPP) Market: Market Dynamics
Figure 10 Global Virtual Power Plant (VPP) Market: Porter’s Five Forces Analysis
Figure 11 Global Virtual Power Plant (VPP) Market: PESTLE Analysis
Figure 12 Global Virtual Power Plant (VPP) Market Forecast by Component 2023, 2033 (Revenue, CAGR%)
Figure 13 Global Virtual Power Plant (VPP) Market Forecast by Component,2023, 2033 (Revenue, CAGR%)
Figure 14 Global Virtual Power Plant Market by Component, 2023-2033 (US$ Mn, AGR (%)
Figure 15 Global Energy Generation Technology Market Forecast, 2023-2033 (US$ Mn, AGR (%))
Figure 16 Global Energy Generation Technology Market by Region, 2023-2033 (US$ Mn, AGR (%))
Figure 17 Global Energy Storage Technologies Market Forecast, 2023-2033 (US$ Mn, AGR (%))
Figure 18 Global Energy Storage Technologies Market by Region, 2023-2033 (US$ Mn, AGR (%))
Figure 19 Global Information Communication Technology (ICT) Market Forecast, 2023-2033 (US$ Mn, AGR (%))
Figure 20 Global Information Communication Technology (ICT) Market by Region, 2023-2033 (US$ Mn, AGR (%))
Figure 21 Global Virtual Power Plant (VPP) Market Forecast by End-User 2023, 2033 (Revenue, CAGR%)
Figure 22 Global Virtual Power Plant (VPP) Market Forecast by Component,2023, 2033 (Revenue, CAGR%)
Figure 23 Global Virtual Power Plant Market by End-User, 2023-2033 (US$ Mn, AGR (%))
Figure 24 Global Industrial VPP Market Forecast, 2023-2033 (US$ Mn, AGR (%))
Figure 25 Global Industrial VPP Market by Region, 2023-2033 (US$ Mn, AGR (%))
Figure 26 Global Commercial VPP Market Forecast, 2023-2033 (US$ Mn, AGR (%))
Figure 27 Global Commercial VPP Market by Region, 2023-2033 (US$ Mn, AGR (%))
Figure 28 Global Residential VPP Market Forecast, 2023-2033 (US$ Mn, AGR (%))
Figure 29 Global Residential VPP Market by Region, 2023-2033 (US$ Mn, AGR (%))
Figure 30 Global Other End-User Market Forecast, 2023-2033 (US$ Mn, AGR (%))
Figure 31 Global Other End-User Market by Region, 2023-2033 (US$ Mn, AGR (%))
Figure 32 Global Virtual Power Plant (VPP) Market Forecast by End-User 2023, 2033 (Revenue, CAGR%)
Figure 33 Global Virtual Power Plant (VPP) Market Forecast by Component,2023, 2033 (Revenue, CAGR%)
Figure 34 Global Virtual Power Plant Market by Information Communication Technology (ICT), 2023-2033 (US$ Mn, AGR (%))
Figure 35 Global Energy Management Systems (EMS) Market Forecast, 2023-2033 (US$ Mn, AGR (%))
Figure 36 Global Energy Management Systems (EMS) Market by Region, 2023-2033 (US$ Mn, AGR (%))
Figure 37 Global Supervisory Control and Data Acquisition (SCADA) Market Forecast, 2023-2033 (US$ Mn, AGR (%))
Figure 38 Global Supervisory Control and Data Acquisition (SCADA) Market by Region, 2023-2033 (US$ Mn, AGR (%))
Figure 39 Global Distribution Management System (DMS) Market Forecast, 2023-2033 (US$ Mn, AGR (%)
Figure 40 Global Distribution Management System (DMS) Market by Region, 2023-2033 (US$ Mn, AGR (%))
Figure 41 Global Smart Meters Market Forecast, 2023-2033 (US$ Mn, AGR (%))
Figure 42 Global Smart Meters Market by Region, 2023-2033 (US$ Mn, AGR (%))
Figure 43 Global Other Information Communication Technology (ICT) Market Forecast, 2023-2033 (US$ Mn, AGR (%))
Figure 44 Global Other Information Communication Technology (ICT) Market by Region, 2023-2033 (US$ Mn, AGR (%))
Figure 45 Global Virtual Power Plant (VPP) Market Forecast by Energy Generation Technology2023, 2033 (Revenue, CAGR%)
Figure 46 Global Virtual Power Plant (VPP) Market Forecast by Energy Generation Technology,2023, 2033 (Revenue, CAGR%)
Figure 47 Global Virtual Power Plant Market by Energy Generation Technology, 2023-2033 (US$ Mn, AGR (%))
Figure 48 Global Wind Based Energy Generation Market Forecast, 2023-2033 (US$ Mn, AGR (%))
Figure 49 Global Wind Based Energy Generation Market by Region, 2023-2033 (US$ Mn, AGR (%))
Figure 50 Global Small Hydro-Plants Market Forecast, 2023-2033 (US$ Mn, AGR (%))
Figure 51 Global Small Hydro-Plants Market by Region, 2023-2033 (US$ Mn, AGR (%))
Figure 52 Global Solar Production Market Forecast, 2023-2033 (US$ Mn, AGR (%))
Figure 53 Global Solar Production Market by Region, 2023-2033 (US$ Mn, AGR (%))
Figure 54 Global Combined Heat and Power (CHP) Market Forecast, 2023-2033 (US$ Mn, AGR (%))
Figure 55 Global Combined Heat and Power (CHP) Market by Region, 2023-2033 (US$ Mn, AGR (%))
Figure 1 Global Small Power Plants Market Forecast, 2023-2033 (US$ Mn, AGR (%), (%))
Figure 56 Global Small Power Plants Market by Region, 2023-2033 (US$ Mn, AGR (%))
Figure 57 Global Other Energy Generation Technology Market Forecast, 2023-2033 (US$ Mn, AGR (%))
Figure 58 Global Other Energy Generation Technology Market by Region, 2023-2033 (US$ Mn, AGR (%))
Figure 59 Global Virtual Power Plant (VPP) Market Forecast by Energy Storage Technology ,2023, 2033 (Revenue, CAGR%)
Figure 60 Global Virtual Power Plant (VPP) Market Forecast by Energy Storage Technology,2023, 2033 (Revenue, CAGR%)
Figure 61 Global Virtual Power Plant Market by Energy Storage Technology, 2023-2033 (US$ Mn, AGR (%))
Figure 62 Global Battery Energy Storage System (BESS) Market Forecast, 2023-2033 (US$ Mn, AGR (%))
Figure 63 Global Battery Energy Storage System (BESS) Market by Region, 2023-2033 (US$ Mn, AGR (%))
Figure 64 Global Supercapacitor Energy Storage (SCES) Market Forecast, 2023-2033 (US$ Mn, AGR (%))
Figure 65 Global Supercapacitor Energy Storage (SCES) Market by Region, 2023-2033 (US$ Mn, AGR (%))
Figure 66 Global Super Conductor Magnetic Energy Storage (SMES) Market Forecast, 2023-2033 (US$ Mn, AGR (%))
Figure 67 Global Super Conductor Magnetic Energy Storage (SMES) Market by Region, 2023-2033 (US$ Mn, AGR (%))
Figure 68 Global Hydraulic Pumped Energy Storage (HPES) Market Forecast, 2023-2033 (US$ Mn, AGR (%))
Figure 69 Global Hydraulic Pumped Energy Storage (HPES) Market by Region, 2023-2033 (US$ Mn, AGR (%))
Figure 70 Global Flywheel Energy Storage (FWES) Market Forecast, 2023-2033 (US$ Mn, AGR (%))
Figure 71 Global Flywheel Energy Storage (FWES) Market by Region, 2023-2033 (US$ Mn, AGR (%))
Figure 72 Global Other Energy Storage Technology Market Forecast, 2023-2033 (US$ Mn, AGR (%))
Figure 73 Global Other Energy Storage Technology Market by Region, 2023-2033 (US$ Mn, AGR (%))
Figure 74 Global Virtual Power Plant Market by Region, 2023-2033 (US$ Mn, AGR (%))
Figure 75 Global Virtual Power Plant Market Forecast, 2023-2033 (US$ Mn, AGR (%)), (V-Shaped Recovery Scenario)
Figure 76 Global Virtual Power Plant Market by Region, 2023-2033 (US$ Mn, AGR (%)) (V-Shaped Recovery Scenario)
Figure 77 Global Virtual Power Plant Market Forecast, 2023-2033 (US$ Mn, AGR (%)) (U-Shaped Recovery Scenario)
Figure 78 Global Virtual Power Plant Market by Region, 2023-2033 (US$ Mn, AGR (%)) (U-Shaped Recovery Scenario)
Figure 79 Global Virtual Power Plant Market Forecast, 2023-2033 (US$ Mn, AGR (%)) (W-Shaped Recovery Scenario)
Figure 80 Global Virtual Power Plant Market by Region, 2023-2033 (US$ Mn, AGR (%)) (W-Shaped Recovery Scenario)
Figure 81 Global Virtual Power Plant Market Forecast, 2023-2033 (US$ Mn, AGR (%)) (L-Shaped Recovery Scenario)
Figure 82 Global Virtual Power Plant Market by Region, 2023-2033 (US$ Mn, AGR (%)) (L-Shaped Recovery Scenario)
Figure 83 North America Virtual Power Plant (VPP) Market Attractiveness Index
Figure 84 North America Virtual Power Plant (VPP) Market Share Forecast 2023, 2033 (%)
Figure 85 North America Virtual Power Plant Market by Country, 2023-2033 (US$ Mn, AGR (%))
Figure 86 North America Virtual Power Plant Market by Component, 2023-2033 (US$ Mn, AGR (%))
Figure 87 North America Virtual Power Plant Market Share Forecast by Component, 2023 & 2033 (%)
Figure 88 North America Virtual Power Plant Market by End-User, 2023-2033 (US$ Mn, AGR (%))
Figure 89 North America Virtual Power Plant Market Share Forecast by End-User, 2023 & 2033 (%)
Figure 90 North America Virtual Power Plant Market by Information Communication Technology (ICT), 2023-2033 (US$ Mn, AGR (%))
Figure 91 North America Virtual Power Plant Market Share Forecast Information Communication Technology (ICT),2023 & 2033 (%)
Figure 92 North America Virtual Power Plant Market by Energy Generation Technology, 2023-2033 (US$ Mn, AGR (%))
Figure 93 North America Virtual Power Plant Market Share Forecast Energy Generation Technology ,2023 & 2033 (%)
Figure 94 North America Virtual Power Plant Market by Energy Storage Technology, 2023-2033 (US$ Mn, AGR (%))
Figure 95 North America Virtual Power Plant Market Share Forecast Energy Storage Technology ,2023 & 2033 (%)
Figure 96 US Virtual Power Plant Market by Value, 2023-2033 (US$ Mn, AGR (%))
Figure 97 Canada Virtual Power Plant Market by Value, 2023-2033 (US$ Mn, AGR (%))
Figure 98 Europe Virtual Power Plant (VPP) Market Attractiveness Index
Figure 99 Europe Virtual Power Plant (VPP) Market Share Forecast 2023, 2033 (%)
Figure 100 Europe Virtual Power Plant Market by Country, 2023-2033 (US$ Mn, AGR (%))
Figure 101 Europe Virtual Power Plant Market by Component, 2023-2033 (US$ Mn, AGR (%))
Figure 102 Europe Virtual Power Plant Market Share Forecast by Component, 2023 & 2033 (%)
Figure 103 Europe Virtual Power Plant Market by End-User, 2023-2033 (US$ Mn, AGR (%))
Figure 104 Europe Virtual Power Plant Market Share Forecast by End-User, 2023 & 2033 (%)
Figure 105 Europe Virtual Power Plant Market by Information Communication Technology (ICT), 2023-2033 (US$ Mn, AGR (%))
Figure 106 Europe Virtual Power Plant Market Share Forecast Information Communication Technology (ICT),2023 & 2033 (%)
Figure 107 Europe Virtual Power Plant Market by Energy Generation Technology, 2023-2033 (US$ Mn, AGR (%))
Figure 108 Europe Virtual Power Plant Market Share Forecast Energy Generation Technology ,2023 & 2033 (%)
Figure 109 Europe Virtual Power Plant Market by Energy Storage Technology, 2023-2033 (US$ Mn, AGR (%))
Figure 110 Europe Virtual Power Plant Market Share Forecast Energy Storage Technology ,2023 & 2033 (%)
Figure 111 Germany Virtual Power Plant Market by Value, 2023-2033 (US$ Mn, AGR (%))
Figure 112 UK Virtual Power Plant Market by Value, 2023-2033 (US$ Mn, AGR (%))
Figure 113 France Virtual Power Plant Market by Value, 2023-2033 (US$ Mn, AGR (%))
Figure 114 Italy Virtual Power Plant Market by Value, 2023-2033 (US$ Mn, AGR (%))
Figure 115 Spain Virtual Power Plant Market by Value, 2023-2033 (US$ Mn, AGR (%))
Figure 116 Rest of Europe Virtual Power Plant Market by Value, 2023-2033 (US$ Mn, AGR (%))
Figure 117 Asia-Pacific Virtual Power Plant (VPP) Market Attractiveness Index
Figure 118 Asia-Pacific Virtual Power Plant (VPP) Market Share Forecast 2023, 2033 (%)
Figure 119 Asia-Pacific Virtual Power Plant Market by Country, 2023-2033 (US$ Mn, AGR (%))
Figure 120 Asia-Pacific Virtual Power Plant Market by Component, 2023-2033 (US$ Mn, AGR (%))
Figure 121 Asia-Pacific Virtual Power Plant Market Share Forecast by Component, 2023 & 2033 (%)
Figure 122 Asia-Pacific Virtual Power Plant Market by End-User, 2023-2033 (US$ Mn, AGR (%))
Figure 123 Asia-Pacific Virtual Power Plant Market Share Forecast by End-User, 2023 & 2033 (%)
Figure 124 Asia-Pacific Virtual Power Plant Market by Information Communication Technology (ICT), 2023-2033 (US$ Mn, AGR (%))
Figure 125 Asia-Pacific Virtual Power Plant Market Share Forecast Information Communication Technology (ICT),2023 & 2033 (%)
Figure 126 Asia-Pacific Virtual Power Plant Market by Energy Generation Technology, 2023-2033 (US$ Mn, AGR (%))
Figure 127 Asia-Pacific Virtual Power Plant Market Share Forecast Energy Generation Technology ,2023 & 2033 (%)
Figure 128 Asia-Pacific Virtual Power Plant Market by Energy Storage Technology, 2023-2033 (US$ Mn, AGR (%))
Figure 129 Asia-Pacific Virtual Power Plant Market Share Forecast Energy Storage Technology ,2023 & 2033 (%)
Figure 130 China Virtual Power Plant Market by Value, 2023-2033 (US$ Mn, AGR (%))
Figure 131 India Virtual Power Plant Market by Value, 2023-2033 (US$ Mn, AGR (%))
Figure 132 Japan Virtual Power Plant Market by Value, 2023-2033 (US$ Mn, AGR (%))
Figure 133 South Korea Virtual Power Plant Market by Value, 2023-2033 (US$ Mn, AGR (%))
Figure 134 Australia Virtual Power Plant Market by Value, 2023-2033 (US$ Mn, AGR (%))
Figure 135 Rest of Asia-Pacific Virtual Power Plant Market by Value, 2023-2033 (US$ Mn, AGR (%))
Figure 136 Middle East & Africa Virtual Power Plant (VPP) Market Attractiveness Index
Figure 137 Middle East & Africa Virtual Power Plant (VPP) Market Share Forecast 2023, 2033 (%)
Figure 138 Middle East & Africa Virtual Power Plant Market by Country, 2023-2033 (US$ Mn, AGR (%))
Figure 139 Middle East & Africa Virtual Power Plant Market by Component, 2023-2033 (US$ Mn, AGR (%))
Figure 140 Middle East & Africa Virtual Power Plant Market Share Forecast by Component, 2023 & 2033 (%)
Figure 141 Middle East & Africa Virtual Power Plant Market by End-User, 2023-2033 (US$ Mn, AGR (%))
Figure 142 Middle East & Africa Virtual Power Plant Market Share Forecast by End-User, 2023 & 2033 (%)
Figure 143 Middle East & Africa Virtual Power Plant Market by Information Communication Technology (ICT), 2023-2033 (US$ Mn, AGR (%))
Figure 144 Middle East & Africa Virtual Power Plant Market Share Forecast Information Communication Technology (ICT),2023 & 2033 (%)
Figure 145 Middle East & Africa Virtual Power Plant Market by Energy Generation Technology, 2023-2033 (US$ Mn, AGR (%))
Figure 146 Middle East & Africa Virtual Power Plant Market Share Forecast Energy Generation Technology ,2023 & 2033 (%)
Figure 147 Middle East & Africa Virtual Power Plant Market by Energy Storage Technology, 2023-2033 (US$ Mn, AGR (%))
Figure 148 Middle East & Africa Virtual Power Plant Market Share Forecast Energy Storage Technology ,2023 & 2033 (%)
Figure 149 GCC Virtual Power Plant Market by Value, 2023-2033 (US$ Mn, AGR (%))
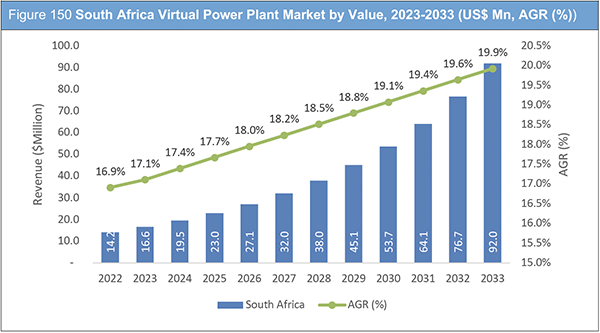
Figure 150 South Africa Virtual Power Plant Market by Value, 2023-2033 (US$ Mn, AGR (%))
Figure 151 Rest of Middle East & Africa Virtual Power Plant Market by Value, 2023-2033 (US$ Mn, AGR (%))
Figure 152 Latin America Virtual Power Plant (VPP) Market Attractiveness Index
Figure 153 Latin America Virtual Power Plant (VPP) Market Share Forecast 2023, 2033 (%)
Figure 154 North America Virtual Power Plant Market by Country, 2023-2033 (US$ Mn, AGR (%))
Figure 155 North America Virtual Power Plant Market by Component, 2023-2033 (US$ Mn, AGR (%))
Figure 156 Latin America Virtual Power Plant Market Share Forecast by Component, 2023 & 2033 (%)
Figure 157 North America Virtual Power Plant Market by End-User, 2023-2033 (US$ Mn, AGR (%))
Figure 158 Latin America Virtual Power Plant Market Share Forecast by End-User, 2023 & 2033 (%)
Figure 159 North America Virtual Power Plant Market by Information Communication Technology (ICT), 2023-2033 (US$ Mn, AGR (%))
Figure 160 Latin America Virtual Power Plant Market Share Forecast Information Communication Technology (ICT),2023 & 2033 (%)
Figure 161 North America Virtual Power Plant Market by Energy Generation Technology, 2023-2033 (US$ Mn, AGR (%))
Figure 162 Latin America Virtual Power Plant Market Share Forecast Energy Generation Technology ,2023 & 2033 (%)
Figure 163 North America Virtual Power Plant Market by Energy Storage Technology, 2023-2033 (US$ Mn, AGR (%))
Figure 164 Latin America Virtual Power Plant Market Share Forecast Energy Storage Technology ,2023 & 2033 (%)
Figure 165 Brazil Virtual Power Plant Market by Value, 2023-2033 (US$ Mn, AGR (%))
Figure 166 Mexico Virtual Power Plant Market by Value, 2023-2033 (US$ Mn, AGR (%))
Figure 167 Rest of Latin America Virtual Power Plant Market by Value, 2023-2033 (US$ Mn, AGR (%))
Figure 168 General Electric: Net Revenue, 2017-2021 (US$ million, AGR%)
Figure 169 General Electric: Gross Profit, 2017-2021 (US$ million, AGR%)
Figure 170 General Electric: Operational Income, 2017-2021 (US$ million, AGR%)
Figure 171 General Electric: EBITDA, 2017-2021 (US$ million, AGR%)
Figure 172 Toshiba Corporation: Net Revenue, 2017-2021 (US$ million, AGR%)
Figure 173 Toshiba Corporation: Gross Profit, 2017-2021 (US$ million, AGR%)
Figure 174 Toshiba Corporation: Operational Income, 2017-2021 (US$ million, AGR%)
Figure 175 Toshiba Corporation: EBITDA, 2017-2021 (US$ million, AGR%)
Figure 176 Schneider Electric SE: Net Revenue, 2017-2021 (US$ million, AGR%)
Figure 177 Schneider Electric SE: Gross Profit, 2017-2021 (US$ million, AGR%)
Figure 178 Schneider Electric SE: Operational Income, 2017-2021 (US$ million, AGR%)
Figure 179 Schneider Electric SE: EBITDA, 2017-2021 (US$ million, AGR%)
Figure 180 ABB Ltd: Net Revenue, 2017-2021 (US$ million, AGR%)
Figure 181 ABB Ltd: Gross Profit, 2017-2021 (US$ million, AGR%)
Figure 182 ABB Ltd: Operational Income, 2017-2021 (US$ million, AGR%)
Figure 183 ABB Ltd: EBITDA, 2017-2021 (US$ million, AGR%)
Figure 184 Hitachi Ltd: Net Revenue, 2017-2021 (US$ million, AGR%)
Figure 185 Hitachi Ltd: Gross Profit, 2017-2021 (US$ million, AGR%)
Figure 186 Hitachi Ltd: Operational Income, 2017-2021 (US$ million, AGR%)
Figure 187 Hitachi Ltd: EBITDA, 2017-2021 (US$ million, AGR%)
Figure 188 Siemens AG: Net Revenue, 2017-2021 (US$ million, AGR%)
Figure 189 Siemens AG: Gross Profit, 2017-2021 (US$ million, AGR%)
Figure 190 Siemens AG: Operational Income, 2017-2021 (US$ million, AGR%)
Figure 191 Siemens AG: EBITDA, 2017-2021 (US$ million, AGR%)
Figure 192 International Business Machines Corporation: Net Revenue, 2017-2021 (US$ million, AGR%)
Figure 193 International Business Machines Corporation: Gross Profit, 2017-2021 (US$ million, AGR%)
Figure 194 International Business Machines Corporation: Operational Income, 2017-2021 (US$ million, AGR%)
Figure 195 International Business Machines Corporation: EBITDA, 2017-2021 (US$ million, AGR%)
Figure 196 Cisco Systems, Inc: Net Revenue, 2017-2021 (US$ million, AGR%)
Figure 197 Cisco Systems, Inc: Gross Profit, 2017-2021 (US$ million, AGR%)
Figure 198 Cisco Systems, Inc: Operational Income, 2017-2021 (US$ million, AGR%)
Figure 199 Cisco Systems, Inc: EBITDA, 2017-2021 (US$ million, AGR%)
ページTOPに戻る
Summary
Report Details
The Virtual Power Plant (VPP) Market Report 2023-2033: This report will prove invaluable to leading firms striving for new revenue pockets if they wish to better understand the industry and its underlying dynamics. It will be useful for companies that would like to expand into different industries or to expand their existing operations in a new region.
Virtual Power Plants are Gaining Importance in the Power Distribution Sector
Electricity supply and demand must be matched, and any imbalance between them can disrupt the frequency and affect power quality, causing power outages and other problems. In the past, power companies adjusted supply by controlling thermal and hydroelectric power generation based on precise calculations. However, as renewable energies such as solar and wind power generation, which are difficult to control, become the main source of power, the challenge is to secure the capability to adjust these sources. With this background, virtual power plants (VPPs) are attracting attention. The VPP bundles and remotely controls distributed power resources such as solar power generation facilities, storage batteries, and electric vehicles owned by consumers. VPPs are also expected to further enhance disaster resilience.
VPPs connect large storage batteries via a network to not only renewable energy sources such as solar and wind power generation, but also distributed energy resources such as private power generation facilities of consumers in buildings and factories, as well as fuel cells, and aggregate, control, and remotely integrate and manage them using IoT. Energy supply and demand optimization technology stabilises the power of the entire network and controls surpluses, allowing the system to function as a power plant, supplying power to other consumers and the network in an emergency.
What Questions Should You Ask before Buying a Market Research Report?
• How is the virtual power plant (VPP) market evolving?
• What is driving and restraining the virtual power plant (VPP) market?
• How will each virtual power plant (VPP) submarket segment grow over the forecast period and how much revenue will these submarkets account for in 2033?
• How will the market shares for each virtual power plant (VPP) submarket develop from 2023 to 2033?
• What will be the main driver for the overall market from 2023 to 2033?
• Will leading virtual power plant (VPP) markets broadly follow the macroeconomic dynamics, or will individual national markets outperform others?
• How will the market shares of the national markets change by 2033 and which geographical region will lead the market in 2033?
• Who are the leading players and what are their prospects over the forecast period?
• What are the virtual power plant (VPP) projects for these leading companies?
• How will the industry evolve during the period between 2023 and 2033? What are the implications of virtual power plant (VPP) projects taking place now and over the next 10 years?
• Is there a greater need for product commercialisation to further scale the virtual power plant (VPP) market?
• Where is the virtual power plant (VPP) market heading and how can you ensure you are at the forefront of the market?
• What are the best investment options for new product and service lines?
• What are the key prospects for moving companies into a new growth path and C-suite?
You need to discover how this will impact the virtual power plant (VPP) market today, and over the next 10 years:
• Our 347-page report provides 158 tables and 199 charts/graphs exclusively to you.
• The report highlights key lucrative areas in the industry so you can target them – NOW.
• It contains in-depth analysis of global, regional and national sales and growth.
• It highlights for you the key successful trends, changes and revenue projections made by your competitors.
This report tells you TODAY how the virtual power plant (VPP) market will develop in the next 10 years, and in line with the variations in COVID-19 economic recession and bounce. This market is more critical now than at any point over the last 10 years.
Forecasts to 2033 and other analyses reveal commercial prospects
• In addition to revenue forecasting to 2033, our new study provides you with recent results, growth rates, and market shares.
• You will find original analyses, with business outlooks and developments.
• Discover qualitative analyses (including market dynamics, drivers, opportunities, restraints and challenges), cost structure, impact of rising virtual power plant (VPP) prices and recent developments.
This report includes data analysis and invaluable insight into how COVID-19 will affect the industry and your company. Four COVID-19 recovery patterns and their impact, namely, “V”, “L”, “W” and “U” are discussed in this report.
Segments Covered in the Report
Market Segment by Component
• Energy Generation Technology
• Energy Storage Technologies
• Information Communication Technology (ICT)
Market Segment by End-User
• Industrial VPP
• Commercial VPP
• Residential VPP
• Other End-User
Market Segment by Information Communication Technology (ICT)
• Energy Management Systems (EMS)
• Supervisory Control and Data Acquisition (SCADA)
• Distribution Management System (DMS)
• Smart Meters
• Other Information Communication Technology (ICT)
Market Segment by Energy Generation Technology
• Wind Based Energy Generation
• Small Hydro-Plants
• Solar Production
• Combined Heat and Power (CHP)
• Small Power Plants
• Other Energy Generation Technology
Market Segment by Energy Generation Technology
• Battery Energy Storage System (BESS)
• Supercapacitor Energy Storage (SCES)
• Super Conductor Magnetic Energy Storage (SMES)
• Hydraulic Pumped Energy Storage (HPES)
• Flywheel Energy Storage (FWES)
• Other Energy Storage Technology
In addition to the revenue predictions for the overall world market and segments, you will also find revenue forecasts for four regional and 20 leading national markets:
North America
• U.S.
• Canada
Europe
• Germany
• Spain
• United Kingdom
• France
• Italy
• Rest of Europe
Asia Pacific
• China
• Japan
• India
• Australia
• South Korea
• Rest of Asia Pacific
Middle East & Africa
• GCC
• South Africa
• Rest of Middle East & Africa
Latin America
• Brazil
• Mexico
• Rest of Latin America
The report also includes profiles and for some of the leading companies in the Virtual Power Plant (VPP) Market, 2023 to 2033, with a focus on this segment of these companies’ operations.
Leading companies and the potential for market growth
• ABB Ltd.
• AGL Energy Ltd
• AutoGrid
• Blue Pillar
• Cisco Systems, Inc.
• Enel S.P.A
• Enernoc, Inc.
• General Electric Company
• Hitachi, Ltd.
• International Business Machines Corporation
• Next Kraftwerke
• Robert Bosch GmbH
• Schneider Electric SE
• Siemens AG
• Toshiba Corporation
Overall world revenue for Virtual Power Plant (VPP) Market, 2023 to 2033 in terms of value the market will surpass US$520.7 million in 2023, our work calculates. We predict strong revenue growth through to 2033. Our work identifies which organizations hold the greatest potential. Discover their capabilities, progress, and commercial prospects, helping you stay ahead.
How will the Virtual Power Plant (VPP) Market, 2023 to 2033 report help you?
In summary, our 340+ page report provides you with the following knowledge:
• Revenue forecasts to 2033 for Virtual Power Plant (VPP) Market, 2023 to 2033 Market, with forecasts for component, end-user, Information communication technology (ICT), energy generation technology, energy generation technology and company size, each forecast at a global and regional level – discover the industry’s prospects, finding the most lucrative places for investments and revenues.
• Revenue forecasts to 2033 for four regional and 20 key national markets – See forecasts for the Virtual Power Plant (VPP) Market, 2023 to 2033 market in North America, Europe, Asia-Pacific, Latin America and Middle East & Africa. Also forecasted is the market in the US, Canada, Mexico, Brazil, Germany, France, UK, Italy, China, India, Japan, and Australia among other prominent economies.
• Prospects for established firms and those seeking to enter the market – including company profiles for 15 of the major companies involved in the Virtual Power Plant (VPP) Market, 2023 to 2033.
Find quantitative and qualitative analyses with independent predictions. Receive information that only our report contains, staying informed with invaluable business intelligence.
Information found nowhere else
With our new report, you are less likely to fall behind in knowledge or miss out on opportunities. See how our work could benefit your research, analyses, and decisions. Visiongain’s study is for everybody needing commercial analyses for the Virtual Power Plant (VPP) Market, 2023 to 2033, market-leading companies. You will find data, trends and predictions.
ページTOPに戻る
Table of Contents
Table of Contents
1. Report Overview
1.1 Objectives of the Study
1.2 Introduction to Virtual Power Plant (VPP) Market
1.3 What This Report Delivers
1.4 Why You Should Read This Report
1.5 Key Questions Answered by this Analytical Report Include:
1.6 Who is This Report For?
1.7 Methodology
1.7.1 Market Definitions
1.7.2 Market Evaluation & Forecasting Methodology
1.7.3 Data Validation
1.8 Frequently Asked Questions (FAQs)
1.9 Associated Visiongain Reports
1.10 About Visiongain
2 Executive Summary
3 Premium Insights
3.1 Geographical Snapshot: Global Virtual Power Plant (VPP) Market
3.2 Component Segment: Market Attractiveness Index
3.3 End-User Segment: Market Attractiveness Index
3.4 Information Communication Technology: Market Attractiveness Index
3.5 Energy Generation Technology: Market Attractiveness Index
3.6 Energy Storage Technology: Market Attractiveness Index
4 Market Overview
4.1 Key Findings
4.2 Market Dynamics
4.2.1 Market Driving Factors
4.2.2 Market Restraining Factors
4.2.3 Market Opportunities
4.3 Porter’s Five Forces Analysis
4.3.1 Bargaining Power of Suppliers
4.3.2 Bargaining Power of Buyers
4.3.3 Competitive Rivalry
4.3.4 Threat from Substitutes
4.3.5 Threat of New Entrants
4.4 PESTLE Analysis
4.4.1 Political Factors
4.4.2 Economic Factors
4.4.3 Social Factors
4.4.4 Technology Factors
5 Global Virtual Power Plant (VPP) Market Analysis by Component
5.1 Key Findings
5.2 Global Virtual Power Plant (VPP) Market Attractiveness Index by Component
5.2.1 Global Virtual Power Plant (VPP) Market Attractiveness Index by Component
5.2.2 Global Virtual Power Plant (VPP) Market Size Estimation and Forecast by Component
5.3 Energy Generation Technology
5.4 Global Energy Generation Technology Market Size Estimation Forecast, 2023-2033 (US$ Mn)
Source: Visiongain Reports Ltd., 2023
5.4.1 Global Energy Generation Technology Market Size Estimation Forecast by Region, 2023-2033 (US$ Mn)
5.5 Energy Storage Technology
5.5.1 Global Energy Storage Technology Market Size Estimation Forecast, 2023-2033 (US$ Mn)
5.5.2 Global Energy Storage Technologies Market Forecast by Region, 2023-2033 (US$ Mn)
5.6 Information Communication Technology (ICT)
5.6.1 Global Information Communication Technology (ICT) Market Size Estimation Forecast, 2023-2033 (US$ Mn)
5.6.2 Global Information Communication Technology (ICT) Market Forecast by Region, 2023-2033 (US$ Mn)
6 Global Virtual Power Plant (VPP) Market Analysis by End-User
6.1 Key Findings
6.2 Global Virtual Power Plant (VPP) Market Attractiveness Index by End-User
6.2.1 Global Virtual Power Plant (VPP) Market Attractiveness Index by End-User
6.2.2 Global Virtual Power Plant (VPP) Market Size Estimation and Forecast by End-User
6.3 Industrial VPP
6.4 Global Industrial VPP Market Size Estimation Forecast, 2023-2033 (US$ Mn)
Source: Visiongain Reports Ltd., 2023
6.4.1 Global Industrial VPP Market Size Estimation Forecast by Region, 2023-2033 (US$ Mn)
6.5 Commercial VPP
6.5.1 Global Commercial VPP Market Size Estimation Forecast, 2023-2033 (US$ Mn)
6.5.2 Global Commercial VPP Market Forecast by Region, 2023-2033 (US$ Mn)
6.6 Residential VPP
6.6.1 Global Residential VPP Market Size Estimation Forecast, 2023-2033 (US$ Mn)
6.6.2 Global Residential VPP Market Forecast by Region, 2023-2033 (US$ Mn)
6.7 Other End-User
6.7.1 Global Other End-User Market Size Estimation Forecast, 2023-2033 (US$ Mn)
6.7.2 Global Other End-User Market Forecast by Region, 2023-2033 (US$ Mn)
7 Global Virtual Power Plant (VPP) Market Analysis by Information Communication Technology
7.1 Key Findings
7.2 Global Virtual Power Plant (VPP) Market Attractiveness Index by Information Communication Technology
7.2.1 Global Virtual Power Plant (VPP) Market Attractiveness Index by End-User
7.2.2 Global Virtual Power Plant (VPP) Market Size Estimation and Forecast by Information Communication Technology
7.3 Energy Management Systems (EMS)
7.4 Global Energy Management Systems (EMS) Market Size Estimation Forecast, 2023-2033 (US$ Mn)
Source: Visiongain Reports Ltd., 2023
7.4.1 Global Energy Management Systems (EMS) Market Size Estimation Forecast by Region, 2023-2033 (US$ Mn)
7.5 Supervisory Control and Data Acquisition (SCADA)
7.5.1 Global Supervisory Control and Data Acquisition (SCADA) Market Size Estimation Forecast, 2023-2033 (US$ Mn)
7.5.2 Global Supervisory Control and Data Acquisition (SCADA) Market Forecast by Region, 2023-2033 (US$ Mn)
7.6 Distribution Management System (DMS)
7.6.1 Global Distribution Management System (DMS) Market Size Estimation Forecast, 2023-2033 (US$ Mn)
7.6.2 Global Distribution Management System (DMS) Market Forecast by Region, 2023-2033 (US$ Mn)
7.7 Smart Meters
7.7.1 Global Smart Meter Market Size Estimation Forecast, 2023-2033 (US$ Mn)
7.7.2 Global Smart Meters Market Forecast by Region, 2023-2033 (US$ Mn)
7.8 Other Information Communication Technology (ICT)
7.8.1 Global Other Information Communication Technology (ICT) Market Size Estimation Forecast, 2023-2033 (US$ Mn)
7.8.2 Global Other Information Communication Technology (ICT) Market Forecast by Region, 2023-2033 (US$ Mn)
8 Global Virtual Power Plant (VPP) Market Analysis by Energy Generation Technology
8.1 Key Findings
8.2 Global Virtual Power Plant (VPP) Market Attractiveness Index by Energy Generation Technology
8.1.1 Global Virtual Power Plant (VPP) Market Attractiveness Index by Energy Generation Technology
8.1.2 Global Virtual Power Plant (VPP) Market Size Estimation and Forecast by Energy Generation Technology
8.2 Wind Based Energy Generation
8.3 Global Wind Based Energy Generation Market Size Estimation Forecast, 2023-2033 (US$ Mn)
Source: Visiongain Reports Ltd., 2023
8.3.1 Global Energy Management Systems (EMS) Market Size Estimation Forecast by Region, 2023-2033 (US$ Mn)
8.4 Small Hydro-Plants
8.4.1 Global Small Hydro-Plant Market Size Estimation Forecast, 2023-2033 (US$ Mn)
8.4.2 Global Small Hydro-Plants Market Forecast by Region, 2023-2033 (US$ Mn)
8.5 Solar Production
8.5.1 Global Solar Production Market Size Estimation Forecast, 2023-2033 (US$ Mn)
8.5.2 Global Solar Production Market Forecast by Region, 2023-2033 (US$ Mn)
8.6 Combined Heat and Power (CHP)
8.6.1 Global Combined Heat and Power (CHP) Market Size Estimation Forecast, 2023-2033 (US$ Mn)
8.6.2 Global Combined Heat and Power (CHP) Market Forecast by Region, 2023-2033 (US$ Mn)
8.7 Small Power Plants
8.7.1 Global Small Power Plants Market Size Estimation Forecast, 2023-2033 (US$ Mn)
8.7.2 Global Small Power Plants Market Forecast by Region, 2023-2033 (US$ Mn)
8.8 Other Energy Generation Technology
8.8.1 Global Other Energy Generation Technology Market Size Estimation Forecast, 2023-2033 (US$ Mn)
8.8.2 Global Other Energy Generation Technology Market Forecast by Region, 2023-2033 (US$ Mn)
9 Global Virtual Power Plant (VPP) Market Analysis by Energy Storage Technology
9.1 Key Findings
9.2 Global Virtual Power Plant (VPP) Market Attractiveness Index by Energy Storage Technology
9.1.1 Global Virtual Power Plant (VPP) Market Attractiveness Index by Energy Generation Technology
9.1.2 Global Virtual Power Plant (VPP) Market Size Estimation and Forecast by Energy Storage Technology
9.2 Battery Energy Storage System (BESS)
9.3 Global Battery Energy Storage System (BESS) Market Size Estimation Forecast, 2023-2033 (US$ Mn)
Source: Visiongain Reports Ltd., 2023
9.3.1 Global Battery Energy Storage System (BESS) Market Size Estimation Forecast by Region, 2023-2033 (US$ Mn)
9.4 Supercapacitor Energy Storage (SCES)
9.4.1 Global Supercapacitor Energy Storage (SCES) Market Size Estimation Forecast, 2023-2033 (US$ Mn)
9.4.2 Global Supercapacitor Energy Storage (SCES) Market Forecast by Region, 2023-2033 (US$ Mn)
9.5 Super Conductor Magnetic Energy Storage (SMES)
9.5.1 Global Super Conductor Magnetic Energy Storage (SMES) Market Size Estimation Forecast, 2023-2033 (US$ Mn)
9.5.2 Global Super Conductor Magnetic Energy Storage (SMES) Market Forecast by Region, 2023-2033 (US$ Mn)
9.6 Hydraulic Pumped Energy Storage (HPES)
9.6.1 Global Hydraulic Pumped Energy Storage (HPES) Market Size Estimation Forecast, 2023-2033 (US$ Mn)
9.6.2 Global Hydraulic Pumped Energy Storage (HPES) Market Forecast by Region, 2023-2033 (US$ Mn)
9.7 Flywheel Energy Storage (FWES)
9.7.1 Global Flywheel Energy Storage (FWES) Market Size Estimation Forecast, 2023-2033 (US$ Mn)
9.7.2 Global Flywheel Energy Storage (FWES) Market Forecast by Region, 2023-2033 (US$ Mn)
9.8 Other Energy Storage Technology
9.8.1 Global Other Energy Storage Technology Market Size Estimation Forecast, 2023-2033 (US$ Mn)
9.8.2 Global Other Energy Storage Technology Market Forecast by Region, 2023-2033 (US$ Mn)
10 Global Virtual Power Plant (VPP) Market Analysis by Region
10.1 Key Findings
10.2 Regional Market Size Estimation and Forecast
10.3 COVID-19 Impact Analysis: Recovery Scenarios (V, U, W, L)
11 North America Virtual Power Plant (VPP) Market Analysis
11.1 Key Findings
11.1.1 North America Virtual Power Plant (VPP) Market Attractiveness Index
11.1.2 North America Virtual Power Plant (VPP) Market Share by Region, 2023 & 2033
11.2 North America Virtual Power Plant (VPP) Market Size Estimation and Forecast by Country
11.3 North America Virtual Power Plant (VPP) Market Size Estimation and Forecast by Component
11.4 North America Virtual Power Plant (VPP) Market Size Estimation and Forecast by End-User
11.5 North America Virtual Power Plant (VPP) Market Size Estimation and Forecast by Information Communication Technology (ICT)
11.6 North America Virtual Power Plant (VPP) Market Size Estimation and Forecast by Energy Generation Technology
11.7 North America Virtual Power Plant (VPP) Market Size Estimation and Forecast by Energy Storage Technology
11.8 U.S. Market Analysis
11.9 Canada Market Analysis
12 Europe Virtual Power Plant (VPP) Market Analysis
12.1 Key Findings
12.1.1 Europe Virtual Power Plant (VPP) Market Attractiveness Index
12.1.2 Europe Virtual Power Plant (VPP) Market Share by Region, 2023 & 2033
12.2 Europe Virtual Power Plant (VPP) Market Size Estimation and Forecast by Country
12.3 Europe Virtual Power Plant (VPP) Market Size Estimation and Forecast by Component
12.4 Europe Virtual Power Plant (VPP) Market Size Estimation and Forecast by End-User
12.5 Europe Virtual Power Plant (VPP) Market Size Estimation and Forecast by Information Communication Technology (ICT)
12.6 Europe Virtual Power Plant (VPP) Market Size Estimation and Forecast by Energy Generation Technology
12.7 Europe Virtual Power Plant (VPP) Market Size Estimation and Forecast by Energy Storage Technology
12.8 Germany Market Analysis
12.9 UK Market Analysis
12.10 France Market Analysis
12.11 Italy Market Analysis
12.12 Spain Market Analysis
12.13 Rest of Europe Market Analysis
13 Asia-Pacific Virtual Power Plant (VPP) Market Analysis
13.1 Key Findings
13.1.1 Asia-Pacific Virtual Power Plant (VPP) Market Attractiveness Index
13.1.2 Asia-Pacific Virtual Power Plant (VPP) Market Share by Region, 2023 & 2033
13.2 Asia-Pacific Virtual Power Plant (VPP) Market Size Estimation and Forecast by Country
13.3 Asia-Pacific Virtual Power Plant (VPP) Market Size Estimation and Forecast by Component
13.4 Asia-Pacific Virtual Power Plant (VPP) Market Size Estimation and Forecast by End-User
13.5 Asia-Pacific Virtual Power Plant (VPP) Market Size Estimation and Forecast by Information Communication Technology (ICT)
13.6 Asia-Pacific Virtual Power Plant (VPP) Market Size Estimation and Forecast by Energy Generation Technology
13.7 Asia-Pacific Virtual Power Plant (VPP) Market Size Estimation and Forecast by Energy Storage Technology
13.8 China Market Analysis
13.9 India Market Analysis
13.10 Japan Market Analysis
13.11 South Korea Market Analysis
13.12 Australia Market Analysis
13.13 Rest of Asia-Pacific Market Analysis
14 Middle East & Africa Virtual Power Plant (VPP) Market Analysis
14.1 Key Findings
14.1.1 Middle East & Africa Virtual Power Plant (VPP) Market Attractiveness Index
14.1.2 Middle East & Africa Virtual Power Plant (VPP) Market Share by Region, 2023 & 2033
14.2 Middle East & Africa Virtual Power Plant (VPP) Market Size Estimation and Forecast by Country
14.3 Middle East & Africa Virtual Power Plant (VPP) Market Size Estimation and Forecast by Component
14.4 Middle East & Africa Virtual Power Plant (VPP) Market Size Estimation and Forecast by End-User
14.5 Middle East & Africa Virtual Power Plant (VPP) Market Size Estimation and Forecast by Information Communication Technology (ICT)
14.6 Middle East & Africa Virtual Power Plant (VPP) Market Size Estimation and Forecast by Energy Generation Technology
14.7 Middle East & Africa Virtual Power Plant (VPP) Market Size Estimation and Forecast by Energy Storage Technology
14.8 GCC Market Analysis
14.9 South Africa Market Analysis
14.10 Rest of Middle East & Africa Market Analysis
15 Latin America Virtual Power Plant (VPP) Market Analysis
15.1 Key Findings
15.1.1 Latin America Virtual Power Plant (VPP) Market Attractiveness Index
15.1.2 Latin America Virtual Power Plant (VPP) Market Share by Region, 2023 & 2033
15.2 Latin America Virtual Power Plant (VPP) Market Size Estimation and Forecast by Country
15.3 Latin America Virtual Power Plant (VPP) Market Size Estimation and Forecast by Component
15.4 Latin America Virtual Power Plant (VPP) Market Size Estimation and Forecast by End-User
15.5 Latin America Virtual Power Plant (VPP) Market Size Estimation and Forecast by Information Communication Technology (ICT)
15.6 Latin America Virtual Power Plant (VPP) Market Size Estimation and Forecast by Energy Generation Technology
15.7 Latin America Virtual Power Plant (VPP) Market Size Estimation and Forecast by Energy Storage Technology
15.8 Brazil Market Analysis
15.9 Mexico Market Analysis
15.10 Rest of Latin America Market Analysis
16 Company Profiles
16.1 General Electric Company
16.1.1 Company Snapshot
16.1.2 Company Overview
16.1.3 Financial Analysis
16.1.4 Product Benchmarking
16.1.5 Strategic Outlook
16.2 Toshiba Corporation
16.2.1 Company Snapshot
16.2.2 Company Overview
16.2.3 Financial Analysis
16.2.4 Product Benchmarking
16.2.5 Strategic Outlook
16.3 Enel S.P.A
16.3.1 Company Snapshot
16.3.2 Company Overview
16.3.3 Product Benchmarking
16.3.4 Strategic Outlook
16.4 Schneider Electric SE
16.4.1 Company Snapshot
16.4.2 Company Overview
16.4.3 Financial Analysis
16.4.4 Product Benchmarking
16.4.5 Strategic Outlook
16.5 ABB Ltd.
16.5.1 Company Snapshot
16.5.2 Company Overview
16.5.3 Financial Analysis
16.5.4 Product Benchmarking
16.5.5 Strategic Outlook
16.6 Hitachi, Ltd.
16.6.1 Company Snapshot
16.6.2 Company Overview
16.6.3 Financial Analysis
16.6.4 Product Benchmarking
16.6.5 Strategic Outlook
16.7 Siemens AG
16.7.1 Company Snapshot
16.7.2 Company Overview
16.7.3 Financial Analysis
16.7.4 Product Benchmarking
16.7.5 Strategic Outlook
16.8 Robert Bosch GmbH
16.8.1 Company Snapshot
16.8.2 Company Overview
16.8.3 Product Benchmarking
16.8.4 Strategic Outlook
16.9 Blue Pillar
16.9.1 Company Snapshot
16.9.2 Company Overview
16.9.3 Product Benchmarking
16.9.4 Strategic Outlook
16.10 International Business Machines Corporation
16.10.1 Company Snapshot
16.10.2 Company Overview
16.10.3 Financial Analysis
16.10.4 Product Benchmarking
16.10.5 Strategic Outlook
16.11 Cisco Systems, Inc
16.11.1 Company Snapshot
16.11.2 Company Overview
16.11.3 Financial Analysis
16.11.4 Product Benchmarking
16.11.5 Strategic Outlook
16.12 AGL Energy
16.12.1 Company Snapshot
16.12.2 Company Overview
16.12.3 Product Benchmarking
16.12.4 Strategic Outlook
16.13 Enernoc, Inc
16.13.1 Company Snapshot
16.13.2 Company Overview
16.13.3 Product Benchmarking
16.13.4 Strategic Outlook
16.14 Next Kraftwerke
16.14.1 Company Snapshot
16.14.2 Company Overview
16.14.3 Product Benchmarking
16.14.4 Strategic Outlook
16.15 AutoGrid
16.15.1 Company Snapshot
16.15.2 Company Overview
16.15.3 Product Benchmarking
16.15.4 Strategic Outlook
17 Conclusion and Recommendations
17.1 Concluding Remarks from Visiongain
17.2 Recommendations for Market Players
17.1 Improved incentives and regulatory measures can encourage widespread investment in virtual efficiency power plant initiatives.
17.2 Energy-efficiency champions can bridge the knowledge gap about new energy-saving technologies.
17.3 Credit and Lending Can Assist Small and Medium-Sized Businesses in Funding Energy-Efficient Initiatives
17.4 List of Other Notable Players
List of Tables
Table 1 Global Virtual Power Plant (VPP) Market Snapshot, 2023 & 2033 (US$ billion, CAGR %)
Table 2 Global Virtual Power Plant Market by Component, 2023-2033 (US$ Mn, AGR (%), CAGR (%))
Table 3 Global Energy Generation Technology Market Forecast, 2023-2033 (US$ Mn, AGR (%), CAGR (%))
Table 4 Global Energy Generation Technology Market by Region, 2023-2033 (US$ Mn, AGR (%), CAGR (%))
Table 5 Global Energy Storage Technologies Market Forecast, 2023-2033 (US$ Mn, AGR (%), CAGR (%))
Table 6 Global Energy Storage Technologies Market by Region, 2023-2033 (US$ Mn, AGR (%), CAGR (%))
Table 7 Global Information Communication Technology (ICT) Market Forecast, 2023-2033 (US$ Mn, AGR (%), CAGR (%))
Table 8 Global Information Communication Technology (ICT) Market by Region, 2023-2033 (US$ Mn, AGR (%), CAGR (%))
Table 9 Global Virtual Power Plant Market by End-User, 2023-2033 (US$ Mn, AGR (%), CAGR (%))
Table 10 Global Industrial VPP Market Forecast, 2023-2033 (US$ Mn, AGR (%), CAGR (%))
Table 11 Global Industrial VPP Market by Region, 2023-2033 (US$ Mn, AGR (%), CAGR (%))
Table 12 Global Commercial VPP Market Forecast, 2023-2033 (US$ Mn, AGR (%), CAGR (%))
Table 13 Global Commercial VPP Market by Region, 2023-2033 (US$ Mn, AGR (%), CAGR (%))
Table 14 Global Residential VPP Market Forecast, 2023-2033 (US$ Mn, AGR (%), CAGR (%))
Table 15 Global Residential VPP Market by Region, 2023-2033 (US$ Mn, AGR (%), CAGR (%))
Table 16 Global Other End-User Market Forecast, 2023-2033 (US$ Mn, AGR (%), CAGR (%))
Table 17 Global Other End-User Market by Region, 2023-2033 (US$ Mn, AGR (%), CAGR (%))
Table 18 Global Virtual Power Plant Market by Information Communication Technology (ICT), 2023-2033 (US$ Mn, AGR (%), CAGR (%))
Table 19 Global Energy Management Systems (EMS) Market Forecast, 2023-2033 (US$ Mn, AGR (%), CAGR (%))
Table 20 Global Energy Management Systems (EMS) Market by Region, 2023-2033 (US$ Mn, AGR (%), CAGR (%))
Table 21 Global Supervisory Control and Data Acquisition (SCADA) Market Forecast, 2023-2033 (US$ Mn, AGR (%), CAGR (%))
Table 22 Global Supervisory Control and Data Acquisition (SCADA) Market by Region, 2023-2033 (US$ Mn, AGR (%), CAGR (%))
Table 23 Global Distribution Management System (DMS) Market Forecast, 2023-2033 (US$ Mn, AGR (%), CAGR (%))
Table 24 Global Distribution Management System (DMS) Market by Region, 2023-2033 (US$ Mn, AGR (%), CAGR (%))
Table 25 Global Smart Meters Market Forecast, 2023-2033 (US$ Mn, AGR (%), CAGR (%))
Table 26 Global Smart Meters Market by Region, 2023-2033 (US$ Mn, AGR (%), CAGR (%))
Table 27 Global Other Information Communication Technology (ICT) Market Forecast, 2023-2033 (US$ Mn, AGR (%), CAGR (%))
Table 28 Global Other Information Communication Technology (ICT) Market by Region, 2023-2033 (US$ Mn, AGR (%), CAGR (%))
Table 29 Global Virtual Power Plant Market by Energy Generation Technology, 2023-2033 (US$ Mn, AGR (%), CAGR (%))
Table 30 Global Wind Based Energy Generation Market Forecast, 2023-2033 (US$ Mn, AGR (%), CAGR (%))
Table 31 Global Wind Based Energy Generation Market by Region, 2023-2033 (US$ Mn, AGR (%), CAGR (%))
Table 32 Global Small Hydro-Plants Market Forecast, 2023-2033 (US$ Mn, AGR (%), CAGR (%))
Table 33 Global Small Hydro-Plants Market by Region, 2023-2033 (US$ Mn, AGR (%), CAGR (%))
Table 34 Global Solar Production Market Forecast, 2023-2033 (US$ Mn, AGR (%), CAGR (%))
Table 35 Global Solar Production Market by Region, 2023-2033 (US$ Mn, AGR (%), CAGR (%))
Table 36 Global Combined Heat and Power (CHP) Market Forecast, 2023-2033 (US$ Mn, AGR (%), CAGR (%))
Table 37 Global Combined Heat and Power (CHP) Market by Region, 2023-2033 (US$ Mn, AGR (%), CAGR (%))
Table 38 Global Small Power Plants Market Forecast, 2023-2033 (US$ Mn, AGR (%), CAGR (%))
Table 39 Global Small Power Plants Market by Region, 2023-2033 (US$ Mn, AGR (%), CAGR (%))
Table 40 Global Other Energy Generation Technology Market Forecast, 2023-2033 (US$ Mn, AGR (%), CAGR (%))
Table 41 Global Other Energy Generation Technology Market by Region, 2023-2033 (US$ Mn, AGR (%), CAGR (%))
Table 42 Global Virtual Power Plant Market by Energy Storage Technology, 2023-2033 (US$ Mn, AGR (%), CAGR (%))
Table 43 Global Battery Energy Storage System (BESS) Market Forecast, 2023-2033 (US$ Mn, AGR (%), CAGR (%))
Table 44 Global Battery Energy Storage System (BESS) Market by Region, 2023-2033 (US$ Mn, AGR (%), CAGR (%))
Table 45 Global Supercapacitor Energy Storage (SCES) Market Forecast, 2023-2033 (US$ Mn, AGR (%), CAGR (%))
Table 46 Global Supercapacitor Energy Storage (SCES) Market by Region, 2023-2033 (US$ Mn, AGR (%), CAGR (%))
Table 47 Global Super Conductor Magnetic Energy Storage (SMES) Market Forecast, 2023-2033 (US$ Mn, AGR (%), CAGR (%))
Table 48 Global Super Conductor Magnetic Energy Storage (SMES) Market by Region, 2023-2033 (US$ Mn, AGR (%), CAGR (%))
Table 49 Global Hydraulic Pumped Energy Storage (HPES) Market Forecast, 2023-2033 (US$ Mn, AGR (%), CAGR (%))
Table 50 Global Hydraulic Pumped Energy Storage (HPES) Market by Region, 2023-2033 (US$ Mn, AGR (%), CAGR (%))
Table 51 Global Flywheel Energy Storage (FWES) Market Forecast, 2023-2033 (US$ Mn, AGR (%), CAGR (%))
Table 52 Global Flywheel Energy Storage (FWES) Market by Region, 2023-2033 (US$ Mn, AGR (%), CAGR (%))
Table 53 Global Other Energy Storage Technology Market Forecast, 2023-2033 (US$ Mn, AGR (%), CAGR (%))
Table 54 Global Other Energy Storage Technology Market by Region, 2023-2033 (US$ Mn, AGR (%), CAGR (%))
Table 55 Global Virtual Power Plant Market by Region, 2023-2033 (US$ Mn, AGR (%), CAGR (%))
Table 56 Global Virtual Power Plant Market Forecast, 2023-2033 (US$ Mn, AGR (%), CAGR (%)) (V-Shaped Recovery Scenario)
Table 57 Global Virtual Power Plant Market by Region, 2023-2033 (US$ Mn, AGR (%), CAGR (%)) (V-Shaped Recovery Scenario)
Table 58 Global Virtual Power Plant Market Forecast, 2023-2033 (US$ Mn, AGR (%), CAGR (%)) (U-Shaped Recovery Scenario)
Table 59 Global Virtual Power Plant Market by Region, 2023-2033 (US$ Mn, AGR (%), CAGR (%)) (U-Shaped Recovery Scenario)
Table 60 Global Virtual Power Plant Market Forecast, 2023-2033 (US$ Mn, AGR (%), CAGR (%)) (W-Shaped Recovery Scenario)
Table 61 Global Virtual Power Plant Market by Region, 2023-2033 (US$ Mn, AGR (%), CAGR (%)) (W-Shaped Recovery Scenario)
Table 62 Global Virtual Power Plant Market Forecast, 2023-2033 (US$ Mn, AGR (%), CAGR (%)) (L-Shaped Recovery Scenario)
Table 63 Global Virtual Power Plant Market by Region, 2023-2033 (US$ Mn, AGR (%), CAGR (%)) (L-Shaped Recovery Scenario)
Table 64 North America Virtual Power Plant Market by Country, 2023-2033 (US$ Mn, AGR (%), CAGR (%))
Table 65 North America Virtual Power Plant Market by Component, 2023-2033 (US$ Mn, AGR (%), CAGR (%))
Table 66 North America Virtual Power Plant Market by End-User, 2023-2033 (US$ Mn, AGR (%), CAGR (%))
Table 67 North America Virtual Power Plant Market by Information Communication Technology (ICT), 2023-2033 (US$ Mn, AGR (%), CAGR (%))
Table 68 North America Virtual Power Plant Market by Energy Generation Technology, 2023-2033 (US$ Mn, AGR (%), CAGR (%))
Table 69 North America Virtual Power Plant Market by Energy Storage Technology, 2023-2033 (US$ Mn, AGR (%), CAGR (%))
Table 70 US Virtual Power Plant Market by Value, 2023-2033 (US$ Mn, AGR (%), CAGR (%))
Table 71 Canada Virtual Power Plant Market by Value, 2023-2033 (US$ Mn, AGR (%), CAGR (%))
Table 72 Europe Virtual Power Plant Market by Country, 2023-2033 (US$ Mn, AGR (%), CAGR (%))
Table 73 Europe Virtual Power Plant Market by Component, 2023-2033 (US$ Mn, AGR (%), CAGR (%))
Table 74 Europe Virtual Power Plant Market by End-User, 2023-2033 (US$ Mn, AGR (%), CAGR (%))
Table 75 Europe Virtual Power Plant Market by Information Communication Technology (ICT), 2023-2033 (US$ Mn, AGR (%), CAGR (%))
Table 76 Europe Virtual Power Plant Market by Energy Generation Technology, 2023-2033 (US$ Mn, AGR (%), CAGR (%))
Table 77 Europe Virtual Power Plant Market by Energy Storage Technology, 2023-2033 (US$ Mn, AGR (%), CAGR (%))
Table 78 Germany Virtual Power Plant Market by Value, 2023-2033 (US$ Mn, AGR (%), CAGR (%))
Table 79 UK Virtual Power Plant Market by Value, 2023-2033 (US$ Mn, AGR (%), CAGR (%))
Table 80 France Virtual Power Plant Market by Value, 2023-2033 (US$ Mn, AGR (%), CAGR (%))
Table 81 Italy Virtual Power Plant Market by Value, 2023-2033 (US$ Mn, AGR (%), CAGR (%))
Table 82 Spain Virtual Power Plant Market by Value, 2023-2033 (US$ Mn, AGR (%), CAGR (%))
Table 83 Rest of Europe Virtual Power Plant Market by Value, 2023-2033 (US$ Mn, AGR (%), CAGR (%))
Table 84 Asia-Pacific Virtual Power Plant Market by Country, 2023-2033 (US$ Mn, AGR (%), CAGR (%))
Table 85 Asia-Pacific Virtual Power Plant Market by Component, 2023-2033 (US$ Mn, AGR (%), CAGR (%))
Table 86 Asia-Pacific Virtual Power Plant Market by End-User, 2023-2033 (US$ Mn, AGR (%), CAGR (%))
Table 87 Asia-Pacific Virtual Power Plant Market by Information Communication Technology (ICT), 2023-2033 (US$ Mn, AGR (%), CAGR (%))
Table 88 Asia-Pacific Virtual Power Plant Market by Energy Generation Technology, 2023-2033 (US$ Mn, AGR (%), CAGR (%))
Table 89 Asia-Pacific Virtual Power Plant Market by Energy Storage Technology, 2023-2033 (US$ Mn, AGR (%), CAGR (%))
Table 90 China Virtual Power Plant Market by Value, 2023-2033 (US$ Mn, AGR (%), CAGR (%))
Table 91 India Virtual Power Plant Market by Value, 2023-2033 (US$ Mn, AGR (%), CAGR (%))
Table 92 Japan Virtual Power Plant Market by Value, 2023-2033 (US$ Mn, AGR (%), CAGR (%))
Table 93 South Korea Virtual Power Plant Market by Value, 2023-2033 (US$ Mn, AGR (%), CAGR (%))
Table 94 Australia Virtual Power Plant Market by Value, 2023-2033 (US$ Mn, AGR (%), CAGR (%))
Table 95 Rest of Asia-Pacific Virtual Power Plant Market by Value, 2023-2033 (US$ Mn, AGR (%), CAGR (%))
Table 96 Middle East & Africa Virtual Power Plant Market by Country, 2023-2033 (US$ Mn, AGR (%), CAGR (%))
Table 97 Middle East & Africa Virtual Power Plant Market by Component, 2023-2033 (US$ Mn, AGR (%), CAGR (%))
Table 98 Middle East & Africa Virtual Power Plant Market by End-User, 2023-2033 (US$ Mn, AGR (%), CAGR (%))
Table 99 Middle East & Africa Virtual Power Plant Market by Information Communication Technology (ICT), 2023-2033 (US$ Mn, AGR (%), CAGR (%))
Table 100 Middle East & Africa Virtual Power Plant Market by Energy Generation Technology, 2023-2033 (US$ Mn, AGR (%), CAGR (%))
Table 101 Middle East & Africa Virtual Power Plant Market by Energy Storage Technology, 2023-2033 (US$ Mn, AGR (%), CAGR (%))
Table 102 GCC Virtual Power Plant Market by Value, 2023-2033 (US$ Mn, AGR (%), CAGR (%))
Table 103 South Africa Virtual Power Plant Market by Value, 2023-2033 (US$ Mn, AGR (%), CAGR (%))
Table 104 Rest of Middle East & Africa Virtual Power Plant Market by Value, 2023-2033 (US$ Mn, AGR (%), CAGR (%))
Table 105 North America Virtual Power Plant Market by Country, 2023-2033 (US$ Mn, AGR (%), CAGR (%))
Table 106 North America Virtual Power Plant Market by Component, 2023-2033 (US$ Mn, AGR (%), CAGR (%))
Table 107 North America Virtual Power Plant Market by End-User, 2023-2033 (US$ Mn, AGR (%), CAGR (%))
Table 108 North America Virtual Power Plant Market by Information Communication Technology (ICT), 2023-2033 (US$ Mn, AGR (%), CAGR (%))
Table 109 North America Virtual Power Plant Market by Energy Generation Technology, 2023-2033 (US$ Mn, AGR (%), CAGR (%))
Table 110 North America Virtual Power Plant Market by Energy Storage Technology, 2023-2033 (US$ Mn, AGR (%), CAGR (%))
Table 111 Brazil Virtual Power Plant Market by Value, 2023-2033 (US$ Mn, AGR (%), CAGR (%))
Table 112 Mexico Virtual Power Plant Market by Value, 2023-2033 (US$ Mn, AGR (%), CAGR (%))
Table 113 Rest of Latin America Virtual Power Plant Market by Value, 2023-2033 (US$ Mn, AGR (%), CAGR (%))
Table 114 General Electric: Key Details, (CEO, HQ, Revenue, Founded, No. of Employees, Company Type, Website, Business Segment)
Table 115 General Electric: Product Benchmarking
Table 116 General Electric: Strategic Outlook
Table 117 Toshiba Corporation: Key Details, (CEO, HQ, Revenue, Founded, No. of Employees, Company Type, Website, Business Segment)
Table 118 Toshiba Corporation: Product Benchmarking
Table 119 Toshiba Corporation: Strategic Outlook
Table 120 Enel S.P.A:: Key Details, (CEO, HQ, Revenue, Founded, No. of Employees, Company Type, Website, Business Segment)
Table 121 Enel S.P.A: Product Benchmarking
Table 122 Enel S.P.A: Strategic Outlook
Table 123 Schneider Electric SE: Key Details, (CEO, HQ, Revenue, Founded, No. of Employees, Company Type, Website, Business Segment)
Table 124 Schneider Electric SE: Product Benchmarking
Table 125 Schneider Electric SE: Strategic Outlook
Table 126 ABB Ltd: Key Details, (CEO, HQ, Revenue, Founded, No. of Employees, Company Type, Website, Business Segment)
Table 127 ABB Ltd: Product Benchmarking
Table 128 ABB Ltd: Strategic Outlook
Table 129 Hitachi Ltd: Key Details, (CEO, HQ, Revenue, Founded, No. of Employees, Company Type, Website, Business Segment)
Table 130 Hitachi Ltd: Product Benchmarking
Table 131 Hitachi Ltd: Strategic Outlook
Table 132 Siemens AG: Key Details, (CEO, HQ, Revenue, Founded, No. of Employees, Company Type, Website, Business Segment)
Table 133 Siemens AG: Product Benchmarking
Table 134 Siemens AG: Strategic Outlook
Table 135 Robert Bosch GmbH: Key Details, (CEO, HQ, Revenue, Founded, No. of Employees, Company Type, Website, Business Segment)
Table 136 Robert Bosch GmbH: Product Benchmarking
Table 137 Robert Bosch GmbH: Strategic Outlook
Table 138 Blue Pillar: Key Details, (CEO, HQ, Revenue, Founded, No. of Employees, Company Type, Website, Business Segment)
Table 139 Blue Pillar: Product Benchmarking
Table 140 Blue Pillar: Strategic Outlook
Table 141 International Business Machines Corporation: Key Details, (CEO, HQ, Revenue, Founded, No. of Employees, Company Type, Website, Business Segment)
Table 142 International Business Machines Corporation: Product Benchmarking
Table 143 International Business Machines Corporation: Strategic Outlook
Table 144 Cisco Systems, Inc: Key Details, (CEO, HQ, Revenue, Founded, No. of Employees, Company Type, Website, Business Segment)
Table 145 Cisco Systems, Inc: Product Benchmarking
Table 146 Cisco Systems, Inc: Strategic Outlook
Table 147 AGL Energy: Key Details, (CEO, HQ, Revenue, Founded, No. of Employees, Company Type, Website, Business Segment)
Table 148 AGL Energy: Product Benchmarking
Table 149 AGL Energy: Strategic Outlook
Table 150 Enernoc, Inc: Key Details, (CEO, HQ, Revenue, Founded, No. of Employees, Company Type, Website, Business Segment)
Table 151 Enernoc, Inc: Product Benchmarking
Table 152 Enernoc, Inc: Strategic Outlook
Table 153 Next Kraftwerke: Key Details, (CEO, HQ, Revenue, Founded, No. of Employees, Company Type, Website, Business Segment)
Table 154 Next Kraftwerke: Product Benchmarking
Table 155 Next Kraftwerke: Strategic Outlook
Table 156 AutoGrid: Key Details, (CEO, HQ, Revenue, Founded, No. of Employees, Company Type, Website, Business Segment)
Table 157 AutoGrid: Product Benchmarking
Table 158 AutoGrid: Strategic Outlook
List of Figures
Figure 1 Global Virtual Power Plant (VPP) Market Segmentation
Figure 2 Breakdown of Primary Interviews: By Company Type, Designation, & Region
Figure 3 Global Virtual Power Plant (VPP) Market Forecast by Region: Market Attractiveness Index
Figure 4 Global Virtual Power Plant (VPP) Market by Component: Market Attractiveness Index
Figure 5 Global Virtual Power Plant (VPP) Market by End-User: Market Attractiveness Index
Figure 6 Global Virtual Power Plant (VPP) Market by Information Communication Technology: Market Attractiveness Index
Figure 7 Global Virtual Power Plant (VPP) Market by Energy Generation Technology: Market Attractiveness Index
Figure 8 Global Virtual Power Plant (VPP) Market by Energy Storage Technology: Market Attractiveness Index
Figure 9 Global Virtual Power Plant (VPP) Market: Market Dynamics
Figure 10 Global Virtual Power Plant (VPP) Market: Porter’s Five Forces Analysis
Figure 11 Global Virtual Power Plant (VPP) Market: PESTLE Analysis
Figure 12 Global Virtual Power Plant (VPP) Market Forecast by Component 2023, 2033 (Revenue, CAGR%)
Figure 13 Global Virtual Power Plant (VPP) Market Forecast by Component,2023, 2033 (Revenue, CAGR%)
Figure 14 Global Virtual Power Plant Market by Component, 2023-2033 (US$ Mn, AGR (%)
Figure 15 Global Energy Generation Technology Market Forecast, 2023-2033 (US$ Mn, AGR (%))
Figure 16 Global Energy Generation Technology Market by Region, 2023-2033 (US$ Mn, AGR (%))
Figure 17 Global Energy Storage Technologies Market Forecast, 2023-2033 (US$ Mn, AGR (%))
Figure 18 Global Energy Storage Technologies Market by Region, 2023-2033 (US$ Mn, AGR (%))
Figure 19 Global Information Communication Technology (ICT) Market Forecast, 2023-2033 (US$ Mn, AGR (%))
Figure 20 Global Information Communication Technology (ICT) Market by Region, 2023-2033 (US$ Mn, AGR (%))
Figure 21 Global Virtual Power Plant (VPP) Market Forecast by End-User 2023, 2033 (Revenue, CAGR%)
Figure 22 Global Virtual Power Plant (VPP) Market Forecast by Component,2023, 2033 (Revenue, CAGR%)
Figure 23 Global Virtual Power Plant Market by End-User, 2023-2033 (US$ Mn, AGR (%))
Figure 24 Global Industrial VPP Market Forecast, 2023-2033 (US$ Mn, AGR (%))
Figure 25 Global Industrial VPP Market by Region, 2023-2033 (US$ Mn, AGR (%))
Figure 26 Global Commercial VPP Market Forecast, 2023-2033 (US$ Mn, AGR (%))
Figure 27 Global Commercial VPP Market by Region, 2023-2033 (US$ Mn, AGR (%))
Figure 28 Global Residential VPP Market Forecast, 2023-2033 (US$ Mn, AGR (%))
Figure 29 Global Residential VPP Market by Region, 2023-2033 (US$ Mn, AGR (%))
Figure 30 Global Other End-User Market Forecast, 2023-2033 (US$ Mn, AGR (%))
Figure 31 Global Other End-User Market by Region, 2023-2033 (US$ Mn, AGR (%))
Figure 32 Global Virtual Power Plant (VPP) Market Forecast by End-User 2023, 2033 (Revenue, CAGR%)
Figure 33 Global Virtual Power Plant (VPP) Market Forecast by Component,2023, 2033 (Revenue, CAGR%)
Figure 34 Global Virtual Power Plant Market by Information Communication Technology (ICT), 2023-2033 (US$ Mn, AGR (%))
Figure 35 Global Energy Management Systems (EMS) Market Forecast, 2023-2033 (US$ Mn, AGR (%))
Figure 36 Global Energy Management Systems (EMS) Market by Region, 2023-2033 (US$ Mn, AGR (%))
Figure 37 Global Supervisory Control and Data Acquisition (SCADA) Market Forecast, 2023-2033 (US$ Mn, AGR (%))
Figure 38 Global Supervisory Control and Data Acquisition (SCADA) Market by Region, 2023-2033 (US$ Mn, AGR (%))
Figure 39 Global Distribution Management System (DMS) Market Forecast, 2023-2033 (US$ Mn, AGR (%)
Figure 40 Global Distribution Management System (DMS) Market by Region, 2023-2033 (US$ Mn, AGR (%))
Figure 41 Global Smart Meters Market Forecast, 2023-2033 (US$ Mn, AGR (%))
Figure 42 Global Smart Meters Market by Region, 2023-2033 (US$ Mn, AGR (%))
Figure 43 Global Other Information Communication Technology (ICT) Market Forecast, 2023-2033 (US$ Mn, AGR (%))
Figure 44 Global Other Information Communication Technology (ICT) Market by Region, 2023-2033 (US$ Mn, AGR (%))
Figure 45 Global Virtual Power Plant (VPP) Market Forecast by Energy Generation Technology2023, 2033 (Revenue, CAGR%)
Figure 46 Global Virtual Power Plant (VPP) Market Forecast by Energy Generation Technology,2023, 2033 (Revenue, CAGR%)
Figure 47 Global Virtual Power Plant Market by Energy Generation Technology, 2023-2033 (US$ Mn, AGR (%))
Figure 48 Global Wind Based Energy Generation Market Forecast, 2023-2033 (US$ Mn, AGR (%))
Figure 49 Global Wind Based Energy Generation Market by Region, 2023-2033 (US$ Mn, AGR (%))
Figure 50 Global Small Hydro-Plants Market Forecast, 2023-2033 (US$ Mn, AGR (%))
Figure 51 Global Small Hydro-Plants Market by Region, 2023-2033 (US$ Mn, AGR (%))
Figure 52 Global Solar Production Market Forecast, 2023-2033 (US$ Mn, AGR (%))
Figure 53 Global Solar Production Market by Region, 2023-2033 (US$ Mn, AGR (%))
Figure 54 Global Combined Heat and Power (CHP) Market Forecast, 2023-2033 (US$ Mn, AGR (%))
Figure 55 Global Combined Heat and Power (CHP) Market by Region, 2023-2033 (US$ Mn, AGR (%))
Figure 1 Global Small Power Plants Market Forecast, 2023-2033 (US$ Mn, AGR (%), (%))
Figure 56 Global Small Power Plants Market by Region, 2023-2033 (US$ Mn, AGR (%))
Figure 57 Global Other Energy Generation Technology Market Forecast, 2023-2033 (US$ Mn, AGR (%))
Figure 58 Global Other Energy Generation Technology Market by Region, 2023-2033 (US$ Mn, AGR (%))
Figure 59 Global Virtual Power Plant (VPP) Market Forecast by Energy Storage Technology ,2023, 2033 (Revenue, CAGR%)
Figure 60 Global Virtual Power Plant (VPP) Market Forecast by Energy Storage Technology,2023, 2033 (Revenue, CAGR%)
Figure 61 Global Virtual Power Plant Market by Energy Storage Technology, 2023-2033 (US$ Mn, AGR (%))
Figure 62 Global Battery Energy Storage System (BESS) Market Forecast, 2023-2033 (US$ Mn, AGR (%))
Figure 63 Global Battery Energy Storage System (BESS) Market by Region, 2023-2033 (US$ Mn, AGR (%))
Figure 64 Global Supercapacitor Energy Storage (SCES) Market Forecast, 2023-2033 (US$ Mn, AGR (%))
Figure 65 Global Supercapacitor Energy Storage (SCES) Market by Region, 2023-2033 (US$ Mn, AGR (%))
Figure 66 Global Super Conductor Magnetic Energy Storage (SMES) Market Forecast, 2023-2033 (US$ Mn, AGR (%))
Figure 67 Global Super Conductor Magnetic Energy Storage (SMES) Market by Region, 2023-2033 (US$ Mn, AGR (%))
Figure 68 Global Hydraulic Pumped Energy Storage (HPES) Market Forecast, 2023-2033 (US$ Mn, AGR (%))
Figure 69 Global Hydraulic Pumped Energy Storage (HPES) Market by Region, 2023-2033 (US$ Mn, AGR (%))
Figure 70 Global Flywheel Energy Storage (FWES) Market Forecast, 2023-2033 (US$ Mn, AGR (%))
Figure 71 Global Flywheel Energy Storage (FWES) Market by Region, 2023-2033 (US$ Mn, AGR (%))
Figure 72 Global Other Energy Storage Technology Market Forecast, 2023-2033 (US$ Mn, AGR (%))
Figure 73 Global Other Energy Storage Technology Market by Region, 2023-2033 (US$ Mn, AGR (%))
Figure 74 Global Virtual Power Plant Market by Region, 2023-2033 (US$ Mn, AGR (%))
Figure 75 Global Virtual Power Plant Market Forecast, 2023-2033 (US$ Mn, AGR (%)), (V-Shaped Recovery Scenario)
Figure 76 Global Virtual Power Plant Market by Region, 2023-2033 (US$ Mn, AGR (%)) (V-Shaped Recovery Scenario)
Figure 77 Global Virtual Power Plant Market Forecast, 2023-2033 (US$ Mn, AGR (%)) (U-Shaped Recovery Scenario)
Figure 78 Global Virtual Power Plant Market by Region, 2023-2033 (US$ Mn, AGR (%)) (U-Shaped Recovery Scenario)
Figure 79 Global Virtual Power Plant Market Forecast, 2023-2033 (US$ Mn, AGR (%)) (W-Shaped Recovery Scenario)
Figure 80 Global Virtual Power Plant Market by Region, 2023-2033 (US$ Mn, AGR (%)) (W-Shaped Recovery Scenario)
Figure 81 Global Virtual Power Plant Market Forecast, 2023-2033 (US$ Mn, AGR (%)) (L-Shaped Recovery Scenario)
Figure 82 Global Virtual Power Plant Market by Region, 2023-2033 (US$ Mn, AGR (%)) (L-Shaped Recovery Scenario)
Figure 83 North America Virtual Power Plant (VPP) Market Attractiveness Index
Figure 84 North America Virtual Power Plant (VPP) Market Share Forecast 2023, 2033 (%)
Figure 85 North America Virtual Power Plant Market by Country, 2023-2033 (US$ Mn, AGR (%))
Figure 86 North America Virtual Power Plant Market by Component, 2023-2033 (US$ Mn, AGR (%))
Figure 87 North America Virtual Power Plant Market Share Forecast by Component, 2023 & 2033 (%)
Figure 88 North America Virtual Power Plant Market by End-User, 2023-2033 (US$ Mn, AGR (%))
Figure 89 North America Virtual Power Plant Market Share Forecast by End-User, 2023 & 2033 (%)
Figure 90 North America Virtual Power Plant Market by Information Communication Technology (ICT), 2023-2033 (US$ Mn, AGR (%))
Figure 91 North America Virtual Power Plant Market Share Forecast Information Communication Technology (ICT),2023 & 2033 (%)
Figure 92 North America Virtual Power Plant Market by Energy Generation Technology, 2023-2033 (US$ Mn, AGR (%))
Figure 93 North America Virtual Power Plant Market Share Forecast Energy Generation Technology ,2023 & 2033 (%)
Figure 94 North America Virtual Power Plant Market by Energy Storage Technology, 2023-2033 (US$ Mn, AGR (%))
Figure 95 North America Virtual Power Plant Market Share Forecast Energy Storage Technology ,2023 & 2033 (%)
Figure 96 US Virtual Power Plant Market by Value, 2023-2033 (US$ Mn, AGR (%))
Figure 97 Canada Virtual Power Plant Market by Value, 2023-2033 (US$ Mn, AGR (%))
Figure 98 Europe Virtual Power Plant (VPP) Market Attractiveness Index
Figure 99 Europe Virtual Power Plant (VPP) Market Share Forecast 2023, 2033 (%)
Figure 100 Europe Virtual Power Plant Market by Country, 2023-2033 (US$ Mn, AGR (%))
Figure 101 Europe Virtual Power Plant Market by Component, 2023-2033 (US$ Mn, AGR (%))
Figure 102 Europe Virtual Power Plant Market Share Forecast by Component, 2023 & 2033 (%)
Figure 103 Europe Virtual Power Plant Market by End-User, 2023-2033 (US$ Mn, AGR (%))
Figure 104 Europe Virtual Power Plant Market Share Forecast by End-User, 2023 & 2033 (%)
Figure 105 Europe Virtual Power Plant Market by Information Communication Technology (ICT), 2023-2033 (US$ Mn, AGR (%))
Figure 106 Europe Virtual Power Plant Market Share Forecast Information Communication Technology (ICT),2023 & 2033 (%)
Figure 107 Europe Virtual Power Plant Market by Energy Generation Technology, 2023-2033 (US$ Mn, AGR (%))
Figure 108 Europe Virtual Power Plant Market Share Forecast Energy Generation Technology ,2023 & 2033 (%)
Figure 109 Europe Virtual Power Plant Market by Energy Storage Technology, 2023-2033 (US$ Mn, AGR (%))
Figure 110 Europe Virtual Power Plant Market Share Forecast Energy Storage Technology ,2023 & 2033 (%)
Figure 111 Germany Virtual Power Plant Market by Value, 2023-2033 (US$ Mn, AGR (%))
Figure 112 UK Virtual Power Plant Market by Value, 2023-2033 (US$ Mn, AGR (%))
Figure 113 France Virtual Power Plant Market by Value, 2023-2033 (US$ Mn, AGR (%))
Figure 114 Italy Virtual Power Plant Market by Value, 2023-2033 (US$ Mn, AGR (%))
Figure 115 Spain Virtual Power Plant Market by Value, 2023-2033 (US$ Mn, AGR (%))
Figure 116 Rest of Europe Virtual Power Plant Market by Value, 2023-2033 (US$ Mn, AGR (%))
Figure 117 Asia-Pacific Virtual Power Plant (VPP) Market Attractiveness Index
Figure 118 Asia-Pacific Virtual Power Plant (VPP) Market Share Forecast 2023, 2033 (%)
Figure 119 Asia-Pacific Virtual Power Plant Market by Country, 2023-2033 (US$ Mn, AGR (%))
Figure 120 Asia-Pacific Virtual Power Plant Market by Component, 2023-2033 (US$ Mn, AGR (%))
Figure 121 Asia-Pacific Virtual Power Plant Market Share Forecast by Component, 2023 & 2033 (%)
Figure 122 Asia-Pacific Virtual Power Plant Market by End-User, 2023-2033 (US$ Mn, AGR (%))
Figure 123 Asia-Pacific Virtual Power Plant Market Share Forecast by End-User, 2023 & 2033 (%)
Figure 124 Asia-Pacific Virtual Power Plant Market by Information Communication Technology (ICT), 2023-2033 (US$ Mn, AGR (%))
Figure 125 Asia-Pacific Virtual Power Plant Market Share Forecast Information Communication Technology (ICT),2023 & 2033 (%)
Figure 126 Asia-Pacific Virtual Power Plant Market by Energy Generation Technology, 2023-2033 (US$ Mn, AGR (%))
Figure 127 Asia-Pacific Virtual Power Plant Market Share Forecast Energy Generation Technology ,2023 & 2033 (%)
Figure 128 Asia-Pacific Virtual Power Plant Market by Energy Storage Technology, 2023-2033 (US$ Mn, AGR (%))
Figure 129 Asia-Pacific Virtual Power Plant Market Share Forecast Energy Storage Technology ,2023 & 2033 (%)
Figure 130 China Virtual Power Plant Market by Value, 2023-2033 (US$ Mn, AGR (%))
Figure 131 India Virtual Power Plant Market by Value, 2023-2033 (US$ Mn, AGR (%))
Figure 132 Japan Virtual Power Plant Market by Value, 2023-2033 (US$ Mn, AGR (%))
Figure 133 South Korea Virtual Power Plant Market by Value, 2023-2033 (US$ Mn, AGR (%))
Figure 134 Australia Virtual Power Plant Market by Value, 2023-2033 (US$ Mn, AGR (%))
Figure 135 Rest of Asia-Pacific Virtual Power Plant Market by Value, 2023-2033 (US$ Mn, AGR (%))
Figure 136 Middle East & Africa Virtual Power Plant (VPP) Market Attractiveness Index
Figure 137 Middle East & Africa Virtual Power Plant (VPP) Market Share Forecast 2023, 2033 (%)
Figure 138 Middle East & Africa Virtual Power Plant Market by Country, 2023-2033 (US$ Mn, AGR (%))
Figure 139 Middle East & Africa Virtual Power Plant Market by Component, 2023-2033 (US$ Mn, AGR (%))
Figure 140 Middle East & Africa Virtual Power Plant Market Share Forecast by Component, 2023 & 2033 (%)
Figure 141 Middle East & Africa Virtual Power Plant Market by End-User, 2023-2033 (US$ Mn, AGR (%))
Figure 142 Middle East & Africa Virtual Power Plant Market Share Forecast by End-User, 2023 & 2033 (%)
Figure 143 Middle East & Africa Virtual Power Plant Market by Information Communication Technology (ICT), 2023-2033 (US$ Mn, AGR (%))
Figure 144 Middle East & Africa Virtual Power Plant Market Share Forecast Information Communication Technology (ICT),2023 & 2033 (%)
Figure 145 Middle East & Africa Virtual Power Plant Market by Energy Generation Technology, 2023-2033 (US$ Mn, AGR (%))
Figure 146 Middle East & Africa Virtual Power Plant Market Share Forecast Energy Generation Technology ,2023 & 2033 (%)
Figure 147 Middle East & Africa Virtual Power Plant Market by Energy Storage Technology, 2023-2033 (US$ Mn, AGR (%))
Figure 148 Middle East & Africa Virtual Power Plant Market Share Forecast Energy Storage Technology ,2023 & 2033 (%)
Figure 149 GCC Virtual Power Plant Market by Value, 2023-2033 (US$ Mn, AGR (%))
Figure 150 South Africa Virtual Power Plant Market by Value, 2023-2033 (US$ Mn, AGR (%))
Figure 151 Rest of Middle East & Africa Virtual Power Plant Market by Value, 2023-2033 (US$ Mn, AGR (%))
Figure 152 Latin America Virtual Power Plant (VPP) Market Attractiveness Index
Figure 153 Latin America Virtual Power Plant (VPP) Market Share Forecast 2023, 2033 (%)
Figure 154 North America Virtual Power Plant Market by Country, 2023-2033 (US$ Mn, AGR (%))
Figure 155 North America Virtual Power Plant Market by Component, 2023-2033 (US$ Mn, AGR (%))
Figure 156 Latin America Virtual Power Plant Market Share Forecast by Component, 2023 & 2033 (%)
Figure 157 North America Virtual Power Plant Market by End-User, 2023-2033 (US$ Mn, AGR (%))
Figure 158 Latin America Virtual Power Plant Market Share Forecast by End-User, 2023 & 2033 (%)
Figure 159 North America Virtual Power Plant Market by Information Communication Technology (ICT), 2023-2033 (US$ Mn, AGR (%))
Figure 160 Latin America Virtual Power Plant Market Share Forecast Information Communication Technology (ICT),2023 & 2033 (%)
Figure 161 North America Virtual Power Plant Market by Energy Generation Technology, 2023-2033 (US$ Mn, AGR (%))
Figure 162 Latin America Virtual Power Plant Market Share Forecast Energy Generation Technology ,2023 & 2033 (%)
Figure 163 North America Virtual Power Plant Market by Energy Storage Technology, 2023-2033 (US$ Mn, AGR (%))
Figure 164 Latin America Virtual Power Plant Market Share Forecast Energy Storage Technology ,2023 & 2033 (%)
Figure 165 Brazil Virtual Power Plant Market by Value, 2023-2033 (US$ Mn, AGR (%))
Figure 166 Mexico Virtual Power Plant Market by Value, 2023-2033 (US$ Mn, AGR (%))
Figure 167 Rest of Latin America Virtual Power Plant Market by Value, 2023-2033 (US$ Mn, AGR (%))
Figure 168 General Electric: Net Revenue, 2017-2021 (US$ million, AGR%)
Figure 169 General Electric: Gross Profit, 2017-2021 (US$ million, AGR%)
Figure 170 General Electric: Operational Income, 2017-2021 (US$ million, AGR%)
Figure 171 General Electric: EBITDA, 2017-2021 (US$ million, AGR%)
Figure 172 Toshiba Corporation: Net Revenue, 2017-2021 (US$ million, AGR%)
Figure 173 Toshiba Corporation: Gross Profit, 2017-2021 (US$ million, AGR%)
Figure 174 Toshiba Corporation: Operational Income, 2017-2021 (US$ million, AGR%)
Figure 175 Toshiba Corporation: EBITDA, 2017-2021 (US$ million, AGR%)
Figure 176 Schneider Electric SE: Net Revenue, 2017-2021 (US$ million, AGR%)
Figure 177 Schneider Electric SE: Gross Profit, 2017-2021 (US$ million, AGR%)
Figure 178 Schneider Electric SE: Operational Income, 2017-2021 (US$ million, AGR%)
Figure 179 Schneider Electric SE: EBITDA, 2017-2021 (US$ million, AGR%)
Figure 180 ABB Ltd: Net Revenue, 2017-2021 (US$ million, AGR%)
Figure 181 ABB Ltd: Gross Profit, 2017-2021 (US$ million, AGR%)
Figure 182 ABB Ltd: Operational Income, 2017-2021 (US$ million, AGR%)
Figure 183 ABB Ltd: EBITDA, 2017-2021 (US$ million, AGR%)
Figure 184 Hitachi Ltd: Net Revenue, 2017-2021 (US$ million, AGR%)
Figure 185 Hitachi Ltd: Gross Profit, 2017-2021 (US$ million, AGR%)
Figure 186 Hitachi Ltd: Operational Income, 2017-2021 (US$ million, AGR%)
Figure 187 Hitachi Ltd: EBITDA, 2017-2021 (US$ million, AGR%)
Figure 188 Siemens AG: Net Revenue, 2017-2021 (US$ million, AGR%)
Figure 189 Siemens AG: Gross Profit, 2017-2021 (US$ million, AGR%)
Figure 190 Siemens AG: Operational Income, 2017-2021 (US$ million, AGR%)
Figure 191 Siemens AG: EBITDA, 2017-2021 (US$ million, AGR%)
Figure 192 International Business Machines Corporation: Net Revenue, 2017-2021 (US$ million, AGR%)
Figure 193 International Business Machines Corporation: Gross Profit, 2017-2021 (US$ million, AGR%)
Figure 194 International Business Machines Corporation: Operational Income, 2017-2021 (US$ million, AGR%)
Figure 195 International Business Machines Corporation: EBITDA, 2017-2021 (US$ million, AGR%)
Figure 196 Cisco Systems, Inc: Net Revenue, 2017-2021 (US$ million, AGR%)
Figure 197 Cisco Systems, Inc: Gross Profit, 2017-2021 (US$ million, AGR%)
Figure 198 Cisco Systems, Inc: Operational Income, 2017-2021 (US$ million, AGR%)
Figure 199 Cisco Systems, Inc: EBITDA, 2017-2021 (US$ million, AGR%)
ページTOPに戻る
- 浮体式ソーラーパネル市場 - 浮体式ソーラーパネルの世界産業分析、規模、シェア、成長、動向、2025-2032年予測 (製品タイプ別、場所別、容量別、最終用途別、地域範囲別、企業別)
- エネルギー管理システム(EMS)市場 - 世界のエネルギー管理システム(EMS)産業分析、規模、シェア、成長、動向、2025-2032年予測(車種別、用途別、技術別、販売チャネル別、地域別、企業別)
- リチウムイオン電池リサイクル市場 - 世界のリチウムイオン電池リサイクル産業分析、規模、シェア、成長、動向、2025-2032年予測 (電池化学別、供給源別、リサイクルプロセス別、地域範囲別、企業別)
- 水力発電所市場の展望 2025-2034年:市場シェア、成長分析 タイプ別(貯水池発電所、分水発電所(河川流域)、揚水発電所)、コンポーネント別(ソリューション、サービス)、エンドユーザー別
- Natural Gas Power Generation Market by Technology (Combined Cycle, Open Cycle, Cogeneration), End User (Power Utilities, Industrial, Residential & Commercial), Fuel Source (Pipeline, Liquefied), Power Output, and Region - Global Forecast to 2030
- Compressed Air Energy Storage Market by Type (Adiabatic, Diabatic), Expenditure Type (CAPEX, OPEX), Storage Form (Underground, Above Ground), Application (Grid Management, Renewable Energy Integration), Capacity, and Region - Global Forecast to 2030
- 直接空気回収技術(DAC)市場レポート:2025-2035
- 燃料電池バックアップ電源 - 世界市場シェア・ランキング、全体売上高・需要予測 2025-2031
- 自動車用ナトリウムイオン電池 - 世界市場シェア・ランキング、全体売上高・需要予測 2025-2031
- PC電源 - 世界市場シェア・ランキング、全体売上高・需要予測 2025-2031
よくあるご質問
Visiongain社はどのような調査会社ですか?
英国の調査会社ヴィジョンゲイン社(Visiongain)は、通信とエネルギーのほか、自動車や化学・医薬品、金属など、広範な市場を対象に調査を行っています。自動車市場については、市場全般に関する調査のほ... もっと見る
調査レポートの納品までの日数はどの程度ですか?
在庫のあるものは速納となりますが、平均的には 3-4日と見て下さい。
但し、一部の調査レポートでは、発注を受けた段階で内容更新をして納品をする場合もあります。
発注をする前のお問合せをお願いします。
注文の手続きはどのようになっていますか?
1)お客様からの御問い合わせをいただきます。
2)見積書やサンプルの提示をいたします。
3)お客様指定、もしくは弊社の発注書をメール添付にて発送してください。
4)データリソース社からレポート発行元の調査会社へ納品手配します。
5) 調査会社からお客様へ納品されます。最近は、pdfにてのメール納品が大半です。
お支払方法の方法はどのようになっていますか?
納品と同時にデータリソース社よりお客様へ請求書(必要に応じて納品書も)を発送いたします。
お客様よりデータリソース社へ(通常は円払い)の御振り込みをお願いします。
請求書は、納品日の日付で発行しますので、翌月最終営業日までの当社指定口座への振込みをお願いします。振込み手数料は御社負担にてお願いします。
お客様の御支払い条件が60日以上の場合は御相談ください。
尚、初めてのお取引先や個人の場合、前払いをお願いすることもあります。ご了承のほど、お願いします。
データリソース社はどのような会社ですか?
当社は、世界各国の主要調査会社・レポート出版社と提携し、世界各国の市場調査レポートや技術動向レポートなどを日本国内の企業・公官庁及び教育研究機関に提供しております。
世界各国の「市場・技術・法規制などの」実情を調査・収集される時には、データリソース社にご相談ください。
お客様の御要望にあったデータや情報を抽出する為のレポート紹介や調査のアドバイスも致します。
|
|

