幹細胞技術と応用市場レポート:2022-2032
Stem Cell Technologies and Applications Market Report 2022-2032
レポート詳細
幹細胞技術と応用市場レポート 2022-2032 :本レポートは、新たな収益ポケットを目指すリーディングカンパニーが、業界とその背景にあるダイナミクスをより良く理解するために、非常に貴... もっと見る
※上記価格は部署ライセンス(Departmental licence)価格です。
その他の価格についてはデータリソースまでお問合せください。
日本語のページは自動翻訳を利用し作成しています。
実際のレポートは英文のみでご納品いたします。
サマリー
レポート詳細
幹細胞技術と応用市場レポート 2022-2032:本レポートは、新たな収益ポケットを目指すリーディングカンパニーが、業界とその背景にあるダイナミクスをより良く理解するために、非常に貴重なものとなるでしょう。また、異業種への進出や新地域での既存事業の拡大を目指す企業にとっても有用なレポートです。
幹細胞臨床試験の増加
近年、幹細胞研究とその臨床応用の両方が大きく広がっている。米国国立衛生研究所(NIH)のデータベースでは、登録された臨床試験のうち、実施状況不明を除いた374件が報告されています。幹細胞を用いた臨床実験は、近年、発展途上にあるこの分野の流れを大きく変えています。多くのチームが、骨髄や臍帯血の幹細胞を免疫疾患や血液疾患への最先端の応用として開発し、その役割を広げ続けている一方で、他の多くのチームは、骨髄や臍帯血に見られる様々な種類の幹細胞、特に間葉系幹細胞を、自身の系統の細胞を置き換えることによって解決できる用途を超えて、応用範囲を広げようと模索しています。他の成体幹細胞、特に脳幹細胞は、研究チームによって、系列内の細胞置換や細胞外因子のいずれかが良い影響を与える可能性のある疾患の治療に、より頻繁に使用されるようになってきています。MSCの臨床試験の大部分は同種細胞を用いたものであり、これらの試験は米国、欧州、中国を中心に世界的に行われている。しかし、臨床試験が増加し、これらの試験を実施するために多額の投資が行われているにもかかわらず、これらの試験の商業化は遅れており、この業界のすべての株主にとって懸念すべき問題です。
マーケットリサーチレポートを購入する前に、どのような質問をすべきでしょうか?
- 幹細胞技術と応用市場はどのように進化しているのか?
- 何が幹細胞技術と応用市場を牽引し、阻害しているのか?
- 各幹細胞技術と応用のサブマーケットセグメントは予測期間中にどのように成長し、これらのサブマーケットが2032年にどれだけの収益を占めるようになるのだろうか?
- 2022年から2032年にかけて、各幹細胞技術と応用のサブマーケットの市場シェアはどのように推移するのだろうか?
- 2022年から2032年にかけて、市場全体の主な牽引役となるのは何なのか?
- 幹細胞技術と応用の主要市場はマクロ経済の動きに概ね追随するのか、それとも個々の国別市場が他を凌駕するのか?
- 2032年までに各国市場のシェアはどのように変化し、どの地域が2032年の市場をリードするのだろうか?
- 主要プレイヤーは誰か、また予測期間中の見込みは?
- これらのリーディングカンパニーが取り組んでいる幹細胞技術と応用のプロジェクトはどのようなものか?
- 2020年から2032年にかけて、業界はどのように発展していくのか?現在、そして今後10年間に行われる幹細胞技術と応用プロジェクトにはどのような意味があるのでしょうか?
- 幹細胞技術と応用の市場をさらに拡大するために、製品の商業化の必要性は高まっているのだろうか?
- 幹細胞技術と応用の市場はどこへ向かい、どのようにすれば市場の最前線に立つことができるのか?
- 新製品やサービスラインに対する最適な投資オプションは何か?
- 企業を新たな成長軌道に乗せ、C-suiteに移行させるための重要な展望とは?
このことが、現在、そして今後10年間の幹細胞技術と応用市場にどのような影響を与えるかを知る必要があります。
- 本レポートは355ページにわたり、170の表と221のグラフを掲載しています。
- このレポートでは、業界における主要な収益性の高い分野に焦点を当て、お客様が今すぐターゲットとできるような情報を提供しています。
- 世界、地域、国別の売上高と成長率を詳細に分析しています。
- 競合他社が成功した主なトレンド、変化、収益予測をハイライトしています。
本レポートは、幹細胞技術と応用市場が今後10年間にどのように発展し、COVID-19の景気後退と回復の変動に伴って変化していくかを教えてくれる。この市場は、過去10年間のどの時点よりも、今がより重要なのです。
2032年までの予測やその他の分析により、商業的な展望が見えてくる
- 2032年までの収益予測に加え、直近の実績、成長率、市場シェアもご覧いただけます。
- ビジネスの展望や展開など、独自の分析もご覧いただけます。
- 定性的分析(市場ダイナミクス、ドライバー、機会、阻害要因、課題など)、コスト構造、幹細胞技術と応用の価格上昇の影響、最近の開発状況をご覧いただけます。
本レポートでは、COVID-19が業界と貴社にどのような影響を与えるかについて、データ分析と貴重な洞察を掲載しています。本レポートでは、COVID-19の4つの回収パターンとその影響、すなわち「V」、「L」、「W」、「U」について論じています。
報告書の対象セグメント
タイプ別市場セグメント
- 同種幹細胞療法
- 自家幹細胞療法
細胞源別市場セグメント
- 脂肪組織由来MSCs
- 骨髄由来MSC
- 胎盤・臍帯由来MSC
製品別市場セグメント
- 成体幹細胞
- 人体幹細胞
- 人工多能性幹細胞
- 極小胚様幹細胞
技術別市場セグメント
- 細胞取得
- 細胞生産
- 凍結保存
- 拡大培養・サブカルチャー
- その他の技術
用途別市場セグメント
- 癌
- 循環器系疾患
- 神経系疾患
- 炎症性疾患および自己免疫疾患
- 筋骨格系疾患
- その他の用途
世界市場全体とセグメントの収益予測に加え、4地域と主要20カ国市場の収益予測も掲載しています。
北米
- アメリカ
- カナダ
欧州
- ドイツ
- スペイン
- イギリス
- フランス
- イタリア
- その他の地域
アジア太平洋地域
- 中国
- 日本
- インド
- オーストラリア
- 韓国
- その他のアジア太平洋地域
ラテンアメリカ
- ブラジル
- メキシコ
- その他のラテンアメリカ地域
中近東・アフリカ
- トルコ
- 南アフリカ
- UAE
- その他の中近東・アフリカ
幹細胞技術と応用市場の2022年から2032年にかけての主要企業のプロファイルと、この分野の企業の事業に焦点を当てた内容も含まれています。
主要企業と市場成長の可能性
・ Athersys, Inc.
・ Biorestorative Therapies, Inc.
・ BrainStorm Cell Limited
・ Cellaïon SA
・ Cellular Biomedicine Group, Inc.
・ Cynata Therapeutics Limited
・ Gamida Cell Ltd.
・ Kangstem Biotech Co., Ltd.
・ Mesoblast Limited
・ Pluristem Therapeutics Inc.
・ Plus Therapeutics, Inc.
・ Sangamo Therapeutics, Inc.
・ StemCell Technologies Inc.
・ Vericel Corporation
・ ViaCyte, Inc.
幹細胞技術と応用市場の世界全体の収益、2022年から2032年まで金額ベースで、市場は2022年に9,922百万米ドルを超えると、我々の仕事は計算されます。また、2032年までの売上高成長率を予測。このレポートでは、どの企業が最も大きな可能性を持っているのかを明らかにします。彼らの能力、進歩、商業的展望を知ることで、一歩先を行くことができます。
幹細胞技術と応用市場、2022年から2032年までのレポートはどのように役立つのでしょうか?
350ページを超えるレポートでは、要約すると以下のような知識を得ることができます。
- 幹細胞技術と応用市場の2032年までの収益予測、タイプ、細胞ソース、製品、技術、アプリケーション、企業規模をそれぞれ世界と地域レベルで予測 - 業界の展望を発見し、投資と収益に最も有利な場所を見つけることができます。
- 4つの地域と20の主要国市場の2032年までの収益予測 - 北米、欧州、アジア太平洋、中南米、中東&アフリカの幹細胞技術とアプリケーション市場の2022年から2032年までの予測をご覧いただけます。また、米国、カナダ、メキシコ、ブラジル、ドイツ、フランス、英国、イタリア、中国、インド、日本、オーストラリアなどの主要経済圏の市場も予測されています。
- 幹細胞技術とアプリケーション市場に関わる主要企業15社の企業プロファイルを含む、2022年から2032年までの既存企業および市場参入を目指す企業の展望。
定量的・定性的な分析と独自の予測をご覧いただけます。私たちのレポートだけが持つ情報を入手し、貴重なビジネスインテリジェンスを得ることができます。
他にはない情報
私たちの新しいレポートがあれば、知識の遅れを取り戻し、チャンスを逃す可能性が低くなります。私たちの研究が貴社の研究、分析、意思決定にどのように役立つかをご覧ください。Visiongainの研究は、幹細胞技術と応用市場、2022年から2032年、市場をリードする企業のための商業分析を必要とするすべての人のためのものです。データ、トレンド、予測をご覧いただけます。
ページTOPに戻る
目次
目次
1.レポートの概要
1.1 研究の目的
1.2 幹細胞技術と応用市場の紹介
1.3 本レポートが提供するもの
1.4 本レポートを読むべき理由
1.5 本分析レポートが回答する主な質問事項
1.6 本レポートは誰のためのものなのか?
1.7 方法論
1.7.1 市場の定義
1.7.2 市場評価・予測手法
1.7.3 データの検証
1.8 よくある質問と回答(FAQ)
1.9 関連するVisiongainレポート
1.10 Visiongainについて
2 エグゼクティブサマリー
2.1 地域別スナップショット幹細胞技術と応用の世界市場
2.2 タイプ別セグメント市場魅力度指数
2.3 細胞源セグメント:市場魅力度指標
2.4 製品セグメント市場魅力度指標
2.5 技術セグメント:5 技術セグメント:市場魅力度指標
2.6 アプリケーションセグメント市場魅力度指標
3 市場の概要
3.1 主要な調査結果
3.2 マーケットダイナミクス
3.2.1 市場の推進要因
3.2.2 市場の抑制要因
3.2.3 市場機会
3.3 サプライチェーン
3.4 バリューチェーン
3.5 コビド19の影響分析
3.5.1 幹細胞移植を受ける人々に対するコビド-19のリスク
3.6 ポーターのファイブフォース分析
3.6.1 供給者パワー
3.6.2 バイヤーパワー
3.6.3 競争相手との競合
3.6.4 代替品による脅威
3.6.5 新規参入者の脅威
3.7 環境要因分析
3.7.1 政治的要因
3.7.2 経済的要因
3.7.3 社会的要因
3.7.4 技術的要因
4 世界の幹細胞技術と応用市場分析:タイプ別
4.1 主な調査結果
4.2 タイプ別の成長展望
4.3 タイプ別セグメント市場魅力度指数
4.4 幹細胞技術と応用の世界市場タイプ別シェア、2022年&2032年
4.5 幹細胞技術と応用の世界市場:タイプ別
4.6 アロジェニックセグメント市場
4.6.1 癌と心血管疾患の有病率の増加
4.6.2 同種幹細胞治療のタイプ別世界市場
4.6.3 同系統幹細胞治療の世界市場:地域別
4.7 自己幹細胞セグメント市場
4.7.1 癌の発生頻度の上昇
4.7.2 自己幹細胞療法の世界市場予測
4.7.3 自己幹細胞療法の世界市場:地域別
5 世界の幹細胞技術と応用市場分析:細胞源別
5.1 主な調査結果
5.2 細胞源セグメントの成長展望
5.3 細胞源セグメント市場魅力度指数
5.4 幹細胞技術・アプリケーションの世界市場シェア:細胞源別、2022年&2032年
5.5 細胞源別の幹細胞技術・用途の世界市場
5.6 脂肪組織由来MSCsセグメント市場予測
5.6.1 ソースとインプリケーション
5.6.2 組織修復のための臨床応用
5.6.3 脂肪組織由来MSCの世界市場展望
5.6.4 脂肪組織由来MSCの世界市場:地域別
5.7 骨髄由来MSCのセグメント別市場展望
5.7.1 骨髄の概念
5.7.2 新たな技術
5.7.3 骨髄由来MSCの世界市場展望
5.7.4 骨髄由来MSCの世界市場:地域別
5.8 胎盤/臍帯由来MSCのセグメント別市場展望
5.8.1 胎盤/臍帯由来MSCの市場展望
5.8.2 治療の可能性
5.8.3 プラセンタ/臍帯由来MSCの世界市場予測
5.8.4 世界の胎盤/臍帯由来MSCの地域別市場予測
6 世界の幹細胞技術と応用市場分析:製品別
6.1 主な調査結果
6.2 製品セグメント別の成長展望
6.3 製品セグメント市場魅力度指数
6.4 幹細胞技術・応用の世界市場シェア:製品別、2022年&2032年
6.5 幹細胞技術・応用の世界製品別市場推移
6.6 成体幹細胞セグメントの市場展望
6.6.1 盛り上がるアプリケーション分野
6.6.2 成人幹細胞の世界市場展望
6.6.3 成人幹細胞の世界地域別市場予測
6.7 ヒト胚性幹細胞セグメント市場予測、2021年~2031年
6.7.1 研究開発活動の活発化
6.7.2 ヒト胚性幹細胞の世界市場予測
6.7.3 世界のヒト胚性幹細胞地域別市場予測
6.8 人工多能性幹細胞セグメントの市場予測、2021年~2031年
6.8.1 政府の好意的な支援
6.8.2 人工多能性幹細胞の世界市場予測
6.8.3 人工多能性幹細胞の世界市場予測:地域別
6.9 極小胚様幹細胞
6.9.1 超小型胚様幹細胞の世界市場予測
6.9.2 極小胚様幹細胞の世界地域別市場展望
7 世界の幹細胞技術と応用市場分析:技術別
7.1 主な調査結果
7.2 テクノロジーセグメントの成長展望
7.3 技術セグメント市場魅力度指数
7.4 幹細胞技術・アプリケーションの世界市場シェア:技術別、2022年&2032年
7.5 幹細胞技術・応用の世界市場:技術別シェア
7.6 細胞取得セグメントの市場展望
7.6.1 細胞取得の世界市場予測
7.6.2 細胞取得の世界市場:地域別
7.7 細胞生産セグメントの市場展望
7.7.1 幹細胞製品開発のための企業による研究開発の活発化
7.7.2 細胞生産の世界市場展望
7.7.3 細胞生産の世界市場:地域別
7.8 凍結保存セグメントの市場展望
7.8.1 研究・医療用途の急増
7.8.2 低温保存の世界市場展望
7.8.3 凍結保存の世界市場:地域別
7.9 拡張・サブカルチャーセグメント市場展望
7.9.1 サブカルチャー
7.9.2 慢性疾患の増加
7.9.3 拡張・サブカルチャー世界市場展望
7.9.4 拡張・サブカルチャーの世界地域別市場展望
7.10 その他技術の市場展望
7.10.1 その他技術の世界市場展望
7.10.2 その他技術の世界地域別市場展望
8 世界の幹細胞技術と応用市場分析:用途別
8.1 主な調査結果
8.2 用途セグメントの成長展望
8.3 用途セグメント市場魅力度指数
8.4 幹細胞技術・アプリケーションの世界市場シェア:用途別、2022年&2032年
8.4.1 幹細胞技術・アプリケーションの世界市場シェア用途別
8.5 治療応用分野の市場展望
8.5.1 循環器系疾患の増加
8.5.2 幹細胞技術のパーキンソン病治療への応用
8.5.1 がんセグメントの市場予測
8.5.2 循環器セグメントの市場予測
8.5.3 中枢神経セグメントの市場予測
8.5.4 炎症性・自己免疫性疾患セグメントの市場展望
8.5.5 筋骨格系疾患セグメントの市場予測
8.6 非治療用途セグメントの市場展望
8.6.1 幹細胞治療に対する認知度の向上が幹細胞バンクの成長を促進する
8.6.2 その他の用途の世界市場予測
8.6.3 その他の用途の世界市場:地域別
9 世界の幹細胞技術と応用市場分析:地域別
9.1 主な調査結果
9.2 概要
9.3 幹細胞技術と応用の世界地域別市場魅力度指数
9.4 幹細胞技術と応用の世界市場シェアアプリケーション別、2022年&2032年
9.5 幹細胞技術と応用の世界市場予測
9.5.1 幹細胞技術と応用の世界市場展望
9.5.2 幹細胞技術と応用の世界市場予測(ポストCoViD-19)
9.6 幹細胞技術と応用の世界市場地域別
9.6.1 幹細胞技術と応用の世界地域別市場予測
9.6.2 幹細胞技術と応用の世界地域別市場予測(ポストCoViD-19)
10 北米の幹細胞技術と応用市場分析
10.1 主な調査結果
10.2 北米幹細胞技術・応用市場の魅力度指標
10.3 癌の有病率の上昇
10.4 北米の幹細胞技術と応用市場規模予測・予想
10.5 北米の幹細胞技術と応用国別市場規模予測・予想
10.6 北米の幹細胞技術と応用のタイプ別市場規模予測・予想
10.7 北米の幹細胞技術と応用の細胞源別市場規模予測・予想
10.8 北米の幹細胞技術と応用の製品別市場規模予測・予測
10.9 北米の幹細胞技術と応用の市場規模予測・予測:技術別
10.10 北米の幹細胞技術と応用の市場規模予測・用途別予測
10.11 米国幹細胞技術と応用市場予測
10.11.1 成長するバイオテクノロジー分野と幹細胞研究の増加
10.12 カナダの幹幹細胞技術と応用市場展望
10.12.1 成長するバイオテクノロジー分野と増加する幹細胞研究
11 欧州の幹細胞技術と応用市場分析
11.1 主な調査結果
11.2 欧州の幹細胞技術と応用の市場魅力度指数
11.3 欧州の幹細胞技術と応用の市場規模予測・予想:金額別
11.4 欧州の幹細胞技術と応用の国別市場規模予測・予測
11.5 欧州の幹細胞技術と応用の市場規模予測・タイプ別予測
11.6 欧州の幹細胞技術と応用の市場規模予測・予測:細胞源別
11.7 欧州の幹細胞技術と応用の製品別市場規模予測・予測
11.8 欧州の幹細胞技術と応用の技術別市場規模予測・予測
11.9 欧州の幹細胞技術と応用の市場規模予測・用途別予測
11.10 ドイツの幹細胞技術と応用市場規模予測
11.10.1 技術進歩の高まりが市場成長を支える
11.11 イギリスの幹細胞技術と応用市場展望
11.11.1 研究開発の活発化
11.12 フランスの幹細胞技術と応用市場予測、2021-2031年
11.12.1 希少疾患に対する新しい幹細胞製品の導入
11.13 イタリアの幹細胞技術と応用市場予測
11.13.1 治験の増加
11.14 スペイン幹細胞技術と応用市場予測
11.14.1 研究開発の活発化
11.15 欧州以外の幹細胞技術と応用市場予測(、2021-2031年
11.15.1 新規・革新的技術へのニーズが高まる
11.15.2 ロシア幹細胞技術と応用市場予測
12 アジア太平洋地域の幹細胞技術と応用市場分析
12.1 主な調査結果
12.2 アジア太平洋地域の幹細胞技術と応用市場魅力度指数
12.3 高齢化社会の到来
12.4 アジア太平洋地域の幹細胞技術と応用市場規模予測・予想:金額別
12.5 アジア太平洋地域の幹細胞技術と応用の国別市場規模予測・予想
12.6 アジア太平洋地域の幹細胞技術と応用の市場規模予測・タイプ別予測
12.7 アジア太平洋地域の幹細胞技術と応用の市場規模予測・予測:細胞源別
12.8 アジア太平洋地域の幹細胞技術と応用の製品別市場規模予測・予測
12.9 アジア太平洋地域の幹細胞技術と応用の技術別市場規模予測・予測
12.10 アジア太平洋地域の幹細胞技術と応用の市場規模予測・用途別予測
12.11 日本幹細胞技術と応用市場予測
12.11.1 政府の好意的な政策
12.12 中国の幹細胞技術と応用の市場展望
12.12.1 中国における細胞・遺伝子治療(CGT)の展望
12.13 インド幹細胞技術と応用の市場展望
12.13.1 研究開発の活発化
12.14 韓国幹細胞技術と応用の市場展望
12.14.1 HK inno.N(韓国)とGC Cell(韓国)が新規細胞治療創出のための共同研究開発契約に調印
12.15 オーストラリア幹細胞技術と応用市場予測
12.15.1 幹細胞技術と応用市場に参入する企業の増加
12.16 アジア太平洋地域の幹細胞技術と応用市場展望
12.16.1 政府の好意的な支援
13 ラテンアメリカの幹細胞技術と応用市場分析
13.1 主な調査結果
13.2 ラテンアメリカの幹細胞技術と応用の市場魅力度指数
13.3 ラテンアメリカの幹細胞技術と応用市場規模予測・予想:金額別
13.4 ラテンアメリカの幹細胞技術と応用の国別市場規模予測・予想
13.5 ラテンアメリカの幹細胞技術と応用の市場規模予測・種類別予測
13.6 ラテンアメリカの幹細胞技術と応用の市場規模予測・予測:細胞源別
13.7 ラテンアメリカの幹細胞技術と応用の市場規模予測・予測:製品別
13.8 ラテンアメリカの幹細胞技術と応用の市場規模予測・予測:技術別
13.9 ラテンアメリカの幹細胞技術と応用の市場規模予測・用途別予測
13.10 ブラジル幹細胞技術と応用市場予測
13.11 メキシコの幹細胞技術と応用の市場展望
13.12 その他のラテンアメリカの幹細胞技術と応用の市場展望
14 中東・アフリカの幹細胞技術と応用市場分析
14.1 主な調査結果
14.2 中東・アフリカの幹細胞技術と応用の市場魅力度指数
14.3 中東・アフリカの幹細胞技術と応用の市場規模予測・予想:金額別
14.4 中東・アフリカの幹細胞技術と応用の国別市場規模予測・予想
14.5 中東・アフリカの幹細胞技術と応用の市場規模予測・タイプ別予測
14.6 中東・アフリカの幹細胞技術と応用の市場規模予測・予測:細胞源別
14.7 中東・アフリカの幹細胞技術と応用の製品別市場規模予測・予想
14.8 中東・アフリカの幹細胞技術と応用の技術別市場規模予測・予測
14.9 中東・アフリカの幹細胞技術と応用の市場規模予測・用途別予測
14.10 UAE幹細胞技術と応用の市場規模予測
14.11 南アフリカの幹細胞技術と応用市場予測
14.12 トルコの幹細胞技術と応用市場予測
14.13 その他のMEAの幹細胞技術と応用の市場展望
15 競合他社の状況
15.1 企業シェア分析
15.2 主要事業戦略分析-買収
15.3 主要事業戦略分析-契約
15.4 主要事業戦略分析-承認
15.5 主要事業戦略分析-協業
15.6 主要事業戦略分析-契約
15.7 主要事業戦略分析-拡大
15.8 主要事業戦略分析-投資
15.9 主要事業戦略分析-合弁事業
15.10 主要事業戦略分析-合併
15.11 主要事業戦略分析-新製品上市
15.12 主要事業戦略分析-パートナーシップ
16 主要企業のプロフィール
16.1 パイプライン分析
16.1 Athersys, Inc.
16.1.1 企業スナップショット
16.1.2 会社概要
16.1.3 財務分析
16.1.4 製品ベンチマーク
16.1.5 戦略的展望
16.2 Mesoblast Limited
16.2.1 会社概要
16.2.2 会社概要
16.2.3 財務分析
16.2.4 製品ベンチマーク
16.2.5 戦略的展望
16.3 Cellular Biomedicine Group, Inc.
16.3.1 企業スナップショット
16.3.2 会社概要
16.3.3 財務分析
16.3.4 製品ベンチマーク
16.3.5 戦略的展望
16.4 Cynata Therapeutics Limited
16.4.1 企業スナップショット
16.4.2 会社概要
16.4.3 財務分析
16.4.4 製品ベンチマーク
16.4.5 戦略的な展望
16.5 Plus Therapeutics, Inc.
16.5.1 企業スナップショット
16.5.2 会社概要
16.5.3 財務分析
16.5.4 製品ベンチマーク
16.5.5 戦略的な展望
16.6 Biorestorative Therapies, Inc.
16.6.1 企業スナップショット
16.6.2 会社概要
16.6.3 財務分析
16.6.4 製品ベンチマーク
16.6.5 戦略的な展望
16.7 Pluristem Therapeutics Inc.
16.7.1 企業スナップショット
16.7.2 会社概要
16.7.3 財務分析
16.7.4 製品ベンチマーク
16.7.5 戦略的展望
16.8 Cellaïon SA
16.8.1 企業スナップショット
16.8.2 会社概要
16.8.3 財務分析
16.8.4 製品ベンチマーク
16.8.5 戦略的な展望
16.9 Sangamo Therapeutics, Inc.
16.9.1 企業スナップショット
16.9.2 会社概要
16.9.3 財務分析
16.9.4 製品ベンチマーク
16.9.5 戦略的な展望
16.10 StemCell Technologies Inc.
16.10.1 企業スナップショット
16.10.2 会社概要
16.10.3 財務分析
16.10.4 製品ベンチマーク
16.10.5 戦略的展望
16.11 Vericel Corporation
16.11.1 企業スナップショット
16.11.2 会社概要
16.11.3 財務分析
16.11.4 製品ベンチマーク
16.11.5 戦略的な展望
16.12 BrainStorm Cell Limited.
16.12.1 企業スナップショット
16.12.2 会社概要
16.12.3 財務分析
16.12.4 製品ベンチマーク
16.12.5 戦略的展望
16.13 Gamida Cell Ltd.
16.13.1 企業スナップショット
16.13.2 会社概要
16.13.3 財務分析
16.13.4 製品ベンチマーク
16.13.5 戦略的展望
16.14 ViaCyte, Inc.
16.14.1 企業スナップショット
16.14.2 会社概要
16.14.3 財務分析
16.14.4 製品ベンチマーク
16.14.5 戦略的展望
16.15 Kangstem Biotech Co., Ltd.
16.15.1 企業スナップショット
16.15.2 会社概要
16.15.3 財務分析
16.15.4 製品ベンチマーク
16.15.5 戦略的展望
17 結論と提言
17.1 ビジョンゲインからの結論
17.2 市場関係者への提言
表の一覧
Table 1 Global Stem Cell Technologies and Applications Market Snapshot, 2022 & 2032 (US$Million, CAGR %)
Table 2 Global Stem Cell Banks and Region
Table 3 Global Stem Cell Technologies and Applications Market by Region, 2022-2032 (US$ Mn, AGR (%), CAGR (%)): “V” Shaped Recovery Scenario
Table 4 Global Stem Cell Technologies and Applications Market by Region, 2022-2032 (US$ Mn, AGR (%), CAGR (%)): “U” Shaped Recovery Scenario
Table 5 Global Stem Cell Technologies and Applications Market by Region, 2022-2032 (US$ Mn, AGR (%), CAGR (%)): “W” Shaped Recovery Scenario
Table 6 Global Stem Cell Technologies and Applications Market by Region, 2022-2032 (US$ Mn, AGR (%), CAGR (%)): “L” Shaped Recovery Scenario
Table 7 Global Stem Cell Technologies & Applications Market by Type, 2022-2032 (US$ Mn, AGR (%), CAGR (%))
Table 8 Global Allogeneic Stem Cell Therapy Market Forecast, 2022-2032 (US$ Mn, AGR (%), CAGR (%))
Table 9 Global Allogeneic Stem Cell Therapy Market by Region, 2022-2032 (US$ Mn, AGR (%), CAGR (%))
Table 10 Global Autologous Stem Cell Therapy Market Forecast, 2022-2032 (US$ Mn, AGR (%), CAGR (%))
Table 11 Global Autologous Stem Cell Therapy Market by Region, 2022-2032 (US$ Mn, AGR (%), CAGR (%))
Table 12 Global Stem Cell Technologies & Applications Market by Cell Source, 2022-2032 (US$ Mn, AGR (%), CAGR (%))
Table 13 Global Adipose tissue-derived MSCs Market Forecast, 2022-2032 (US$ Mn, AGR (%), CAGR (%))
Table 14 Global Adipose tissue-derived MSCs Market by Region, 2022-2032 (US$ Mn, AGR (%), CAGR (%))
Table 15 Global Bone marrow-derived MSCs Market Forecast, 2022-2032 (US$ Mn, AGR (%), CAGR (%))
Table 16 Global Bone marrow-derived MSCs Market by Region, 2022-2032 (US$ Mn, AGR (%), CAGR (%))
Table 17 Global Placental/umbilical cord-derived MSCs Market Forecast, 2022-2032 (US$ Mn, AGR (%), CAGR (%))
Table 18 Global Placental/umbilical cord-derived MSCs Market by Region, 2022-2032 (US$ Mn, AGR (%), CAGR (%))
Table 19 Global Stem Cell Technologies & Applications Market by Product, 2022-2032 (US$ Mn, AGR (%), CAGR (%))
Table 20 Global Adult Stem Cells Market Forecast, 2022-2032 (US$ Mn, AGR (%), CAGR (%))
Table 21 Global Adult Stem Cells Market by Region, 2022-2032 (US$ Mn, AGR (%), CAGR (%))
Table 22 Global Human Embryonic Stem Cells Market Forecast, 2022-2032 (US$ Mn, AGR (%), CAGR (%))
Table 23 Global Human Embryonic Stem Cells Market by Region, 2022-2032 (US$ Mn, AGR (%), CAGR (%))
Table 24 Global Induced Pluripotent Stem Cells Market Forecast, 2022-2032 (US$ Mn, AGR (%), CAGR (%))
Table 25 Global Induced Pluripotent Stem Cells Market by Region, 2022-2032 (US$ Mn, AGR (%), CAGR (%))
Table 26 Global Very Small Embryonic Like Stem Cells Market Forecast, 2022-2032 (US$ Mn, AGR (%), CAGR (%))
Table 27 Global Very Small Embryonic Like Stem Cells Market by Region, 2022-2032 (US$ Mn, AGR (%), CAGR (%))
Table 28 Global Stem Cell Technologies & Applications Market by Technology, 2022-2032 (US$ Mn, AGR (%), CAGR (%))
Table 29 Global Cell Acquisition Market Forecast, 2022-2032 (US$ Mn, AGR (%), CAGR (%))
Table 30 Global Cell Acquisition Market by Region, 2022-2032 (US$ Mn, AGR (%), CAGR (%))
Table 31 Global Cell Production Market Forecast, 2022-2032 (US$ Mn, AGR (%), CAGR (%))
Table 32 Global Cell Production Market by Region, 2022-2032 (US$ Mn, AGR (%), CAGR (%))
Table 33 Global Cryopreservation Market Forecast, 2022-2032 (US$ Mn, AGR (%), CAGR (%))
Table 34 Global Cryopreservation Market by Region, 2022-2032 (US$ Mn, AGR (%), CAGR (%))
Table 35 Global Expansion & Sub-Culture Market Forecast, 2022-2032 (US$ Mn, AGR (%), CAGR (%))
Table 36 Global Expansion & Sub-Culture Market by Region, 2022-2032 (US$ Mn, AGR (%), CAGR (%))
Table 37 Global Other Technology Market Forecast, 2022-2032 (US$ Mn, AGR (%), CAGR (%))
Table 38 Global Other Technology Market by Region, 2022-2032 (US$ Mn, AGR (%), CAGR (%))
Table 39 Global Stem Cell Technologies & Applications Market by Application, 2022-2032 (US$ Mn, AGR (%), CAGR (%))
Table 40 Global Cancer Market Forecast, 2022-2032 (US$ Mn, AGR (%), CAGR (%))
Table 41 Global Cancer Market by Region, 2022-2032 (US$ Mn, AGR (%), CAGR (%))
Table 42 Global Cardiovascular Diseases Market Forecast, 2022-2032 (US$ Mn, AGR (%), CAGR (%))
Table 43 Global Cardiovascular Diseases Market by Region, 2022-2032 (US$ Mn, AGR (%), CAGR (%))
Table 44 Global Neurological Disorders Market Forecast, 2022-2032 (US$ Mn, AGR (%), CAGR (%))
Table 45 Global Neurological Disorders Market by Region, 2022-2032 (US$ Mn, AGR (%), CAGR (%))
Table 46 Global Inflammatory & Autoimmune Diseases Market Forecast, 2022-2032 (US$ Mn, AGR (%), CAGR (%))
Table 47 Global Inflammatory & Autoimmune Diseases Market by Region, 2022-2032 (US$ Mn, AGR (%), CAGR (%))
Table 48 Global Musculoskeletal Disorders Market Forecast, 2022-2032 (US$ Mn, AGR (%), CAGR (%))
Table 49 Global Musculoskeletal Disorders Market by Region, 2022-2032 (US$ Mn, AGR (%), CAGR (%))
Table 50 Global Other Applications Market Forecast, 2022-2032 (US$ Mn, AGR (%), CAGR (%))
Table 51 Global Other Applications Market by Region, 2022-2032 (US$ Mn, AGR (%), CAGR (%))
Table 52 Global Stem Cell Technologies & Applications Market Forecast, 2022-2032 (US$ Mn, AGR (%), CAGR (%))
Table 53 Global Stem Cell Technologies & Applications Market Forecast, 2022-2032 (US$ Mn, AGR (%), CAGR (%)) (V-Shaped Recovery Scenario)
Table 54 Global Stem Cell Technologies & Applications Market Forecast, 2022-2032 (US$ Mn, AGR (%), CAGR (%)) (W-Shaped Recovery Scenario)
Table 55 Global Stem Cell Technologies & Applications Market Forecast, 2022-2032 (US$ Mn, AGR (%), CAGR (%)) (U-Shaped Recovery Scenario)
Table 56 Global Stem Cell Technologies & Applications Market Forecast, 2022-2032 (US$ Mn, AGR (%), CAGR (%)) (L-Shaped Recovery Scenario)
Table 57 Global Stem Cell Technologies & Applications Market by Region, 2022-2032 (US$ Mn, AGR (%), CAGR (%))
Table 58 Global Stem Cell Technologies & Applications Market by Region, 2022-2032 (US$ Mn, AGR (%), CAGR (%)) (V-Shaped Recovery Scenario)
Table 59 Global Stem Cell Technologies & Applications Market by Region, 2022-2032 (US$ Mn, AGR (%), CAGR (%)) (W-Shaped Recovery Scenario)
Table 60 Global Stem Cell Technologies & Applications Market by Region, 2022-2032 (US$ Mn, AGR (%), CAGR (%)) (U-Shaped Recovery Scenario)
Table 61 Global Stem Cell Technologies & Applications Market by Region, 2022-2032 (US$ Mn, AGR (%), CAGR (%)) (L-Shaped Recovery Scenario)
Table 62 North America Stem Cell Technologies & Applications Market, 2022-2032 (US$ Mn, AGR (%), CAGR (%))
Table 63 North America Stem Cell Technologies & Applications Market by Country, 2022-2032 (US$ Mn, AGR (%), CAGR (%))
Table 64 North America Stem Cell Technologies & Applications Market by Type, 2022-2032 (US$ Mn, AGR (%), CAGR (%))
Table 65 North America Stem Cell Technologies & Applications Market by Cell Source, 2022-2032 (US$ Mn, AGR (%), CAGR (%))
Table 66 North America Stem Cell Technologies & Applications Market by Product, 2022-2032 (US$ Mn, AGR (%), CAGR (%))
Table 67 North America Stem Cell Technologies & Applications Market by Technology, 2022-2032 (US$ Mn, AGR (%), CAGR (%))
Table 68 North America Stem Cell Technologies & Applications Market by Application, 2022-2032 (US$ Mn, AGR (%), CAGR (%))
Table 69 US Stem Cell Technologies & Applications Market by Value, 2022-2032 (US$ Mn, AGR (%), CAGR (%))
Table 70 Canada Stem Cell Technologies & Applications Market by Value, 2022-2032 (US$ Mn, AGR (%), CAGR (%))
Table 71 Europe Stem Cell Technologies & Applications Market by Value, 2022-2032 (US$ Mn, AGR (%), CAGR (%))
Table 72 Europe Stem Cell Technologies & Applications Market by Country, 2022-2032 (US$ Mn, AGR (%), CAGR (%))
Table 73 Europe Stem Cell Technologies & Applications Market by Type, 2022-2032 (US$ Mn, AGR (%), CAGR (%))
Table 74 Europe Stem Cell Technologies & Applications Market by Cell Source, 2022-2032 (US$ Mn, AGR (%), CAGR (%))
Table 75 Europe Stem Cell Technologies & Applications Market by Product, 2022-2032 (US$ Mn, AGR (%), CAGR (%))
Table 76 Europe Stem Cell Technologies & Applications Market by Technology, 2022-2032 (US$ Mn, AGR (%), CAGR (%))
Table 77 Europe Stem Cell Technologies & Applications Market by Application, 2022-2032 (US$ Mn, AGR (%), CAGR (%))
Table 78 Germany Stem Cell Technologies & Applications Market by Value, 2022-2032 (US$ Mn, AGR (%), CAGR (%))
Table 79 UK Stem Cell Technologies & Applications Market by Value, 2022-2032 (US$ Mn, AGR (%), CAGR (%))
Table 80 France Stem Cell Technologies & Applications Market by Value, 2022-2032 (US$ Mn, AGR (%), CAGR (%))
Table 81 Italy Stem Cell Technologies & Applications Market by Value, 2022-2032 (US$ Mn, AGR (%), CAGR (%))
Table 82 Spain Stem Cell Technologies & Applications Market by Value, 2022-2032 (US$ Mn, AGR (%), CAGR (%))
Table 83 Rest of Europe Stem Cell Technologies & Applications Market by Value, 2022-2032 (US$ Mn, AGR (%), CAGR (%))
Table 84 Asia-Pacific Stem Cell Technologies & Applications Market by Value, 2022-2032 (US$ Mn, AGR (%), CAGR (%))
Table 85 Asia-Pacific Stem Cell Technologies & Applications Market by Country, 2022-2032 (US$ Mn, AGR (%), CAGR (%))
Table 86 Asia-Pacific Stem Cell Technologies & Applications Market by Type, 2022-2032 (US$ Mn, AGR (%), CAGR (%))
Table 87 Asia-Pacific Stem Cell Technologies & Applications Market by Cell Source, 2022-2032 (US$ Mn, AGR (%), CAGR (%))
Table 88 Asia-Pacific Stem Cell Technologies & Applications Market by Product, 2022-2032 (US$ Mn, AGR (%), CAGR (%))
Table 89 Asia-Pacific Stem Cell Technologies & Applications Market by Technology, 2022-2032 (US$ Mn, AGR (%), CAGR (%))
Table 90 Asia-Pacific Stem Cell Technologies & Applications Market by Application, 2022-2032 (US$ Mn, AGR (%), CAGR (%))
Table 91 Japan Stem Cell Technologies & Applications Market by Value, 2022-2032 (US$ Mn, AGR (%), CAGR (%))
Table 92 China Stem Cell Technologies & Applications Market by Value, 2022-2032 (US$ Mn, AGR (%), CAGR (%))
Table 93 India Stem Cell Technologies & Applications Market by Value, 2022-2032 (US$ Mn, AGR (%), CAGR (%))
Table 94 South Korea Stem Cell Technologies & Applications Market by Value, 2022-2032 (US$ Mn, AGR (%), CAGR (%))
Table 95 Australia Stem Cell Technologies & Applications Market by Value, 2022-2032 (US$ Mn, AGR (%), CAGR (%))
Table 96 Rest of Asia-Pacific Stem Cell Technologies & Applications Market by Value, 2022-2032 (US$ Mn, AGR (%), CAGR (%))
Table 97 Latin America Stem Cell Technologies & Applications Market by Value, 2022-2032 (US$ Mn, AGR (%), CAGR (%))
Table 98 Latin America Stem Cell Technologies & Applications Market by Country, 2022-2032 (US$ Mn, AGR (%), CAGR (%))
Table 99 Latin America Stem Cell Technologies & Applications Market by Type, 2022-2032 (US$ Mn, AGR (%), CAGR (%))
Table 100 Latin America Stem Cell Technologies & Applications Market by Cell Source, 2022-2032 (US$ Mn, AGR (%), CAGR (%))
Table 101 Latin America Stem Cell Technologies & Applications Market by Product, 2022-2032 (US$ Mn, AGR (%), CAGR (%))
Table 102 Latin America Stem Cell Technologies & Applications Market by Technology, 2022-2032 (US$ Mn, AGR (%), CAGR (%))
Table 103 Latin America Stem Cell Technologies & Applications Market by Application, 2022-2032 (US$ Mn, AGR (%), CAGR (%))
Table 104 Brazil Stem Cell Technologies & Applications Market by Value, 2022-2032 (US$ Mn, AGR (%), CAGR (%))
Table 105 Mexico Stem Cell Technologies & Applications Market by Value, 2022-2032 (US$ Mn, AGR (%), CAGR (%))
Table 106 Rest of Latin America Stem Cell Technologies & Applications Market by Value, 2022-2032 (US$ Mn, AGR (%), CAGR (%))
Table 107 Middle East & Africa Stem Cell Technologies & Applications Market by Value, 2022-2032 (US$ Mn, AGR (%), CAGR (%))
Table 108 Middle East & Africa Stem Cell Technologies & Applications Market by Country, 2022-2032 (US$ Mn, AGR (%), CAGR (%))
Table 109 Middle East & Africa Stem Cell Technologies & Applications Market by Type, 2022-2032 (US$ Mn, AGR (%), CAGR (%))
Table 110 Middle East & Africa Stem Cell Technologies & Applications Market by Cell Source, 2022-2032 (US$ Mn, AGR (%), CAGR (%))
Table 111 Middle East & Africa Stem Cell Technologies & Applications Market by Product, 2022-2032 (US$ Mn, AGR (%), CAGR (%))
Table 112 Middle East & Africa Stem Cell Technologies & Applications Market by Technology, 2022-2032 (US$ Mn, AGR (%), CAGR (%))
Table 113 Middle East & Africa Stem Cell Technologies & Applications Market by Application, 2022-2032 (US$ Mn, AGR (%), CAGR (%))
Table 114 UAE Stem Cell Technologies & Applications Market by Value, 2022-2032 (US$ Mn, AGR (%), CAGR (%))
Table 115 South Africa Stem Cell Technologies & Applications Market by Value, 2022-2032 (US$ Mn, AGR (%), CAGR (%))
Table 116 Turkey Stem Cell Technologies & Applications Market by Value, 2022-2032 (US$ Mn, AGR (%), CAGR (%))
Table 117 Rest of Middle East & Africa Stem Cell Technologies & Applications Market by Value, 2022-2032 (US$ Mn, AGR (%), CAGR (%))
Table 118 Key Business Strategies Adopted by Key Players in Global Stem Cell Technologies and Applications Market
Table 119 Key Business Strategies Adopted by Key Players in Global Stem Cell Technologies and Applications Market
Table 120 Key Business Strategies Adopted by Key Players in Global Stem Cell Technologies and Applications Market
Table 121 Key Business Strategies Adopted by Key Players in Global Stem Cell Technologies and Applications Market
Table 122 Key Business Strategies Adopted by Key Players in Global Stem Cell Technologies and Applications Market
Table 123 Key Business Strategies Adopted by Key Players in Global Stem Cell Technologies and Applications Market
Table 124 Key Business Strategies Adopted by Key Players in Global Stem Cell Technologies and Applications Market
Table 125 Key Business Strategies Adopted by Key Players in Global Stem Cell Technologies and Applications Market
Table 126 Key Business Strategies Adopted by Key Players in Global Stem Cell Technologies and Applications Market
Table 127 Key Business Strategies Adopted by Key Players in Global Stem Cell Technologies and Applications Market
Table 128 Key Business Strategies Adopted by Key Players in Global Stem Cell Technologies and Applications Market
Table 129 Athersys, Inc.: Key Details, (CEO, HQ, Revenue, Founded, No. of Employees, Company Type, Website, Business Segment)
Table 130 Athersys, Inc.: Product Benchmarking
Table 131 Athersys, Inc.: Strategic Outlook
Table 132 Bristol-Myers Squibb Company: Key Details, (CEO, HQ, Revenue, Founded, No. of Employees, Company Type, Website, Business Segment)
Table 133 Bristol-Myers Squibb Company: Product Benchmarking
Table 134 Cellular Biomedicine Group, Inc. : Key Details, (CEO, HQ, Revenue, Founded, No. of Employees, Company Type, Website, Business Segment)
Table 135 Cellular Biomedicine Group, Inc. : Product Benchmarking
Table 136 Cellular Biomedicine Group, Inc. : Strategic Outlook
Table 137 Cynata Therapeutics Limited: Key Details, (CEO, HQ, Revenue, Founded, No. of Employees, Company Type, Website, Business Segment)
Table 138 Cynata Therapeutics Limited: Product Benchmarking
Table 139 Cynata Therapeutics Limited: Strategic Outlook
Table 140 Plus Therapeutics, Inc.: Key Details, (CEO, HQ, Revenue, Founded, No. of Employees, Company Type, Website, Business Segment)
Table 141 Plus Therapeutics, Inc.: Product Benchmarking
Table 142 Plus Therapeutics, Inc.: Strategic Outlook
Table 143 BioRestorative Therapies, Inc.: Key Details, (CEO, HQ, Revenue, Founded, No. of Employees, Company Type, Website, Business Segment)
Table 144 BioRestorative Therapies, Inc.: Product Benchmarking
Table 145 BioRestorative Therapies, Inc.: Strategic Outlook
Table 146 Pluristem Therapeutics Inc.: Key Details, (CEO, HQ, Revenue, Founded, No. of Employees, Company Type, Website, Business Segment)
Table 147 Pluristem Therapeutics Inc.: Product Benchmarking
Table 148 Pluristem Therapeutics Inc.: Strategic Outlook
Table 149 Cellaïon SA: Key Details, (CEO, HQ, Revenue, Founded, No. of Employees, Company Type, Website, Business Segment)
Table 150 Cellaïon SA: Product Benchmarking
Table 151 Sangamo Therapeutics, Inc.: Key Details, (CEO, HQ, Revenue, Founded, No. of Employees, Company Type, Website, Business Segment)
Table 152 Sangamo Therapeutics, Inc.: Product Benchmarking
Table 153 Sangamo Therapeutics, Inc.: Strategic Outlook
Table 154 StemCell Technologies Inc.: Key Details, (CEO, HQ, Revenue, Founded, No. of Employees, Company Type, Website, Business Segment)
Table 155 StemCell Technologies Inc.: Product Benchmarking
Table 156 StemCell Technologies Inc.: Strategic Outlook
Table 157 Vericel Corporation: Key Details, (CEO, HQ, Revenue, Founded, No. of Employees, Company Type, Website, Business Segment)
Table 158 Vericel Corporation: Product Benchmarking
Table 159 Vericel Corporation: Strategic Outlook
Table 160 BrainStorm Cell Limited. : Key Details, (CEO, HQ, Revenue, Founded, No. of Employees, Company Type, Website, Business Segment)
Table 161 BrainStorm Cell Limited. : Product Benchmarking
Table 162 BrainStorm Cell Limited. : Strategic Outlook
Table 163 Gamida Cell Ltd.: Key Details, (CEO, HQ, Revenue, Founded, No. of Employees, Company Type, Website, Business Segment)
Table 164 Gamida Cell Ltd.: Product Benchmarking
Table 165 Gamida Cell Ltd.: Strategic Outlook
Table 166 ViaCyte, Inc.: Key Details, (CEO, HQ, Revenue, Founded, No. of Employees, Company Type, Website, Business Segment)
Table 167 ViaCyte, Inc.: Product Benchmarking
Table 168 Kangstem Biotech Co., Ltd.: Key Details, (CEO, HQ, Revenue, Founded, No. of Employees, Company Type, Website, Business Segment)
Table 169 Kangstem Biotech Co., Ltd.: Product Benchmarking
Table 170 Kangstem Biotech Co., Ltd.: Strategic Outlook
図の一覧
Figure 1 Global Stem Cell Technologies and Applications Market Segmentation
Figure 2 Global Stem Cell Technologies and Applications Market Forecast by Region: Market Attractiveness Index
Figure 3 Global Stem Cell Technologies and Applications Market by Type: Market Attractiveness Index
Figure 4 Global Stem Cell Technologies and Applications Market by Cell Source: Market Attractiveness Index
Figure 5 Global Stem Cell Technologies and Applications Market by Product: Market Attractiveness Index
Figure 6 Global Stem Cell Technologies and Applications Market by Technology: Market Attractiveness Index
Figure 7 Global Stem Cell Technologies and Applications Market by Application: Market Attractiveness Index
Figure 8 Global Stem Cell Technologies and Applications Market: Market Dynamics
Figure 9 Global COVID Impact Analysis: Stem Cell Technologies and Applications Market Recovery Scenarios 2022-2032 (US$ Mn, CAGR (%))
Figure 10 Global Stem Cell Technologies and Applications Market by Region, 2022-2032 (US$ Mn, AGR (%)): “V” Shaped Recovery
Figure 11 Global Stem Cell Technologies and Applications Market by Region, 2022-2032 (US$ Mn, AGR (%)): “U” Shaped Recovery
Figure 12 Global Stem Cell Technologies and Applications Market by Region, 2022-2032 (US$ Mn, AGR (%)): “W” Shaped Recovery
Figure 13 Global Stem Cell Technologies and Applications Market by Region, 2022-2032 (US$ Mn, AGR (%)): “L” Shaped Recovery
Figure 14 Global Stem Cell Technologies and Applications Market: Porter’s Five Forces Analysis
Figure 15 Global Stem Cell Technologies and Applications Market: PESTLE Analysis
Figure 16 Global Stem Cell Technologies and Applications Market Forecast by Type 2022-2032 (Revenue, CAGR%)
Figure 17 Global Stem Cell Technologies and Applications Market Share Forecast by Type, 2022, 2032 (%)
Figure 18 Global Stem Cell Technologies & Applications Market by Type, 2022-2032 (US$ Mn)
Figure 19 Global Allogeneic Stem Cell Therapy Market Forecast, 2022-2032 (US$ Mn)
Figure 20 Global Allogeneic Stem Cell Therapy Market by Region, 2022-2032 (US$ Mn)
Figure 21 Global Autologous Stem Cell Therapy Market Forecast, 2022-2032 (US$ Mn)
Figure 22 Global Autologous Stem Cell Therapy Market by Region, 2022-2032 (US$ Mn)
Figure 23 Global Stem Cell Technologies and Applications Market Forecast by Cell Source 2022, 2027, 2032 (Revenue, CAGR (%))
Figure 24 Global Stem Cell Technologies and Applications Market Share Forecast by Cell Source, 2022, 2032 (%)
Figure 25 Global Stem Cell Technologies & Applications Market by Cell Source, 2022-2032 (US$ Mn)
Figure 26 Global Adipose tissue-derived MSCs Market Forecast, 2022-2032 (US$ Mn)
Figure 27 Global Adipose tissue-derived MSCs Market by Region, 2022-2032 (US$ Mn)
Figure 28 Global Bone marrow-derived MSCs Market Forecast, 2022-2032 (US$ Mn)
Figure 29 Global Bone marrow-derived MSCs Market by Region, 2022-2032 (US$ Mn)
Figure 30 Global Placental/umbilical cord-derived MSCs Market Forecast, 2022-2032 (US$ Mn)
Figure 31 Global Placental/umbilical cord-derived MSCs Market by Region, 2022-2032 (US$ Mn)
Figure 32 Global Stem Cell Technologies and Applications Market Forecast by Product 2022, 2027, 2032 (Revenue, CAGR (%))
Figure 33 Global Stem Cell Technologies and Applications Market Share Forecast by Product, 2022, 2032 (%)
Figure 34 Global Stem Cell Technologies & Applications Market by Product, 2022-2032 (US$ Mn)
Figure 35 Global Adult Stem Cells Market Forecast, 2022-2032 (US$ Mn)
Figure 36 Global Adult Stem Cells Market by Region, 2022-2032 (US$ Mn)
Figure 37 Global Human Embryonic Stem Cells Market Forecast, 2022-2032 (US$ Mn)
Figure 38 Global Human Embryonic Stem Cells Market by Region, 2022-2032 (US$ Mn)
Figure 39 Global Induced Pluripotent Stem Cells Market Forecast, 2022-2032 (US$ Mn)
Figure 40 Global Induced Pluripotent Stem Cells Market by Region, 2022-2032 (US$ Mn)
Figure 41 Global Very Small Embryonic Like Stem Cells Market Forecast, 2022-2032 (US$ Mn)
Figure 42 Global Very Small Embryonic Like Stem Cells Market by Region, 2022-2032 (US$ Mn)
Figure 43 Global Stem Cell Technologies and Applications Market Forecast by Technology 2022, 2027, 2032 (Revenue, CAGR (%))
Figure 44 Global Stem Cell Technologies and Applications Market Share Forecast by Technology, 2022, 2032 (%)
Figure 45 Global Stem Cell Technologies & Applications Market by Technology, 2022-2032 (US$ Mn)
Figure 46 Global Cell Acquisition Market Forecast, 2022-2032 (US$ Mn)
Figure 47 Global Cell Acquisition Market by Region, 2022-2032 (US$ Mn)
Figure 48 Global Cell Production Market Forecast, 2022-2032 (US$ Mn)
Figure 49 Global Cell Production Market by Region, 2022-2032 (US$ Mn)
Figure 50 Global Cryopreservation Market Forecast, 2022-2032 (US$ Mn)
Figure 51 Global Cryopreservation Market by Region, 2022-2032 (US$ Mn)
Figure 52 Global Expansion & Sub-Culture Market Forecast, 2022-2032 (US$ Mn)
Figure 53 Global Expansion & Sub-Culture Market by Region, 2022-2032 (US$ Mn)
Figure 54 Global Other Technology Market Forecast, 2022-2032 (US$ Mn)
Figure 55 Global Other Technology Market by Region, 2022-2032 (US$ Mn)
Figure 56 Global Stem Cell Technologies and Applications Market Forecast by Application 2022, 2027, 2032 (Revenue, CAGR (%))
Figure 57 Global Stem Cell Technologies and Applications Market Share Forecast by Application, 2022, 2032 (%)
Figure 58 Global Stem Cell Technologies & Applications Market by Application, 2022-2032 (US$ Mn)
Figure 59 Global Cancer Market Forecast, 2022-2032 (US$ Mn)
Figure 60 Global Cancer Market by Region, 2022-2032 (US$ Mn)
Figure 61 Global Cardiovascular Diseases Market Forecast, 2022-2032 (US$ Mn)
Figure 62 Global Cardiovascular Diseases Market by Region, 2022-2032 (US$ Mn)
Figure 63 Global Neurological Disorders Market Forecast, 2022-2032 (US$ Mn)
Figure 64 Global Neurological Disorders Market by Region, 2022-2032 (US$ Mn)
Figure 65 Global Inflammatory & Autoimmune Diseases Market Forecast, 2022-2032 (US$ Mn)
Figure 66 Global Inflammatory & Autoimmune Diseases Market by Region, 2022-2032 (US$ Mn)
Figure 67 Global Musculoskeletal Disorders Market Forecast, 2022-2032 (US$ Mn)
Figure 68 Global Musculoskeletal Disorders Market by Region, 2022-2032 (US$ Mn)
Figure 69 Global Other Applications Market Forecast, 2022-2032 (US$ Mn)
Figure 70 Global Other Applications Market by Region, 2022-2032 (US$ Mn)
Figure 71 Global Stem Cell Technologies and Applications Market Forecast by Region 2022-2032: Market Attractiveness Index
Figure 72 Global Stem Cell Technologies and Applications Market Share Forecast by Application, 2022, 2032 (%)
Figure 73 Global Stem Cell Technologies & Applications Market Forecast, 2022-2032 (US$ Mn)
Figure 74 Global Stem Cell Technologies & Applications Market Forecast, 2022-2032 (US$ Mn, AGR (%)) (V-Shaped Recovery Scenario)
Figure 75 Global Stem Cell Technologies & Applications Market Forecast, 2022-2032 (US$ Mn, AGR (%)) (W-Shaped Recovery Scenario)
Figure 76 Global Stem Cell Technologies & Applications Market Forecast, 2022-2032 (US$ Mn, AGR (%)) (U-Shaped Recovery Scenario)
Figure 77 Global Stem Cell Technologies & Applications Market Forecast, 2022-2032 (US$ Mn, AGR (%)) (L-Shaped Recovery Scenario)
Figure 78 Global Stem Cell Technologies & Applications Market by Region, 2022-2032 (US$ Mn, AGR (%))
Figure 79 Global Stem Cell Technologies & Applications Market by Region, 2022-2032 (US$ Mn, AGR (%)) (V-Shaped Recovery Scenario)
Figure 80 Global Stem Cell Technologies & Applications Market by Region, 2022-2032 (US$ Mn, AGR (%)) (W-Shaped Recovery Scenario)
Figure 81 Global Stem Cell Technologies & Applications Market by Region, 2022-2032 (US$ Mn, AGR (%)) (U-Shaped Recovery Scenario)
Figure 82 Global Stem Cell Technologies & Applications Market by Region, 2022-2032 (US$ Mn, AGR (%)) (L-Shaped Recovery Scenario)
Figure 83 North America Stem Cell Technologies and Applications Market by Country: Market Attractiveness Index
Figure 84 North America Stem Cell Technologies & Applications Market by Value, 2022-2032 (US$ Mn)
Figure 85 North America Stem Cell Technologies & Applications Market by Country, 2022-2032 (US$ Mn)
Figure 86 North America Stem Cell Technologies and Applications Market Share Forecast by Country, 2022 & 2032 (%)
Figure 87 North America Stem Cell Technologies & Applications Market by Type, 2022-2032 (US$ Mn)
Figure 88 North America Stem Cell Technologies and Applications Market Share Forecast by Type, 2022 & 2032 (%)
Figure 89 North America Stem Cell Technologies & Applications Market by Cell Source, 2022-2032 (US$ Mn)
Figure 90 North America Stem Cell Technologies and Applications Market Share Forecast by Cell Source, 2022 & 2032 (%)
Figure 91 North America Stem Cell Technologies & Applications Market by Product, 2022-2032 (US$ Mn)
Figure 92 North America Stem Cell Technologies and Applications Market Share Forecast by Product, 2022 & 2032 (%)
Figure 93 North America Stem Cell Technologies & Applications Market by Technology, 2022-2032 (US$ Mn)
Figure 94 North America Stem Cell Technologies and Applications Market Share Forecast by Technology, 2022 & 2032 (%)
Figure 95 North America Stem Cell Technologies & Applications Market by Application, 2022-2032 (US$ Mn)
Figure 96 North America Stem Cell Technologies and Applications Market Share Forecast by Application, 2022 & 2032 (%)
Figure 97 US Stem Cell Technologies & Applications Market by Value, 2022-2032 (US$ Mn)
Figure 98 Canada Stem Cell Technologies & Applications Market by Value, 2022-2032 (US$ Mn)
Figure 99 Europe Stem Cell Technologies and Applications Market by Country: Market Attractiveness Index
Figure 100 Europe Stem Cell Technologies & Applications Market by Value, 2022-2032 (US$ Mn)
Figure 101 Europe Stem Cell Technologies & Applications Market by Country, 2022-2032 (US$ Mn)
Figure 102 Europe Stem Cell Technologies and Applications Market Share Forecast by Country, 2022 & 2032 (%)
Figure 103 Europe Stem Cell Technologies & Applications Market by Type, 2022-2032 (US$ Mn)
Figure 104 Europe Stem Cell Technologies and Applications Market Share Forecast by Type, 2022 & 2032 (%)
Figure 105 Europe Stem Cell Technologies & Applications Market by Cell Source, 2022-2032 (US$ Mn)
Figure 106 Europe Stem Cell Technologies and Applications Market Share Forecast by Cell Source, 2022 & 2032 (%)
Figure 107 Europe Stem Cell Technologies & Applications Market by Product, 2022-2032 (US$ Mn)
Figure 108 Europe Stem Cell Technologies and Applications Market Share Forecast by Product, 2022 & 2032 (%)
Figure 109 Europe Stem Cell Technologies & Applications Market by Technology, 2022-2032 (US$ Mn)
Figure 110 Europe Stem Cell Technologies and Applications Market Share Forecast by Technology, 2022 & 2032 (%)
Figure 111 Europe Stem Cell Technologies & Applications Market by Application, 2022-2032 (US$ Mn)
Figure 112 Europe Stem Cell Technologies and Applications Market Share Forecast by Application, 2022 & 2032 (%)
Figure 113 Germany Stem Cell Technologies & Applications Market by Value, 2022-2032 (US$ Mn)
Figure 114 UK Stem Cell Technologies & Applications Market by Value, 2022-2032 (US$ Mn)
Figure 115 France Stem Cell Technologies & Applications Market by Value, 2022-2032 (US$ Mn)
Figure 116 Italy Stem Cell Technologies & Applications Market by Value, 2022-2032 (US$ Mn)
Figure 117 Spain Stem Cell Technologies & Applications Market by Value, 2022-2032 (US$ Mn)
Figure 118 Rest of Europe Stem Cell Technologies & Applications Market by Value, 2022-2032 (US$ Mn)
Figure 119 Asia-Pacific Stem Cell Technologies and Applications Market by Country: Market Attractiveness Index
Figure 120 Asia-Pacific Stem Cell Technologies & Applications Market by Value, 2022-2032 (US$ Mn)
Figure 121 Asia-Pacific Stem Cell Technologies & Applications Market by Country, 2022-2032 (US$ Mn)
Figure 122 Asia-Pacific Stem Cell Technologies and Applications Market Share Forecast by Country, 2022 & 2032 (%)
Figure 123 Asia-Pacific Stem Cell Technologies & Applications Market by Type, 2022-2032 (US$ Mn)
Figure 124 Asia-Pacific Stem Cell Technologies and Applications Market Share Forecast by Type, 2022 & 2032 (%)
Figure 125 Asia-Pacific Stem Cell Technologies & Applications Market by Cell Source, 2022-2032 (US$ Mn)
Figure 126 Asia-Pacific Stem Cell Technologies and Applications Market Share Forecast by Cell Source, 2022 & 2032 (%)
Figure 127 Asia-Pacific Stem Cell Technologies & Applications Market by Product, 2022-2032 (US$ Mn)
Figure 128 Asia-Pacific Stem Cell Technologies and Applications Market Share Forecast by Product, 2022 & 2032 (%)
Figure 129 Asia-Pacific Stem Cell Technologies & Applications Market by Technology, 2022-2032 (US$ Mn)
Figure 130 Asia-Pacific Stem Cell Technologies and Applications Market Share Forecast by Technology, 2022 & 2032 (%)
Figure 131 Asia-Pacific Stem Cell Technologies & Applications Market by Application, 2022-2032 (US$ Mn)
Figure 132 Asia-Pacific Stem Cell Technologies and Applications Market Share Forecast by Application, 2022 & 2032 (%)
Figure 133 Japan Stem Cell Technologies & Applications Market by Value, 2022-2032 (US$ Mn)
Figure 134 China Stem Cell Technologies & Applications Market by Value, 2022-2032 (US$ Mn)
Figure 135 India Stem Cell Technologies & Applications Market by Value, 2022-2032 (US$ Mn)
Figure 136 South Korea Stem Cell Technologies & Applications Market by Value, 2022-2032 (US$ Mn)
Figure 137 Australia Stem Cell Technologies & Applications Market by Value, 2022-2032 (US$ Mn)
Figure 138 Rest of Asia-Pacific Stem Cell Technologies & Applications Market by Value, 2022-2032 (US$ Mn)
Figure 139 Latin America Stem Cell Technologies and Applications Market by Country: Market Attractiveness Index
Figure 140 Latin America Stem Cell Technologies & Applications Market by Value, 2022-2032 (US$ Mn)
Figure 141 Latin America Stem Cell Technologies & Applications Market by Country, 2022-2032 (US$ Mn)
Figure 142 Latin America Stem Cell Technologies and Applications Market Share Forecast by Country, 2022 & 2032 (%)
Figure 143 Latin America Stem Cell Technologies & Applications Market by Type, 2022-2032 (US$ Mn)
Figure 144 Latin America Stem Cell Technologies and Applications Market Share Forecast by Type, 2022 & 2032 (%)
Figure 145 Latin America Stem Cell Technologies & Applications Market by Cell Source, 2022-2032 (US$ Mn)
Figure 146 Latin America Stem Cell Technologies and Applications Market Share Forecast by Cell Source, 2022 & 2032 (%)
Figure 147 Latin America Stem Cell Technologies & Applications Market by Product, 2022-2032 (US$ Mn)
Figure 148 Latin America Stem Cell Technologies and Applications Market Share Forecast by Product, 2022 & 2032 (%)
Figure 149 Latin America Stem Cell Technologies & Applications Market by Technology, 2022-2032 (US$ Mn)
Figure 150 Latin America Stem Cell Technologies and Applications Market Share Forecast by Technology, 2022 & 2032 (%)
Figure 151 Latin America Stem Cell Technologies & Applications Market by Application, 2022-2032 (US$ Mn)
Figure 152 Latin America Stem Cell Technologies and Applications Market Share Forecast by Application, 2022 & 2032 (%)
Figure 153 Brazil Stem Cell Technologies & Applications Market by Value, 2022-2032 (US$ Mn)
Figure 154 Mexico Stem Cell Technologies & Applications Market by Value, 2022-2032 (US$ Mn)
Figure 155 Rest of Latin America Stem Cell Technologies & Applications Market by Value, 2022-2032 (US$ Mn)
Figure 156 Middle East & Africa Stem Cell Technologies and Applications Market by Country: Market Attractiveness Index
Figure 157 Middle East & Africa Stem Cell Technologies & Applications Market by Value, 2022-2032 (US$ Mn)
Figure 158 Middle East & Africa Stem Cell Technologies & Applications Market by Country, 2022-2032 (US$ Mn)
Figure 159 Middle East & Africa Stem Cell Technologies and Applications Market Share Forecast by Country, 2022 & 2032 (%)
Figure 160 Middle East & Africa Stem Cell Technologies & Applications Market by Type, 2022-2032 (US$ Mn)
Figure 161 Middle East & Africa Stem Cell Technologies and Applications Market Share Forecast by Type, 2022 & 2032 (%)
Figure 162 Middle East & Africa Stem Cell Technologies & Applications Market by Cell Source, 2022-2032 (US$ Mn)
Figure 163 Middle East & Africa Stem Cell Technologies and Applications Market Share Forecast by Cell Source, 2022 & 2032 (%)
Figure 164 Middle East & Africa Stem Cell Technologies & Applications Market by Product, 2022-2032 (US$ Mn)
Figure 165 Middle East & Africa Stem Cell Technologies and Applications Market Share Forecast by Product, 2022 & 2032 (%)
Figure 166 Middle East & Africa Stem Cell Technologies & Applications Market by Technology, 2022-2032 (US$ Mn)
Figure 167 Middle East & Africa Stem Cell Technologies and Applications Market Share Forecast by Application, 2022 & 2032 (%)
Figure 168 Middle East & Africa Stem Cell Technologies & Applications Market by Application, 2022-2032 (US$ Mn)
Figure 169 Middle East & Africa Stem Cell Technologies and Applications Market Share Forecast by Application, 2022 & 2032 (%)
Figure 170 UAE Stem Cell Technologies & Applications Market by Value, 2022-2032 (US$ Mn)
Figure 171 South Africa Stem Cell Technologies & Applications Market by Value, 2022-2032 (US$ Mn)
Figure 172 Turkey Stem Cell Technologies & Applications Market by Value, 2022-2032 (US$ Mn)
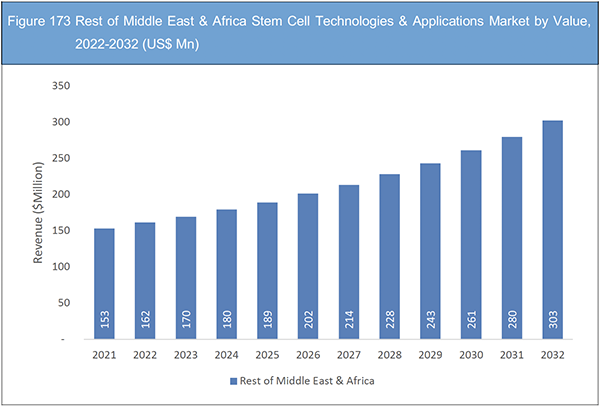
Figure 173 Rest of Middle East & Africa Stem Cell Technologies & Applications Market by Value, 2022-2032 (US$ Mn)
Figure 174 Global Stem Cell Technologies and Applications Market: Company Share Analysis, 2021
Figure 175 Athersys, Inc.: Net Revenue, 2017-2021 (US$ million, AGR (%))
Figure 176 Athersys, Inc.: Gross Profit, 2017-2021 (US$ million, AGR (%))
Figure 177 Athersys, Inc.: R&D, 2017-2021 (US$ million, AGR (%))
Figure 178 Athersys, Inc.: EBITDA, 2017-2021 (US$ million, AGR (%))
Figure 179 Bristol-Myers Squibb Company: Net Revenue, 2017-2021 (US$ million, AGR (%))
Figure 180 Bristol-Myers Squibb Company: Gross Profit, 2017-2021 (US$ million, AGR (%))
Figure 181 Bristol-Myers Squibb Company: R&D, 2017-2021 (US$ million, AGR (%))
Figure 182 Bristol-Myers Squibb Company: EBITDA, 2017-2021 (US$ million, AGR (%))
Figure 183 Cellular Biomedicine Group, Inc. : Net Revenue, 2017-2021 (US$ million, AGR (%))
Figure 184 Cellular Biomedicine Group, Inc. : Gross Profit, 2017-2021 (US$ million, AGR (%))
Figure 185 Cellular Biomedicine Group, Inc. : R&D, 2017-2021 (US$ million, AGR (%))
Figure 186 Cellular Biomedicine Group, Inc. : EBITDA, 2017-2021 (US$ million, AGR (%))
Figure 187 Cynata Therapeutics Limited: Gross Profit, 2017-2021 (US$ million, AGR (%))
Figure 188 Cynata Therapeutics Limited: R&D, 2017-2021 (US$ million, AGR (%))
Figure 189 Cynata Therapeutics Limited: EBITDA, 2017-2021 (US$ million, AGR (%))
Figure 190 Plus Therapeutics, Inc.: Net Revenue, 2017-2021 (US$ million, AGR (%))
Figure 191 Plus Therapeutics, Inc.: Gross Profit, 2017-2021 (US$ million, AGR (%))
Figure 192 Plus Therapeutics, Inc.: R&D, 2017-2021 (US$ million, AGR (%))
Figure 193 Plus Therapeutics, Inc.: EBITDA, 2017-2021 (US$ million, AGR (%))
Figure 194 BioRestorative Therapies, Inc.: Net Revenue, 2017-2021 (US$ million, AGR (%))
Figure 195 BioRestorative Therapies, Inc.: Gross Profit, 2017-2021 (US$ million, AGR (%))
Figure 196 BioRestorative Therapies, Inc.: R&D, 2017-2021 (US$ million, AGR (%))
Figure 197 BioRestorative Therapies, Inc.: EBITDA, 2017-2021 (US$ million, AGR (%))
Figure 198 Pluristem Therapeutics Inc.: Net Revenue, 2017-2021 (US$ million, AGR (%))
Figure 199 Pluristem Therapeutics Inc.: Gross Profit, 2017-2021 (US$ million, AGR (%))
Figure 200 Pluristem Therapeutics Inc.: R&D, 2017-2021 (US$ million, AGR (%))
Figure 201 Pluristem Therapeutics Inc.: EBITDA, 2017-2021 (US$ million, AGR (%))
Figure 202 Sangamo Therapeutics, Inc.: Net Revenue, 2017-2021 (US$ million, AGR (%))
Figure 203 Sangamo Therapeutics, Inc.: Gross Profit, 2017-2021 (US$ million, AGR (%))
Figure 204 Sangamo Therapeutics, Inc.: R&D, 2017-2021 (US$ million, AGR (%))
Figure 205 Sangamo Therapeutics, Inc.: EBITDA, 2017-2021 (US$ million, AGR (%))
Figure 206 StemCell Technologies Inc.: Net Revenue, 2017-2021 (US$ million, AGR (%))
Figure 207 StemCell Technologies Inc.: Gross Profit, 2017-2021 (US$ million, AGR (%))
Figure 208 StemCell Technologies Inc.: R&D, 2017-2021 (US$ million, AGR (%))
Figure 209 StemCell Technologies Inc.: EBITDA, 2017-2021 (US$ million, AGR (%))
Figure 210 Vericel Corporation: Net Revenue, 2017-2021 (US$ million, AGR (%))
Figure 211 Vericel Corporation: Gross Profit, 2017-2021 (US$ million, AGR (%))
Figure 212 Vericel Corporation: R&D, 2017-2021 (US$ million, AGR (%))
Figure 213 Vericel Corporation: EBITDA, 2017-2021 (US$ million, AGR (%))
Figure 214 BrainStorm Cell Limited. : R&D, 2017-2021 (US$ million, AGR (%))
Figure 215 BrainStorm Cell Limited. : EBITDA, 2017-2021 (US$ million, AGR (%))
Figure 216 Gamida Cell Ltd.: R&D, 2017-2021 (US$ million, AGR (%))
Figure 217 Gamida Cell Ltd.: EBITDA, 2017-2021 (US$ million, AGR (%))
Figure 218 Kangstem Biotech Co., Ltd.: Net Revenue, 2017-2021 (US$ million, AGR (%))
Figure 219 Kangstem Biotech Co., Ltd.: Gross Profit, 2017-2021 (US$ million, AGR (%))
Figure 220 Kangstem Biotech Co., Ltd.: R&D, 2017-2021 (US$ million, AGR (%))
Figure 221 Kangstem Biotech Co., Ltd.: EBITDA, 2017-2021 (US$ million, AGR (%))
ページTOPに戻る
Summary
Report Details
The Stem Cell Technologies and Applications Market Report 2022-2032: This report will prove invaluable to leading firms striving for the new revenue pockets if they wish to better understand the industry and its underlying dynamics. It will be useful for companies that would like to expand into different industries or to expand their existing operations in a new region.
Rise in Stem Cell Clinical Trials
Recent years have seen a significant expansion in both stem cell research and the clinical use of these promising cells. The National Institute for Health (NIH) database reported a total of 374 registered clinical trials of which unknown status were not considered. It shows that there has been 3 times expansion in the total number of clinical trials conducted since 2011.Clinical experiments using stem cells have changed the course of the developing field in recent years. While many teams continue to develop and broaden the role of bone marrow and cord blood stem cells for their cutting-edge applications in immune and blood disorders, many others are seeking to expand the applications of the various stem cell types found in bone marrow and cord blood, particularly mesenchymal stem cells, to uses beyond those that could be resolved by replacing cells in their own lineage. Other adult stem cell types, particularly brain stem cells, are being used more frequently by research teams to treat disorders where either in-lineage cell replacement or extracellular factors may have a positive impact. The majority of MSC trials are with allogenic cells and these trials are being conducted globally with largest activity witnessed in U.S., Europe and China. However, despite increase in clinical trials and significant investments being made for conducting these trials the commercialization of these trials have been slow and is a matter of concern for all the shareholders of this industry
What Questions Should You Ask before Buying a Market Research Report?
• How is the stem cell technologies and applications market evolving?
• What is driving and restraining the stem cell technologies and applications market?
• How will each stem cell technologies and applications submarket segment grow over the forecast period and how much revenue will these submarkets account for in 2032?
• How will the market shares for each stem cell technologies and applications submarket develop from 2022 to 2032?
• What will be the main driver for the overall market from 2022 to 2032?
• Will leading stem cell technologies and applications markets broadly follow the macroeconomic dynamics, or will individual national markets outperform others?
• How will the market shares of the national markets change by 2032 and which geographical region will lead the market in 2032?
• Who are the leading players and what are their prospects over the forecast period?
• What are the stem cell technologies and applications projects for these leading companies?
• How will the industry evolve during the period between 2020 and 2032? What are the implications of stem cell technologies and applications projects taking place now and over the next 10 years?
• Is there a greater need for product commercialization to further scale the stem cell technologies and applications market?
• Where are the stem cell technologies and applications market heading and how can you ensure you are at the forefront of the market?
• What are the best investment options for new product and service lines?
• What are the key prospects for moving companies into a new growth path and C-suite?
You need to discover how this will impact the stem cell technologies and applications market today, and over the next 10 years:
• Our 355-page report provides 170 tables and 221 charts/graphs exclusively to you.
• The report highlights key lucrative areas in the industry so you can target them – NOW.
• It contains in-depth analysis of global, regional and national sales and growth.
• It highlights for you the key successful trends, changes and revenue projections made by your competitors.
This report tells you TODAY how the stem cell technologies and applications market will develop in the next 10 years, and in line with the variations in COVID-19 economic recession and bounce. This market is more critical now than at any point over the last 10 years.
Forecasts to 2032 and other analyses reveal commercial prospects
• In addition to revenue forecasting to 2032, our new study provides you with recent results, growth rates, and market shares.
• You will find original analyses, with business outlooks and developments.
• Discover qualitative analyses (including market dynamics, drivers, opportunities, restraints and challenges), cost structure, impact of rising stem cell technologies and applications prices and recent developments.
This report includes data analysis and invaluable insight into how COVID-19 will affect the industry and your company. Four COVID-19 recovery patterns and their impact, namely, “V”, “L”, “W” and “U” are discussed in this report.
Segments Covered in the Report
Market Segment by Type
• Allogeneic Stem Cell Therapy
• Autologous Stem Cell Therapy
Market Segment by Cell Source
• Adipose tissue-derived MSCs
• Bone marrow-derived MSCs
• Placental/umbilical cord-derived MSCs
Market Segment by Product
• Adult Stem Cells
• Human Embryonic Stem Cells
• Induced Pluripotent Stem Cells
• Very Small Embryonic Like Stem Cells
Market Segment by Technology
• Cell Acquisition
• Cell Production
• Cryopreservation
• Expansion & Sub-Culture
• Other Technology
Market Segment by Application
• Cancer
• Cardiovascular Diseases
• Neurological Disorders
• Inflammatory & Autoimmune Diseases
• Musculoskeletal Disorders
• Other Applications
In addition to the revenue predictions for the overall world market and segments, you will also find revenue forecasts for four regional and 20 leading national markets:
North America
• U.S.
• Canada
Europe
• Germany
• Spain
• United Kingdom
• France
• Italy
• Rest of Europe
Asia Pacific
• China
• Japan
• India
• Australia
• South Korea
• Rest of Asia Pacific
Latin America
• Brazil
• Mexico
• Rest of Latin America
Middle East & Africa
• Turkey
• South Africa
• UAE
• Rest of the Middle East & Africa
The report also includes profiles and for some of the leading companies in the Stem Cell Technologies and Applications Market, 2022 to 2032, with a focus on this segment of companies’ operations.
Leading companies and the potential for market growth
• Athersys, Inc.
• Biorestorative Therapies, Inc.
• BrainStorm Cell Limited
• Cellaïon SA
• Cellular Biomedicine Group, Inc.
• Cynata Therapeutics Limited
• Gamida Cell Ltd.
• Kangstem Biotech Co., Ltd.
• Mesoblast Limited
• Pluristem Therapeutics Inc.
• Plus Therapeutics, Inc.
• Sangamo Therapeutics, Inc.
• StemCell Technologies Inc.
• Vericel Corporation
• ViaCyte, Inc.
Overall world revenue for Stem Cell Technologies and Applications Market, 2022 to 2032 in terms of value the market will surpass US$9,922 million in 2022, our work calculates. We predict strong revenue growth through to 2032. Our work identifies which organizations hold the greatest potential. Discover their capabilities, progress, and commercial prospects, helping you stay ahead.
How will the Stem Cell Technologies and Applications Market, 2022 to 2032 report help you?
In summary, our 350+ page report provides you with the following knowledge:
• Revenue forecasts to 2032 for Stem Cell Technologies and Applications Market, 2022 to 2032 Market, with forecasts for type, cell source, product, technology, application, and company size, each forecast at a global and regional level – discover the industry’s prospects, finding the most lucrative places for investments and revenues.
• Revenue forecasts to 2032 for four regional and 20 key national markets – See forecasts for the Stem Cell Technologies and Applications Market, 2022 to 2032 market in North America, Europe, Asia-Pacific, Latin America, and Middle East & Africa. Also forecasted is the market in the US, Canada, Mexico, Brazil, Germany, France, UK, Italy, China, India, Japan, and Australia among other prominent economies.
• Prospects for established firms and those seeking to enter the market – including company profiles for 15 of the major companies involved in the Stem Cell Technologies and Applications Market, 2022 to 2032.
Find quantitative and qualitative analyses with independent predictions. Receive information that only our report contains, staying informed with invaluable business intelligence.
Information found nowhere else
With our new report, you are less likely to fall behind in knowledge or miss out on opportunities. See how our work could benefit your research, analyses, and decisions. Visiongain’s study is for everybody needing commercial analyses for the Stem Cell Technologies and Applications Market, 2022 to 2032, market-leading companies. You will find data, trends and predictions.
ページTOPに戻る
Table of Contents
Table of Contents
1. Report Overview
1.1 Objectives of the Study
1.2 Introduction to Stem Cell Technologies and Applications Market
1.3 What This Report Delivers
1.4 Why You Should Read This Report
1.5 Key Questions Answered by This Analytical Report
1.6 Who is This Report for?
1.7 Methodology
1.7.1 Market Definitions
1.7.2 Market Evaluation & Forecasting Methodology
1.7.3 Data Validation
1.8 Frequently Asked Questions (FAQs)
1.9 Associated Visiongain Reports
1.10 About Visiongain
2 Executive Summary
2.1 Geographical Snapshot: Global Stem Cell Technologies and Applications Market
2.2 Type Segment: Market Attractiveness Index
2.3 Cell Source Segment: Market Attractiveness Index
2.4 Product Segment: Market Attractiveness Index
2.5 Technology Segment: Market Attractiveness Index
2.6 Application Segment: Market Attractiveness Index
3 Market Overview
3.1 Key Findings
3.2 Market Dynamics
3.2.1 Market Driving Factors
3.2.2 Market Restraining Factors
3.2.3 Market Opportunities
3.3 Supply Chain
3.4 Value Chain
3.5 COVID-19 Impact Analysis
3.5.1 Risks of COVID-19 for those Undergoing Stem Cell Transplants
3.6 Porter’s Five Forces Analysis
3.6.1 Supplier Power
3.6.2 Buyer Power
3.6.3 Competitive Rivalry
3.6.4 Threat from Substitutes
3.6.5 Threat of New Entrants
3.7 PESTLE Analysis
3.7.1 Political Factors
3.7.2 Economic Factors
3.7.3 Social Factors
3.7.4 Technological Factors
4 Global Stem Cell Technologies and Applications Market Analysis by Type
4.1 Key Findings
4.2 Type Segment Growth Prospects
4.3 Type Segment: Market Attractiveness Index
4.4 Global Stem Cell Technologies and Applications Market Share by Type, 2022 & 2032
4.5 Global Stem Cell Technologies and Applications Market by Type
4.6 Allogenic Segment Market
4.6.1 Growing Prevalence of Cancer and Cardiovascular Diseases
4.6.2 Global Allogeneic Stem Cell Therapy Market by Type
4.6.3 Global Allogeneic Stem Cell Therapy Market by Region
4.7 Autologous Segment Market
4.7.1 Rising Frequency of Cancer
4.7.2 Global Autologous Stem Cell Therapy Market Forecast
4.7.3 Global Autologous Stem Cell Therapy Market by Region
5 Global Stem Cell Technologies and Applications Market Analysis by Cell Source
5.1 Key Findings
5.2 Cell Source Segment Growth Prospects
5.3 Cell Source Segment: Market Attractiveness Index
5.4 Global Stem Cell Technologies and Applications Market Share by Cell Source, 2022 & 2032
5.5 Global Stem Cell Technologies & Applications Market by Cell Source
5.6 Adipose Tissue- derived MSCs Segment Market Forecast
5.6.1 Source and Implication
5.6.2 Clinical Applications for Tissue Repair
5.6.3 Global Adipose Tissue-Derived MSCs Market Forecast
5.6.4 Global Adipose tissue-derived MSCs Market by Region
5.7 Bone Marrow- derived MSCs Segment Market Forecast
5.7.1 Bone Marrow Concept
5.7.2 Emerging Technology
5.7.3 Global Bone marrow-derived MSCs Market Forecast
5.7.4 Global Bone Marrow-Derived MSCs Market by Region
5.8 Placental/ Umbilical Cord- Derived MSCs Segment Market Forecast
5.8.1 Placental/ Umbilical Cord- Derived MSCs
5.8.2 Therapeutic Potential
5.8.3 Global Placental/Umbilical Cord-Derived MSCs Market Forecast
5.8.4 Global Placental/Umbilical Cord-Derived MSCs Market by Region
6 Global Stem Cell Technologies and Applications Market Analysis by Product
6.1 Key Findings
6.2 Product Segment Growth Prospects
6.3 Product Segment: Market Attractiveness Index
6.4 Global Stem Cell Technologies and Applications Market Share by Product, 2022 & 2032
6.5 Global Stem Cell Technologies & Applications Market by Product
6.6 Adult Stem Cells Segment Market Forecast
6.6.1 Rising Application Areas
6.6.2 Global Adult Stem Cells Market Forecast
6.6.3 Global Adult Stem Cells Market by Region
6.7 Human Embryonic Stem Cells Segment Market Forecast, 2021-2031
6.7.1 Increasing Research and Development Activities
6.7.2 Global Human Embryonic Stem Cells Market Forecast
6.7.3 Global Human Embryonic Stem Cells Market by Region
6.8 Induced Pluripotent Stem Cells Segment Market Forecast, 2021-2031
6.8.1 Favourable Government Support
6.8.2 Global Induced Pluripotent Stem Cells Market Forecast
6.8.3 Global Induced Pluripotent Stem Cells Market by Region
6.9 Very Small Embryonic Like Stem Cells
6.9.1 Global Very Small Embryonic Like Stem Cells Market Forecast
6.9.2 Global Very Small Embryonic Like Stem Cells Market by Region
7 Global Stem Cell Technologies and Applications Market Analysis by Technology
7.1 Key Findings
7.2 Technology Segment Growth Prospects
7.3 Technology Segment: Market Attractiveness Index
7.4 Global Stem Cell Technologies and Applications Market Share by Technology, 2022 & 2032
7.5 Global Stem Cell Technologies & Applications Market by Technology
7.6 Cell Acquisition Segment Market Forecast
7.6.1 Global Cell Acquisition Market Forecast
7.6.2 Global Cell Acquisition Market by Region
7.7 Cell Production Segment Market Forecast
7.7.1 Increasing Research and Development by Companies for the Development of Stem Cell Products
7.7.2 Global Cell Production Market Forecast
7.7.3 Global Cell Production Market by Region
7.8 Cryopreservation Segment Market Forecast
7.8.1 Surge in Research and Medical Applications
7.8.2 Global Cryopreservation Market Forecast
7.8.3 Global Cryopreservation Market by Region
7.9 Expansion & Sub-Culture Segment Market Forecast
7.9.1 Sub-culture
7.9.2 Rising Incidence of Chronic Diseases
7.9.3 Global Expansion & Sub-Culture Market Forecast
7.9.4 Global Expansion & Sub-Culture Market Forecast by Region
7.10 Other Technology Market Forecast
7.10.1 Global Other Technology Market Forecast
7.10.2 Global Other Technology Market by Region
8 Global Stem Cell Technologies and Applications Market Analysis by Application
8.1 Key Findings
8.2 Application Segment Growth Prospects
8.3 Application Segment: Market Attractiveness Index
8.4 Global Stem Cell Technologies and Applications Market Share by Application, 2022 & 2032
8.4.1 Global Stem Cell Technologies & Applications Market by Application
8.5 Therapeutic Application Segment Market Forecast
8.5.1 Rising Prevalence of Cardiovascular Diseases
8.5.2 Utilizing Stem Cell Technologies Therapeutically to Treat Parkinson's Illness
8.5.1 Cancer Segment Market Forecast
8.5.2 Cardiovascular Segment Market Forecast
8.5.3 CNS Segment Market Forecast
8.5.4 Inflammatory & Autoimmune Diseases Segment Market Forecast
8.5.5 Musculoskeletal Disorders Segment Market Forecast
8.6 Non-Therapeutic Application Segment Market Forecast
8.6.1 Rising Awareness of Stem Cell therapies propels the Growth of Stem Cell Banking
8.6.2 Global Other Applications Market Forecast
8.6.3 Global Other Applications Market by Region
9 Global Stem Cell Technologies and Applications Market Analysis by Region
9.1 Key Findings
9.2 Overview
9.3 Global Stem Cell Technologies & Applications, By Region Market Attractiveness Index
9.4 Global Stem Cell Technologies and Applications Market Share by Application, 2022 & 2032
9.5 Global Stem Cell Technologies & Applications Market Forecast
9.5.1 Global Stem Cell Technologies & Applications Market Forecast
9.5.2 Global Stem Cell Technologies & Applications Market Forecast (Post-CoViD-19)
9.6 Global Stem Cell Technologies & Applications Market by Region
9.6.1 Global Stem Cell Technologies & Applications Market by Region Forecast
9.6.2 Global Stem Cell Technologies & Applications Market by Region Forecast (Post-CoViD-19)
10 North America Stem Cell Technologies and Applications Market Analysis
10.1 Key Findings
10.2 North America Stem Cell Technologies and Applications Market Attractiveness Index
10.3 Rising Prevalence of Cancer
10.4 North America Stem Cell Technologies and Applications Market Size Estimation and Forecast
10.5 North America Stem Cell Technologies and Applications Market Size Estimation and Forecast by Country
10.6 North America Stem Cell Technologies and Applications Market Size Estimation and Forecast by Type
10.7 North America Stem Cell Technologies and Applications Market Size Estimation and Forecast by Cell Source
10.8 North America Stem Cell Technologies and Applications Market Size Estimation and Forecast by Product
10.9 North America Stem Cell Technologies and Applications Market Size Estimation and Forecast by Technology
10.10 North America Stem Cell Technologies and Applications Market Size Estimation and Forecast by Application
10.11 U.S. Stem Cell Technologies & Application Market Forecast
10.11.1 Growing Biotechnology Sector and Increasing Stem Cell Research
10.12 Canada Stem Cell Technologies & Application Market Forecast
10.12.1 Growing Biotechnology Sector and Increasing Stem Cell Research
11 Europe Stem Cell Technologies and Applications Market Analysis
11.1 Key Findings
11.2 Europe Stem Cell Technologies and Applications Market Attractiveness Index
11.3 Europe Stem Cell Technologies and Applications Market Size Estimation and Forecast by Value
11.4 Europe Stem Cell Technologies and Applications Market Size Estimation and Forecast by Country
11.5 Europe Stem Cell Technologies and Applications Market Size Estimation and Forecast by Type
11.6 Europe Stem Cell Technologies and Applications Market Size Estimation and Forecast by Cell Source
11.7 Europe Stem Cell Technologies and Applications Market Size Estimation and Forecast by Product
11.8 Europe Stem Cell Technologies and Applications Market Size Estimation and Forecast by Technology
11.9 Europe Stem Cell Technologies and Applications Market Size Estimation and Forecast by Application
11.10 Germany Stem Cell Technologies & Application Market Forecast
11.10.1 Rising Technological Advancements Supports the Growth of the Market
11.11 U.K. Stem Cell Technologies & Application Market Forecast
11.11.1 Increasing Research and Development Activities
11.12 France Stem Cell Technologies & Application Market Forecast, 2021-2031
11.12.1 Introduction of New and Innovative Stem Cell Products for Rare Diseases
11.13 Italy Stem Cell Technologies & Application Market Forecast
11.13.1 Increasing Clinical Trials
11.14 Spain Stem Cell Technologies & Application Market Forecast
11.14.1 Rising Research and Development Activities
11.15 Rest of Europe Stem Cell Technologies & Application Market Forecast, 2021-2031
11.15.1 Rising Need for New and Innovative Technologies
11.15.2 Russia Stem Cell Technologies & Application Market Forecast
12 Asia-Pacific Stem Cell Technologies and Applications Market Analysis
12.1 Key Findings
12.2 Asia-Pacific Stem Cell Technologies and Applications Market Attractiveness Index
12.3 Rise in Aging Population
12.4 Asia-Pacific Stem Cell Technologies and Applications Market Size Estimation and Forecast by Value
12.5 Asia-Pacific Stem Cell Technologies and Applications Market Size Estimation and Forecast by Country
12.6 Asia-Pacific Stem Cell Technologies and Applications Market Size Estimation and Forecast by Type
12.7 Asia-Pacific Stem Cell Technologies and Applications Market Size Estimation and Forecast by Cell Source
12.8 Asia-Pacific Stem Cell Technologies and Applications Market Size Estimation and Forecast by Product
12.9 Asia-Pacific Stem Cell Technologies and Applications Market Size Estimation and Forecast by Technology
12.10 Asia-Pacific Stem Cell Technologies and Applications Market Size Estimation and Forecast by Application
12.11 Japan Stem Cell Technologies & Application Market Forecast
12.11.1 Favourable Government Policies
12.12 China Stem Cell Technologies & Application Market Forecast
12.12.1 Perspective of China for Cell and Gene Therapies (CGT)
12.13 India Stem Cell Technologies & Application Market Forecast
12.13.1 Increasing Research and Development Activities
12.14 South Korea Stem Cell Technologies & Application Market Forecast
12.14.1 HK inno.N (South Korea) and GC Cell (South Kores) Signed a Joint Research and Development Contract for Creating New Cell Therapies
12.15 Australia Stem Cell Technologies & Application Market Forecast
12.15.1 Rising Number of Companies Entering Stem Cell Technologies and Application Market
12.16 Rest of Asia-Pacific Stem Cell Technologies & Application Market Forecast
12.16.1 Favourable Government Support
13 Latin America Stem Cell Technologies and Applications Market Analysis
13.1 Key Findings
13.2 Latin America Stem Cell Technologies and Applications Market Attractiveness Index
13.3 Latin America Stem Cell Technologies and Applications Market Size Estimation and Forecast by Value
13.4 Latin America Stem Cell Technologies and Applications Market Size Estimation and Forecast by Country
13.5 Latin America Stem Cell Technologies and Applications Market Size Estimation and Forecast by Type
13.6 Latin America Stem Cell Technologies and Applications Market Size Estimation and Forecast by Cell Source
13.7 Latin America Stem Cell Technologies and Applications Market Size Estimation and Forecast by Product
13.8 Latin America Stem Cell Technologies and Applications Market Size Estimation and Forecast by Technology
13.9 Latin America Stem Cell Technologies and Applications Market Size Estimation and Forecast by Application
13.10 Brazil Stem Cell Technologies & Application Market Forecast
13.11 Mexico Stem Cell Technologies & Application Market Forecast
13.12 Rest of LATAM Stem Cell Technologies & Application Market Forecast
14 Middle-East & Africa Stem Cell Technologies and Applications Market Analysis
14.1 Key Findings
14.2 Middle East & Africa Stem Cell Technologies and Applications Market Attractiveness Index
14.3 Middle East & Africa Stem Cell Technologies and Applications Market Size Estimation and Forecast by Value
14.4 Middle East & Africa Stem Cell Technologies and Applications Market Size Estimation and Forecast by Country
14.5 Middle East & Africa Stem Cell Technologies and Applications Market Size Estimation and Forecast by Type
14.6 Middle East & Africa Stem Cell Technologies and Applications Market Size Estimation and Forecast by Cell Source
14.7 Middle East & Africa Stem Cell Technologies and Applications Market Size Estimation and Forecast by Product
14.8 Middle East & Africa Stem Cell Technologies and Applications Market Size Estimation and Forecast by Technology
14.9 Middle East & Africa Stem Cell Technologies and Applications Market Size Estimation and Forecast by Application
14.10 UAE Stem Cell Technologies & Application Market Forecast
14.11 South Africa Stem Cell Technologies & Application Market Forecast
14.12 Turkey Stem Cell Technologies & Application Market Forecast
14.13 Rest of MEA Stem Cell Technologies & Application Market Forecast
15 Competitive Landscape
15.1 Company Share Analysis
15.2 Key Business Strategy Analysis- Acquisition
15.3 Key Business Strategy Analysis- Agreement
15.4 Key Business Strategy Analysis- Approval
15.5 Key Business Strategy Analysis- Collaboration
15.6 Key Business Strategy Analysis- Contract
15.7 Key Business Strategy Analysis- Expansion
15.8 Key Business Strategy Analysis- Investment
15.9 Key Business Strategy Analysis- Joint Venture
15.10 Key Business Strategy Analysis- Merger
15.11 Key Business Strategy Analysis- New Product Launch
15.12 Key Business Strategy Analysis- Partnership
16 Company Profiles
16.1 Pipeline Analysis
16.1 Athersys, Inc.
16.1.1 Company Snapshot
16.1.2 Company Overview
16.1.3 Financial Analysis
16.1.4 Product Benchmarking
16.1.5 Strategic Outlook
16.2 Mesoblast Limited
16.2.1 Company Snapshot
16.2.2 Company Overview
16.2.3 Financial Analysis
16.2.4 Product Benchmarking
16.2.5 Strategic Outlook
16.3 Cellular Biomedicine Group, Inc.
16.3.1 Company Snapshot
16.3.2 Company Overview
16.3.3 Financial Analysis
16.3.4 Product Benchmarking
16.3.5 Strategic Outlook
16.4 Cynata Therapeutics Limited
16.4.1 Company Snapshot
16.4.2 Company Overview
16.4.3 Financial Analysis
16.4.4 Product Benchmarking
16.4.5 Strategic Outlook
16.5 Plus Therapeutics, Inc.
16.5.1 Company Snapshot
16.5.2 Company Overview
16.5.3 Financial Analysis
16.5.4 Product Benchmarking
16.5.5 Strategic Outlook
16.6 Biorestorative Therapies, Inc.
16.6.1 Company Snapshot
16.6.2 Company Overview
16.6.3 Financial Analysis
16.6.4 Product Benchmarking
16.6.5 Strategic Outlook
16.7 Pluristem Therapeutics Inc.
16.7.1 Company Snapshot
16.7.2 Company Overview
16.7.3 Financial Analysis
16.7.4 Product Benchmarking
16.7.5 Strategic Outlook
16.8 Cellaïon SA
16.8.1 Company Snapshot
16.8.2 Company Overview
16.8.3 Financial Analysis
16.8.4 Product Benchmarking
16.8.5 Strategic Outlook
16.9 Sangamo Therapeutics, Inc.
16.9.1 Company Snapshot
16.9.2 Company Overview
16.9.3 Financial Analysis
16.9.4 Product Benchmarking
16.9.5 Strategic Outlook
16.10 StemCell Technologies Inc.
16.10.1 Company Snapshot
16.10.2 Company Overview
16.10.3 Financial Analysis
16.10.4 Product Benchmarking
16.10.5 Strategic Outlook
16.11 Vericel Corporation
16.11.1 Company Snapshot
16.11.2 Company Overview
16.11.3 Financial Analysis
16.11.4 Product Benchmarking
16.11.5 Strategic Outlook
16.12 BrainStorm Cell Limited.
16.12.1 Company Snapshot
16.12.2 Company Overview
16.12.3 Financial Analysis
16.12.4 Product Benchmarking
16.12.5 Strategic Outlook
16.13 Gamida Cell Ltd.
16.13.1 Company Snapshot
16.13.2 Company Overview
16.13.3 Financial Analysis
16.13.4 Product Benchmarking
16.13.5 Strategic Outlook
16.14 ViaCyte, Inc.
16.14.1 Company Snapshot
16.14.2 Company Overview
16.14.3 Financial Analysis
16.14.4 Product Benchmarking
16.14.5 Strategic Outlook
16.15 Kangstem Biotech Co., Ltd.
16.15.1 Company Snapshot
16.15.2 Company Overview
16.15.3 Financial Analysis
16.15.4 Product Benchmarking
16.15.5 Strategic Outlook
17 Conclusion and Recommendations
17.1 Concluding Remarks from Visiongain
17.2 Recommendations for Market Players
List of Tables
Table 1 Global Stem Cell Technologies and Applications Market Snapshot, 2022 & 2032 (US$Million, CAGR %)
Table 2 Global Stem Cell Banks and Region
Table 3 Global Stem Cell Technologies and Applications Market by Region, 2022-2032 (US$ Mn, AGR (%), CAGR (%)): “V” Shaped Recovery Scenario
Table 4 Global Stem Cell Technologies and Applications Market by Region, 2022-2032 (US$ Mn, AGR (%), CAGR (%)): “U” Shaped Recovery Scenario
Table 5 Global Stem Cell Technologies and Applications Market by Region, 2022-2032 (US$ Mn, AGR (%), CAGR (%)): “W” Shaped Recovery Scenario
Table 6 Global Stem Cell Technologies and Applications Market by Region, 2022-2032 (US$ Mn, AGR (%), CAGR (%)): “L” Shaped Recovery Scenario
Table 7 Global Stem Cell Technologies & Applications Market by Type, 2022-2032 (US$ Mn, AGR (%), CAGR (%))
Table 8 Global Allogeneic Stem Cell Therapy Market Forecast, 2022-2032 (US$ Mn, AGR (%), CAGR (%))
Table 9 Global Allogeneic Stem Cell Therapy Market by Region, 2022-2032 (US$ Mn, AGR (%), CAGR (%))
Table 10 Global Autologous Stem Cell Therapy Market Forecast, 2022-2032 (US$ Mn, AGR (%), CAGR (%))
Table 11 Global Autologous Stem Cell Therapy Market by Region, 2022-2032 (US$ Mn, AGR (%), CAGR (%))
Table 12 Global Stem Cell Technologies & Applications Market by Cell Source, 2022-2032 (US$ Mn, AGR (%), CAGR (%))
Table 13 Global Adipose tissue-derived MSCs Market Forecast, 2022-2032 (US$ Mn, AGR (%), CAGR (%))
Table 14 Global Adipose tissue-derived MSCs Market by Region, 2022-2032 (US$ Mn, AGR (%), CAGR (%))
Table 15 Global Bone marrow-derived MSCs Market Forecast, 2022-2032 (US$ Mn, AGR (%), CAGR (%))
Table 16 Global Bone marrow-derived MSCs Market by Region, 2022-2032 (US$ Mn, AGR (%), CAGR (%))
Table 17 Global Placental/umbilical cord-derived MSCs Market Forecast, 2022-2032 (US$ Mn, AGR (%), CAGR (%))
Table 18 Global Placental/umbilical cord-derived MSCs Market by Region, 2022-2032 (US$ Mn, AGR (%), CAGR (%))
Table 19 Global Stem Cell Technologies & Applications Market by Product, 2022-2032 (US$ Mn, AGR (%), CAGR (%))
Table 20 Global Adult Stem Cells Market Forecast, 2022-2032 (US$ Mn, AGR (%), CAGR (%))
Table 21 Global Adult Stem Cells Market by Region, 2022-2032 (US$ Mn, AGR (%), CAGR (%))
Table 22 Global Human Embryonic Stem Cells Market Forecast, 2022-2032 (US$ Mn, AGR (%), CAGR (%))
Table 23 Global Human Embryonic Stem Cells Market by Region, 2022-2032 (US$ Mn, AGR (%), CAGR (%))
Table 24 Global Induced Pluripotent Stem Cells Market Forecast, 2022-2032 (US$ Mn, AGR (%), CAGR (%))
Table 25 Global Induced Pluripotent Stem Cells Market by Region, 2022-2032 (US$ Mn, AGR (%), CAGR (%))
Table 26 Global Very Small Embryonic Like Stem Cells Market Forecast, 2022-2032 (US$ Mn, AGR (%), CAGR (%))
Table 27 Global Very Small Embryonic Like Stem Cells Market by Region, 2022-2032 (US$ Mn, AGR (%), CAGR (%))
Table 28 Global Stem Cell Technologies & Applications Market by Technology, 2022-2032 (US$ Mn, AGR (%), CAGR (%))
Table 29 Global Cell Acquisition Market Forecast, 2022-2032 (US$ Mn, AGR (%), CAGR (%))
Table 30 Global Cell Acquisition Market by Region, 2022-2032 (US$ Mn, AGR (%), CAGR (%))
Table 31 Global Cell Production Market Forecast, 2022-2032 (US$ Mn, AGR (%), CAGR (%))
Table 32 Global Cell Production Market by Region, 2022-2032 (US$ Mn, AGR (%), CAGR (%))
Table 33 Global Cryopreservation Market Forecast, 2022-2032 (US$ Mn, AGR (%), CAGR (%))
Table 34 Global Cryopreservation Market by Region, 2022-2032 (US$ Mn, AGR (%), CAGR (%))
Table 35 Global Expansion & Sub-Culture Market Forecast, 2022-2032 (US$ Mn, AGR (%), CAGR (%))
Table 36 Global Expansion & Sub-Culture Market by Region, 2022-2032 (US$ Mn, AGR (%), CAGR (%))
Table 37 Global Other Technology Market Forecast, 2022-2032 (US$ Mn, AGR (%), CAGR (%))
Table 38 Global Other Technology Market by Region, 2022-2032 (US$ Mn, AGR (%), CAGR (%))
Table 39 Global Stem Cell Technologies & Applications Market by Application, 2022-2032 (US$ Mn, AGR (%), CAGR (%))
Table 40 Global Cancer Market Forecast, 2022-2032 (US$ Mn, AGR (%), CAGR (%))
Table 41 Global Cancer Market by Region, 2022-2032 (US$ Mn, AGR (%), CAGR (%))
Table 42 Global Cardiovascular Diseases Market Forecast, 2022-2032 (US$ Mn, AGR (%), CAGR (%))
Table 43 Global Cardiovascular Diseases Market by Region, 2022-2032 (US$ Mn, AGR (%), CAGR (%))
Table 44 Global Neurological Disorders Market Forecast, 2022-2032 (US$ Mn, AGR (%), CAGR (%))
Table 45 Global Neurological Disorders Market by Region, 2022-2032 (US$ Mn, AGR (%), CAGR (%))
Table 46 Global Inflammatory & Autoimmune Diseases Market Forecast, 2022-2032 (US$ Mn, AGR (%), CAGR (%))
Table 47 Global Inflammatory & Autoimmune Diseases Market by Region, 2022-2032 (US$ Mn, AGR (%), CAGR (%))
Table 48 Global Musculoskeletal Disorders Market Forecast, 2022-2032 (US$ Mn, AGR (%), CAGR (%))
Table 49 Global Musculoskeletal Disorders Market by Region, 2022-2032 (US$ Mn, AGR (%), CAGR (%))
Table 50 Global Other Applications Market Forecast, 2022-2032 (US$ Mn, AGR (%), CAGR (%))
Table 51 Global Other Applications Market by Region, 2022-2032 (US$ Mn, AGR (%), CAGR (%))
Table 52 Global Stem Cell Technologies & Applications Market Forecast, 2022-2032 (US$ Mn, AGR (%), CAGR (%))
Table 53 Global Stem Cell Technologies & Applications Market Forecast, 2022-2032 (US$ Mn, AGR (%), CAGR (%)) (V-Shaped Recovery Scenario)
Table 54 Global Stem Cell Technologies & Applications Market Forecast, 2022-2032 (US$ Mn, AGR (%), CAGR (%)) (W-Shaped Recovery Scenario)
Table 55 Global Stem Cell Technologies & Applications Market Forecast, 2022-2032 (US$ Mn, AGR (%), CAGR (%)) (U-Shaped Recovery Scenario)
Table 56 Global Stem Cell Technologies & Applications Market Forecast, 2022-2032 (US$ Mn, AGR (%), CAGR (%)) (L-Shaped Recovery Scenario)
Table 57 Global Stem Cell Technologies & Applications Market by Region, 2022-2032 (US$ Mn, AGR (%), CAGR (%))
Table 58 Global Stem Cell Technologies & Applications Market by Region, 2022-2032 (US$ Mn, AGR (%), CAGR (%)) (V-Shaped Recovery Scenario)
Table 59 Global Stem Cell Technologies & Applications Market by Region, 2022-2032 (US$ Mn, AGR (%), CAGR (%)) (W-Shaped Recovery Scenario)
Table 60 Global Stem Cell Technologies & Applications Market by Region, 2022-2032 (US$ Mn, AGR (%), CAGR (%)) (U-Shaped Recovery Scenario)
Table 61 Global Stem Cell Technologies & Applications Market by Region, 2022-2032 (US$ Mn, AGR (%), CAGR (%)) (L-Shaped Recovery Scenario)
Table 62 North America Stem Cell Technologies & Applications Market, 2022-2032 (US$ Mn, AGR (%), CAGR (%))
Table 63 North America Stem Cell Technologies & Applications Market by Country, 2022-2032 (US$ Mn, AGR (%), CAGR (%))
Table 64 North America Stem Cell Technologies & Applications Market by Type, 2022-2032 (US$ Mn, AGR (%), CAGR (%))
Table 65 North America Stem Cell Technologies & Applications Market by Cell Source, 2022-2032 (US$ Mn, AGR (%), CAGR (%))
Table 66 North America Stem Cell Technologies & Applications Market by Product, 2022-2032 (US$ Mn, AGR (%), CAGR (%))
Table 67 North America Stem Cell Technologies & Applications Market by Technology, 2022-2032 (US$ Mn, AGR (%), CAGR (%))
Table 68 North America Stem Cell Technologies & Applications Market by Application, 2022-2032 (US$ Mn, AGR (%), CAGR (%))
Table 69 US Stem Cell Technologies & Applications Market by Value, 2022-2032 (US$ Mn, AGR (%), CAGR (%))
Table 70 Canada Stem Cell Technologies & Applications Market by Value, 2022-2032 (US$ Mn, AGR (%), CAGR (%))
Table 71 Europe Stem Cell Technologies & Applications Market by Value, 2022-2032 (US$ Mn, AGR (%), CAGR (%))
Table 72 Europe Stem Cell Technologies & Applications Market by Country, 2022-2032 (US$ Mn, AGR (%), CAGR (%))
Table 73 Europe Stem Cell Technologies & Applications Market by Type, 2022-2032 (US$ Mn, AGR (%), CAGR (%))
Table 74 Europe Stem Cell Technologies & Applications Market by Cell Source, 2022-2032 (US$ Mn, AGR (%), CAGR (%))
Table 75 Europe Stem Cell Technologies & Applications Market by Product, 2022-2032 (US$ Mn, AGR (%), CAGR (%))
Table 76 Europe Stem Cell Technologies & Applications Market by Technology, 2022-2032 (US$ Mn, AGR (%), CAGR (%))
Table 77 Europe Stem Cell Technologies & Applications Market by Application, 2022-2032 (US$ Mn, AGR (%), CAGR (%))
Table 78 Germany Stem Cell Technologies & Applications Market by Value, 2022-2032 (US$ Mn, AGR (%), CAGR (%))
Table 79 UK Stem Cell Technologies & Applications Market by Value, 2022-2032 (US$ Mn, AGR (%), CAGR (%))
Table 80 France Stem Cell Technologies & Applications Market by Value, 2022-2032 (US$ Mn, AGR (%), CAGR (%))
Table 81 Italy Stem Cell Technologies & Applications Market by Value, 2022-2032 (US$ Mn, AGR (%), CAGR (%))
Table 82 Spain Stem Cell Technologies & Applications Market by Value, 2022-2032 (US$ Mn, AGR (%), CAGR (%))
Table 83 Rest of Europe Stem Cell Technologies & Applications Market by Value, 2022-2032 (US$ Mn, AGR (%), CAGR (%))
Table 84 Asia-Pacific Stem Cell Technologies & Applications Market by Value, 2022-2032 (US$ Mn, AGR (%), CAGR (%))
Table 85 Asia-Pacific Stem Cell Technologies & Applications Market by Country, 2022-2032 (US$ Mn, AGR (%), CAGR (%))
Table 86 Asia-Pacific Stem Cell Technologies & Applications Market by Type, 2022-2032 (US$ Mn, AGR (%), CAGR (%))
Table 87 Asia-Pacific Stem Cell Technologies & Applications Market by Cell Source, 2022-2032 (US$ Mn, AGR (%), CAGR (%))
Table 88 Asia-Pacific Stem Cell Technologies & Applications Market by Product, 2022-2032 (US$ Mn, AGR (%), CAGR (%))
Table 89 Asia-Pacific Stem Cell Technologies & Applications Market by Technology, 2022-2032 (US$ Mn, AGR (%), CAGR (%))
Table 90 Asia-Pacific Stem Cell Technologies & Applications Market by Application, 2022-2032 (US$ Mn, AGR (%), CAGR (%))
Table 91 Japan Stem Cell Technologies & Applications Market by Value, 2022-2032 (US$ Mn, AGR (%), CAGR (%))
Table 92 China Stem Cell Technologies & Applications Market by Value, 2022-2032 (US$ Mn, AGR (%), CAGR (%))
Table 93 India Stem Cell Technologies & Applications Market by Value, 2022-2032 (US$ Mn, AGR (%), CAGR (%))
Table 94 South Korea Stem Cell Technologies & Applications Market by Value, 2022-2032 (US$ Mn, AGR (%), CAGR (%))
Table 95 Australia Stem Cell Technologies & Applications Market by Value, 2022-2032 (US$ Mn, AGR (%), CAGR (%))
Table 96 Rest of Asia-Pacific Stem Cell Technologies & Applications Market by Value, 2022-2032 (US$ Mn, AGR (%), CAGR (%))
Table 97 Latin America Stem Cell Technologies & Applications Market by Value, 2022-2032 (US$ Mn, AGR (%), CAGR (%))
Table 98 Latin America Stem Cell Technologies & Applications Market by Country, 2022-2032 (US$ Mn, AGR (%), CAGR (%))
Table 99 Latin America Stem Cell Technologies & Applications Market by Type, 2022-2032 (US$ Mn, AGR (%), CAGR (%))
Table 100 Latin America Stem Cell Technologies & Applications Market by Cell Source, 2022-2032 (US$ Mn, AGR (%), CAGR (%))
Table 101 Latin America Stem Cell Technologies & Applications Market by Product, 2022-2032 (US$ Mn, AGR (%), CAGR (%))
Table 102 Latin America Stem Cell Technologies & Applications Market by Technology, 2022-2032 (US$ Mn, AGR (%), CAGR (%))
Table 103 Latin America Stem Cell Technologies & Applications Market by Application, 2022-2032 (US$ Mn, AGR (%), CAGR (%))
Table 104 Brazil Stem Cell Technologies & Applications Market by Value, 2022-2032 (US$ Mn, AGR (%), CAGR (%))
Table 105 Mexico Stem Cell Technologies & Applications Market by Value, 2022-2032 (US$ Mn, AGR (%), CAGR (%))
Table 106 Rest of Latin America Stem Cell Technologies & Applications Market by Value, 2022-2032 (US$ Mn, AGR (%), CAGR (%))
Table 107 Middle East & Africa Stem Cell Technologies & Applications Market by Value, 2022-2032 (US$ Mn, AGR (%), CAGR (%))
Table 108 Middle East & Africa Stem Cell Technologies & Applications Market by Country, 2022-2032 (US$ Mn, AGR (%), CAGR (%))
Table 109 Middle East & Africa Stem Cell Technologies & Applications Market by Type, 2022-2032 (US$ Mn, AGR (%), CAGR (%))
Table 110 Middle East & Africa Stem Cell Technologies & Applications Market by Cell Source, 2022-2032 (US$ Mn, AGR (%), CAGR (%))
Table 111 Middle East & Africa Stem Cell Technologies & Applications Market by Product, 2022-2032 (US$ Mn, AGR (%), CAGR (%))
Table 112 Middle East & Africa Stem Cell Technologies & Applications Market by Technology, 2022-2032 (US$ Mn, AGR (%), CAGR (%))
Table 113 Middle East & Africa Stem Cell Technologies & Applications Market by Application, 2022-2032 (US$ Mn, AGR (%), CAGR (%))
Table 114 UAE Stem Cell Technologies & Applications Market by Value, 2022-2032 (US$ Mn, AGR (%), CAGR (%))
Table 115 South Africa Stem Cell Technologies & Applications Market by Value, 2022-2032 (US$ Mn, AGR (%), CAGR (%))
Table 116 Turkey Stem Cell Technologies & Applications Market by Value, 2022-2032 (US$ Mn, AGR (%), CAGR (%))
Table 117 Rest of Middle East & Africa Stem Cell Technologies & Applications Market by Value, 2022-2032 (US$ Mn, AGR (%), CAGR (%))
Table 118 Key Business Strategies Adopted by Key Players in Global Stem Cell Technologies and Applications Market
Table 119 Key Business Strategies Adopted by Key Players in Global Stem Cell Technologies and Applications Market
Table 120 Key Business Strategies Adopted by Key Players in Global Stem Cell Technologies and Applications Market
Table 121 Key Business Strategies Adopted by Key Players in Global Stem Cell Technologies and Applications Market
Table 122 Key Business Strategies Adopted by Key Players in Global Stem Cell Technologies and Applications Market
Table 123 Key Business Strategies Adopted by Key Players in Global Stem Cell Technologies and Applications Market
Table 124 Key Business Strategies Adopted by Key Players in Global Stem Cell Technologies and Applications Market
Table 125 Key Business Strategies Adopted by Key Players in Global Stem Cell Technologies and Applications Market
Table 126 Key Business Strategies Adopted by Key Players in Global Stem Cell Technologies and Applications Market
Table 127 Key Business Strategies Adopted by Key Players in Global Stem Cell Technologies and Applications Market
Table 128 Key Business Strategies Adopted by Key Players in Global Stem Cell Technologies and Applications Market
Table 129 Athersys, Inc.: Key Details, (CEO, HQ, Revenue, Founded, No. of Employees, Company Type, Website, Business Segment)
Table 130 Athersys, Inc.: Product Benchmarking
Table 131 Athersys, Inc.: Strategic Outlook
Table 132 Bristol-Myers Squibb Company: Key Details, (CEO, HQ, Revenue, Founded, No. of Employees, Company Type, Website, Business Segment)
Table 133 Bristol-Myers Squibb Company: Product Benchmarking
Table 134 Cellular Biomedicine Group, Inc. : Key Details, (CEO, HQ, Revenue, Founded, No. of Employees, Company Type, Website, Business Segment)
Table 135 Cellular Biomedicine Group, Inc. : Product Benchmarking
Table 136 Cellular Biomedicine Group, Inc. : Strategic Outlook
Table 137 Cynata Therapeutics Limited: Key Details, (CEO, HQ, Revenue, Founded, No. of Employees, Company Type, Website, Business Segment)
Table 138 Cynata Therapeutics Limited: Product Benchmarking
Table 139 Cynata Therapeutics Limited: Strategic Outlook
Table 140 Plus Therapeutics, Inc.: Key Details, (CEO, HQ, Revenue, Founded, No. of Employees, Company Type, Website, Business Segment)
Table 141 Plus Therapeutics, Inc.: Product Benchmarking
Table 142 Plus Therapeutics, Inc.: Strategic Outlook
Table 143 BioRestorative Therapies, Inc.: Key Details, (CEO, HQ, Revenue, Founded, No. of Employees, Company Type, Website, Business Segment)
Table 144 BioRestorative Therapies, Inc.: Product Benchmarking
Table 145 BioRestorative Therapies, Inc.: Strategic Outlook
Table 146 Pluristem Therapeutics Inc.: Key Details, (CEO, HQ, Revenue, Founded, No. of Employees, Company Type, Website, Business Segment)
Table 147 Pluristem Therapeutics Inc.: Product Benchmarking
Table 148 Pluristem Therapeutics Inc.: Strategic Outlook
Table 149 Cellaïon SA: Key Details, (CEO, HQ, Revenue, Founded, No. of Employees, Company Type, Website, Business Segment)
Table 150 Cellaïon SA: Product Benchmarking
Table 151 Sangamo Therapeutics, Inc.: Key Details, (CEO, HQ, Revenue, Founded, No. of Employees, Company Type, Website, Business Segment)
Table 152 Sangamo Therapeutics, Inc.: Product Benchmarking
Table 153 Sangamo Therapeutics, Inc.: Strategic Outlook
Table 154 StemCell Technologies Inc.: Key Details, (CEO, HQ, Revenue, Founded, No. of Employees, Company Type, Website, Business Segment)
Table 155 StemCell Technologies Inc.: Product Benchmarking
Table 156 StemCell Technologies Inc.: Strategic Outlook
Table 157 Vericel Corporation: Key Details, (CEO, HQ, Revenue, Founded, No. of Employees, Company Type, Website, Business Segment)
Table 158 Vericel Corporation: Product Benchmarking
Table 159 Vericel Corporation: Strategic Outlook
Table 160 BrainStorm Cell Limited. : Key Details, (CEO, HQ, Revenue, Founded, No. of Employees, Company Type, Website, Business Segment)
Table 161 BrainStorm Cell Limited. : Product Benchmarking
Table 162 BrainStorm Cell Limited. : Strategic Outlook
Table 163 Gamida Cell Ltd.: Key Details, (CEO, HQ, Revenue, Founded, No. of Employees, Company Type, Website, Business Segment)
Table 164 Gamida Cell Ltd.: Product Benchmarking
Table 165 Gamida Cell Ltd.: Strategic Outlook
Table 166 ViaCyte, Inc.: Key Details, (CEO, HQ, Revenue, Founded, No. of Employees, Company Type, Website, Business Segment)
Table 167 ViaCyte, Inc.: Product Benchmarking
Table 168 Kangstem Biotech Co., Ltd.: Key Details, (CEO, HQ, Revenue, Founded, No. of Employees, Company Type, Website, Business Segment)
Table 169 Kangstem Biotech Co., Ltd.: Product Benchmarking
Table 170 Kangstem Biotech Co., Ltd.: Strategic Outlook
List of Figures
Figure 1 Global Stem Cell Technologies and Applications Market Segmentation
Figure 2 Global Stem Cell Technologies and Applications Market Forecast by Region: Market Attractiveness Index
Figure 3 Global Stem Cell Technologies and Applications Market by Type: Market Attractiveness Index
Figure 4 Global Stem Cell Technologies and Applications Market by Cell Source: Market Attractiveness Index
Figure 5 Global Stem Cell Technologies and Applications Market by Product: Market Attractiveness Index
Figure 6 Global Stem Cell Technologies and Applications Market by Technology: Market Attractiveness Index
Figure 7 Global Stem Cell Technologies and Applications Market by Application: Market Attractiveness Index
Figure 8 Global Stem Cell Technologies and Applications Market: Market Dynamics
Figure 9 Global COVID Impact Analysis: Stem Cell Technologies and Applications Market Recovery Scenarios 2022-2032 (US$ Mn, CAGR (%))
Figure 10 Global Stem Cell Technologies and Applications Market by Region, 2022-2032 (US$ Mn, AGR (%)): “V” Shaped Recovery
Figure 11 Global Stem Cell Technologies and Applications Market by Region, 2022-2032 (US$ Mn, AGR (%)): “U” Shaped Recovery
Figure 12 Global Stem Cell Technologies and Applications Market by Region, 2022-2032 (US$ Mn, AGR (%)): “W” Shaped Recovery
Figure 13 Global Stem Cell Technologies and Applications Market by Region, 2022-2032 (US$ Mn, AGR (%)): “L” Shaped Recovery
Figure 14 Global Stem Cell Technologies and Applications Market: Porter’s Five Forces Analysis
Figure 15 Global Stem Cell Technologies and Applications Market: PESTLE Analysis
Figure 16 Global Stem Cell Technologies and Applications Market Forecast by Type 2022-2032 (Revenue, CAGR%)
Figure 17 Global Stem Cell Technologies and Applications Market Share Forecast by Type, 2022, 2032 (%)
Figure 18 Global Stem Cell Technologies & Applications Market by Type, 2022-2032 (US$ Mn)
Figure 19 Global Allogeneic Stem Cell Therapy Market Forecast, 2022-2032 (US$ Mn)
Figure 20 Global Allogeneic Stem Cell Therapy Market by Region, 2022-2032 (US$ Mn)
Figure 21 Global Autologous Stem Cell Therapy Market Forecast, 2022-2032 (US$ Mn)
Figure 22 Global Autologous Stem Cell Therapy Market by Region, 2022-2032 (US$ Mn)
Figure 23 Global Stem Cell Technologies and Applications Market Forecast by Cell Source 2022, 2027, 2032 (Revenue, CAGR (%))
Figure 24 Global Stem Cell Technologies and Applications Market Share Forecast by Cell Source, 2022, 2032 (%)
Figure 25 Global Stem Cell Technologies & Applications Market by Cell Source, 2022-2032 (US$ Mn)
Figure 26 Global Adipose tissue-derived MSCs Market Forecast, 2022-2032 (US$ Mn)
Figure 27 Global Adipose tissue-derived MSCs Market by Region, 2022-2032 (US$ Mn)
Figure 28 Global Bone marrow-derived MSCs Market Forecast, 2022-2032 (US$ Mn)
Figure 29 Global Bone marrow-derived MSCs Market by Region, 2022-2032 (US$ Mn)
Figure 30 Global Placental/umbilical cord-derived MSCs Market Forecast, 2022-2032 (US$ Mn)
Figure 31 Global Placental/umbilical cord-derived MSCs Market by Region, 2022-2032 (US$ Mn)
Figure 32 Global Stem Cell Technologies and Applications Market Forecast by Product 2022, 2027, 2032 (Revenue, CAGR (%))
Figure 33 Global Stem Cell Technologies and Applications Market Share Forecast by Product, 2022, 2032 (%)
Figure 34 Global Stem Cell Technologies & Applications Market by Product, 2022-2032 (US$ Mn)
Figure 35 Global Adult Stem Cells Market Forecast, 2022-2032 (US$ Mn)
Figure 36 Global Adult Stem Cells Market by Region, 2022-2032 (US$ Mn)
Figure 37 Global Human Embryonic Stem Cells Market Forecast, 2022-2032 (US$ Mn)
Figure 38 Global Human Embryonic Stem Cells Market by Region, 2022-2032 (US$ Mn)
Figure 39 Global Induced Pluripotent Stem Cells Market Forecast, 2022-2032 (US$ Mn)
Figure 40 Global Induced Pluripotent Stem Cells Market by Region, 2022-2032 (US$ Mn)
Figure 41 Global Very Small Embryonic Like Stem Cells Market Forecast, 2022-2032 (US$ Mn)
Figure 42 Global Very Small Embryonic Like Stem Cells Market by Region, 2022-2032 (US$ Mn)
Figure 43 Global Stem Cell Technologies and Applications Market Forecast by Technology 2022, 2027, 2032 (Revenue, CAGR (%))
Figure 44 Global Stem Cell Technologies and Applications Market Share Forecast by Technology, 2022, 2032 (%)
Figure 45 Global Stem Cell Technologies & Applications Market by Technology, 2022-2032 (US$ Mn)
Figure 46 Global Cell Acquisition Market Forecast, 2022-2032 (US$ Mn)
Figure 47 Global Cell Acquisition Market by Region, 2022-2032 (US$ Mn)
Figure 48 Global Cell Production Market Forecast, 2022-2032 (US$ Mn)
Figure 49 Global Cell Production Market by Region, 2022-2032 (US$ Mn)
Figure 50 Global Cryopreservation Market Forecast, 2022-2032 (US$ Mn)
Figure 51 Global Cryopreservation Market by Region, 2022-2032 (US$ Mn)
Figure 52 Global Expansion & Sub-Culture Market Forecast, 2022-2032 (US$ Mn)
Figure 53 Global Expansion & Sub-Culture Market by Region, 2022-2032 (US$ Mn)
Figure 54 Global Other Technology Market Forecast, 2022-2032 (US$ Mn)
Figure 55 Global Other Technology Market by Region, 2022-2032 (US$ Mn)
Figure 56 Global Stem Cell Technologies and Applications Market Forecast by Application 2022, 2027, 2032 (Revenue, CAGR (%))
Figure 57 Global Stem Cell Technologies and Applications Market Share Forecast by Application, 2022, 2032 (%)
Figure 58 Global Stem Cell Technologies & Applications Market by Application, 2022-2032 (US$ Mn)
Figure 59 Global Cancer Market Forecast, 2022-2032 (US$ Mn)
Figure 60 Global Cancer Market by Region, 2022-2032 (US$ Mn)
Figure 61 Global Cardiovascular Diseases Market Forecast, 2022-2032 (US$ Mn)
Figure 62 Global Cardiovascular Diseases Market by Region, 2022-2032 (US$ Mn)
Figure 63 Global Neurological Disorders Market Forecast, 2022-2032 (US$ Mn)
Figure 64 Global Neurological Disorders Market by Region, 2022-2032 (US$ Mn)
Figure 65 Global Inflammatory & Autoimmune Diseases Market Forecast, 2022-2032 (US$ Mn)
Figure 66 Global Inflammatory & Autoimmune Diseases Market by Region, 2022-2032 (US$ Mn)
Figure 67 Global Musculoskeletal Disorders Market Forecast, 2022-2032 (US$ Mn)
Figure 68 Global Musculoskeletal Disorders Market by Region, 2022-2032 (US$ Mn)
Figure 69 Global Other Applications Market Forecast, 2022-2032 (US$ Mn)
Figure 70 Global Other Applications Market by Region, 2022-2032 (US$ Mn)
Figure 71 Global Stem Cell Technologies and Applications Market Forecast by Region 2022-2032: Market Attractiveness Index
Figure 72 Global Stem Cell Technologies and Applications Market Share Forecast by Application, 2022, 2032 (%)
Figure 73 Global Stem Cell Technologies & Applications Market Forecast, 2022-2032 (US$ Mn)
Figure 74 Global Stem Cell Technologies & Applications Market Forecast, 2022-2032 (US$ Mn, AGR (%)) (V-Shaped Recovery Scenario)
Figure 75 Global Stem Cell Technologies & Applications Market Forecast, 2022-2032 (US$ Mn, AGR (%)) (W-Shaped Recovery Scenario)
Figure 76 Global Stem Cell Technologies & Applications Market Forecast, 2022-2032 (US$ Mn, AGR (%)) (U-Shaped Recovery Scenario)
Figure 77 Global Stem Cell Technologies & Applications Market Forecast, 2022-2032 (US$ Mn, AGR (%)) (L-Shaped Recovery Scenario)
Figure 78 Global Stem Cell Technologies & Applications Market by Region, 2022-2032 (US$ Mn, AGR (%))
Figure 79 Global Stem Cell Technologies & Applications Market by Region, 2022-2032 (US$ Mn, AGR (%)) (V-Shaped Recovery Scenario)
Figure 80 Global Stem Cell Technologies & Applications Market by Region, 2022-2032 (US$ Mn, AGR (%)) (W-Shaped Recovery Scenario)
Figure 81 Global Stem Cell Technologies & Applications Market by Region, 2022-2032 (US$ Mn, AGR (%)) (U-Shaped Recovery Scenario)
Figure 82 Global Stem Cell Technologies & Applications Market by Region, 2022-2032 (US$ Mn, AGR (%)) (L-Shaped Recovery Scenario)
Figure 83 North America Stem Cell Technologies and Applications Market by Country: Market Attractiveness Index
Figure 84 North America Stem Cell Technologies & Applications Market by Value, 2022-2032 (US$ Mn)
Figure 85 North America Stem Cell Technologies & Applications Market by Country, 2022-2032 (US$ Mn)
Figure 86 North America Stem Cell Technologies and Applications Market Share Forecast by Country, 2022 & 2032 (%)
Figure 87 North America Stem Cell Technologies & Applications Market by Type, 2022-2032 (US$ Mn)
Figure 88 North America Stem Cell Technologies and Applications Market Share Forecast by Type, 2022 & 2032 (%)
Figure 89 North America Stem Cell Technologies & Applications Market by Cell Source, 2022-2032 (US$ Mn)
Figure 90 North America Stem Cell Technologies and Applications Market Share Forecast by Cell Source, 2022 & 2032 (%)
Figure 91 North America Stem Cell Technologies & Applications Market by Product, 2022-2032 (US$ Mn)
Figure 92 North America Stem Cell Technologies and Applications Market Share Forecast by Product, 2022 & 2032 (%)
Figure 93 North America Stem Cell Technologies & Applications Market by Technology, 2022-2032 (US$ Mn)
Figure 94 North America Stem Cell Technologies and Applications Market Share Forecast by Technology, 2022 & 2032 (%)
Figure 95 North America Stem Cell Technologies & Applications Market by Application, 2022-2032 (US$ Mn)
Figure 96 North America Stem Cell Technologies and Applications Market Share Forecast by Application, 2022 & 2032 (%)
Figure 97 US Stem Cell Technologies & Applications Market by Value, 2022-2032 (US$ Mn)
Figure 98 Canada Stem Cell Technologies & Applications Market by Value, 2022-2032 (US$ Mn)
Figure 99 Europe Stem Cell Technologies and Applications Market by Country: Market Attractiveness Index
Figure 100 Europe Stem Cell Technologies & Applications Market by Value, 2022-2032 (US$ Mn)
Figure 101 Europe Stem Cell Technologies & Applications Market by Country, 2022-2032 (US$ Mn)
Figure 102 Europe Stem Cell Technologies and Applications Market Share Forecast by Country, 2022 & 2032 (%)
Figure 103 Europe Stem Cell Technologies & Applications Market by Type, 2022-2032 (US$ Mn)
Figure 104 Europe Stem Cell Technologies and Applications Market Share Forecast by Type, 2022 & 2032 (%)
Figure 105 Europe Stem Cell Technologies & Applications Market by Cell Source, 2022-2032 (US$ Mn)
Figure 106 Europe Stem Cell Technologies and Applications Market Share Forecast by Cell Source, 2022 & 2032 (%)
Figure 107 Europe Stem Cell Technologies & Applications Market by Product, 2022-2032 (US$ Mn)
Figure 108 Europe Stem Cell Technologies and Applications Market Share Forecast by Product, 2022 & 2032 (%)
Figure 109 Europe Stem Cell Technologies & Applications Market by Technology, 2022-2032 (US$ Mn)
Figure 110 Europe Stem Cell Technologies and Applications Market Share Forecast by Technology, 2022 & 2032 (%)
Figure 111 Europe Stem Cell Technologies & Applications Market by Application, 2022-2032 (US$ Mn)
Figure 112 Europe Stem Cell Technologies and Applications Market Share Forecast by Application, 2022 & 2032 (%)
Figure 113 Germany Stem Cell Technologies & Applications Market by Value, 2022-2032 (US$ Mn)
Figure 114 UK Stem Cell Technologies & Applications Market by Value, 2022-2032 (US$ Mn)
Figure 115 France Stem Cell Technologies & Applications Market by Value, 2022-2032 (US$ Mn)
Figure 116 Italy Stem Cell Technologies & Applications Market by Value, 2022-2032 (US$ Mn)
Figure 117 Spain Stem Cell Technologies & Applications Market by Value, 2022-2032 (US$ Mn)
Figure 118 Rest of Europe Stem Cell Technologies & Applications Market by Value, 2022-2032 (US$ Mn)
Figure 119 Asia-Pacific Stem Cell Technologies and Applications Market by Country: Market Attractiveness Index
Figure 120 Asia-Pacific Stem Cell Technologies & Applications Market by Value, 2022-2032 (US$ Mn)
Figure 121 Asia-Pacific Stem Cell Technologies & Applications Market by Country, 2022-2032 (US$ Mn)
Figure 122 Asia-Pacific Stem Cell Technologies and Applications Market Share Forecast by Country, 2022 & 2032 (%)
Figure 123 Asia-Pacific Stem Cell Technologies & Applications Market by Type, 2022-2032 (US$ Mn)
Figure 124 Asia-Pacific Stem Cell Technologies and Applications Market Share Forecast by Type, 2022 & 2032 (%)
Figure 125 Asia-Pacific Stem Cell Technologies & Applications Market by Cell Source, 2022-2032 (US$ Mn)
Figure 126 Asia-Pacific Stem Cell Technologies and Applications Market Share Forecast by Cell Source, 2022 & 2032 (%)
Figure 127 Asia-Pacific Stem Cell Technologies & Applications Market by Product, 2022-2032 (US$ Mn)
Figure 128 Asia-Pacific Stem Cell Technologies and Applications Market Share Forecast by Product, 2022 & 2032 (%)
Figure 129 Asia-Pacific Stem Cell Technologies & Applications Market by Technology, 2022-2032 (US$ Mn)
Figure 130 Asia-Pacific Stem Cell Technologies and Applications Market Share Forecast by Technology, 2022 & 2032 (%)
Figure 131 Asia-Pacific Stem Cell Technologies & Applications Market by Application, 2022-2032 (US$ Mn)
Figure 132 Asia-Pacific Stem Cell Technologies and Applications Market Share Forecast by Application, 2022 & 2032 (%)
Figure 133 Japan Stem Cell Technologies & Applications Market by Value, 2022-2032 (US$ Mn)
Figure 134 China Stem Cell Technologies & Applications Market by Value, 2022-2032 (US$ Mn)
Figure 135 India Stem Cell Technologies & Applications Market by Value, 2022-2032 (US$ Mn)
Figure 136 South Korea Stem Cell Technologies & Applications Market by Value, 2022-2032 (US$ Mn)
Figure 137 Australia Stem Cell Technologies & Applications Market by Value, 2022-2032 (US$ Mn)
Figure 138 Rest of Asia-Pacific Stem Cell Technologies & Applications Market by Value, 2022-2032 (US$ Mn)
Figure 139 Latin America Stem Cell Technologies and Applications Market by Country: Market Attractiveness Index
Figure 140 Latin America Stem Cell Technologies & Applications Market by Value, 2022-2032 (US$ Mn)
Figure 141 Latin America Stem Cell Technologies & Applications Market by Country, 2022-2032 (US$ Mn)
Figure 142 Latin America Stem Cell Technologies and Applications Market Share Forecast by Country, 2022 & 2032 (%)
Figure 143 Latin America Stem Cell Technologies & Applications Market by Type, 2022-2032 (US$ Mn)
Figure 144 Latin America Stem Cell Technologies and Applications Market Share Forecast by Type, 2022 & 2032 (%)
Figure 145 Latin America Stem Cell Technologies & Applications Market by Cell Source, 2022-2032 (US$ Mn)
Figure 146 Latin America Stem Cell Technologies and Applications Market Share Forecast by Cell Source, 2022 & 2032 (%)
Figure 147 Latin America Stem Cell Technologies & Applications Market by Product, 2022-2032 (US$ Mn)
Figure 148 Latin America Stem Cell Technologies and Applications Market Share Forecast by Product, 2022 & 2032 (%)
Figure 149 Latin America Stem Cell Technologies & Applications Market by Technology, 2022-2032 (US$ Mn)
Figure 150 Latin America Stem Cell Technologies and Applications Market Share Forecast by Technology, 2022 & 2032 (%)
Figure 151 Latin America Stem Cell Technologies & Applications Market by Application, 2022-2032 (US$ Mn)
Figure 152 Latin America Stem Cell Technologies and Applications Market Share Forecast by Application, 2022 & 2032 (%)
Figure 153 Brazil Stem Cell Technologies & Applications Market by Value, 2022-2032 (US$ Mn)
Figure 154 Mexico Stem Cell Technologies & Applications Market by Value, 2022-2032 (US$ Mn)
Figure 155 Rest of Latin America Stem Cell Technologies & Applications Market by Value, 2022-2032 (US$ Mn)
Figure 156 Middle East & Africa Stem Cell Technologies and Applications Market by Country: Market Attractiveness Index
Figure 157 Middle East & Africa Stem Cell Technologies & Applications Market by Value, 2022-2032 (US$ Mn)
Figure 158 Middle East & Africa Stem Cell Technologies & Applications Market by Country, 2022-2032 (US$ Mn)
Figure 159 Middle East & Africa Stem Cell Technologies and Applications Market Share Forecast by Country, 2022 & 2032 (%)
Figure 160 Middle East & Africa Stem Cell Technologies & Applications Market by Type, 2022-2032 (US$ Mn)
Figure 161 Middle East & Africa Stem Cell Technologies and Applications Market Share Forecast by Type, 2022 & 2032 (%)
Figure 162 Middle East & Africa Stem Cell Technologies & Applications Market by Cell Source, 2022-2032 (US$ Mn)
Figure 163 Middle East & Africa Stem Cell Technologies and Applications Market Share Forecast by Cell Source, 2022 & 2032 (%)
Figure 164 Middle East & Africa Stem Cell Technologies & Applications Market by Product, 2022-2032 (US$ Mn)
Figure 165 Middle East & Africa Stem Cell Technologies and Applications Market Share Forecast by Product, 2022 & 2032 (%)
Figure 166 Middle East & Africa Stem Cell Technologies & Applications Market by Technology, 2022-2032 (US$ Mn)
Figure 167 Middle East & Africa Stem Cell Technologies and Applications Market Share Forecast by Application, 2022 & 2032 (%)
Figure 168 Middle East & Africa Stem Cell Technologies & Applications Market by Application, 2022-2032 (US$ Mn)
Figure 169 Middle East & Africa Stem Cell Technologies and Applications Market Share Forecast by Application, 2022 & 2032 (%)
Figure 170 UAE Stem Cell Technologies & Applications Market by Value, 2022-2032 (US$ Mn)
Figure 171 South Africa Stem Cell Technologies & Applications Market by Value, 2022-2032 (US$ Mn)
Figure 172 Turkey Stem Cell Technologies & Applications Market by Value, 2022-2032 (US$ Mn)
Figure 173 Rest of Middle East & Africa Stem Cell Technologies & Applications Market by Value, 2022-2032 (US$ Mn)
Figure 174 Global Stem Cell Technologies and Applications Market: Company Share Analysis, 2021
Figure 175 Athersys, Inc.: Net Revenue, 2017-2021 (US$ million, AGR (%))
Figure 176 Athersys, Inc.: Gross Profit, 2017-2021 (US$ million, AGR (%))
Figure 177 Athersys, Inc.: R&D, 2017-2021 (US$ million, AGR (%))
Figure 178 Athersys, Inc.: EBITDA, 2017-2021 (US$ million, AGR (%))
Figure 179 Bristol-Myers Squibb Company: Net Revenue, 2017-2021 (US$ million, AGR (%))
Figure 180 Bristol-Myers Squibb Company: Gross Profit, 2017-2021 (US$ million, AGR (%))
Figure 181 Bristol-Myers Squibb Company: R&D, 2017-2021 (US$ million, AGR (%))
Figure 182 Bristol-Myers Squibb Company: EBITDA, 2017-2021 (US$ million, AGR (%))
Figure 183 Cellular Biomedicine Group, Inc. : Net Revenue, 2017-2021 (US$ million, AGR (%))
Figure 184 Cellular Biomedicine Group, Inc. : Gross Profit, 2017-2021 (US$ million, AGR (%))
Figure 185 Cellular Biomedicine Group, Inc. : R&D, 2017-2021 (US$ million, AGR (%))
Figure 186 Cellular Biomedicine Group, Inc. : EBITDA, 2017-2021 (US$ million, AGR (%))
Figure 187 Cynata Therapeutics Limited: Gross Profit, 2017-2021 (US$ million, AGR (%))
Figure 188 Cynata Therapeutics Limited: R&D, 2017-2021 (US$ million, AGR (%))
Figure 189 Cynata Therapeutics Limited: EBITDA, 2017-2021 (US$ million, AGR (%))
Figure 190 Plus Therapeutics, Inc.: Net Revenue, 2017-2021 (US$ million, AGR (%))
Figure 191 Plus Therapeutics, Inc.: Gross Profit, 2017-2021 (US$ million, AGR (%))
Figure 192 Plus Therapeutics, Inc.: R&D, 2017-2021 (US$ million, AGR (%))
Figure 193 Plus Therapeutics, Inc.: EBITDA, 2017-2021 (US$ million, AGR (%))
Figure 194 BioRestorative Therapies, Inc.: Net Revenue, 2017-2021 (US$ million, AGR (%))
Figure 195 BioRestorative Therapies, Inc.: Gross Profit, 2017-2021 (US$ million, AGR (%))
Figure 196 BioRestorative Therapies, Inc.: R&D, 2017-2021 (US$ million, AGR (%))
Figure 197 BioRestorative Therapies, Inc.: EBITDA, 2017-2021 (US$ million, AGR (%))
Figure 198 Pluristem Therapeutics Inc.: Net Revenue, 2017-2021 (US$ million, AGR (%))
Figure 199 Pluristem Therapeutics Inc.: Gross Profit, 2017-2021 (US$ million, AGR (%))
Figure 200 Pluristem Therapeutics Inc.: R&D, 2017-2021 (US$ million, AGR (%))
Figure 201 Pluristem Therapeutics Inc.: EBITDA, 2017-2021 (US$ million, AGR (%))
Figure 202 Sangamo Therapeutics, Inc.: Net Revenue, 2017-2021 (US$ million, AGR (%))
Figure 203 Sangamo Therapeutics, Inc.: Gross Profit, 2017-2021 (US$ million, AGR (%))
Figure 204 Sangamo Therapeutics, Inc.: R&D, 2017-2021 (US$ million, AGR (%))
Figure 205 Sangamo Therapeutics, Inc.: EBITDA, 2017-2021 (US$ million, AGR (%))
Figure 206 StemCell Technologies Inc.: Net Revenue, 2017-2021 (US$ million, AGR (%))
Figure 207 StemCell Technologies Inc.: Gross Profit, 2017-2021 (US$ million, AGR (%))
Figure 208 StemCell Technologies Inc.: R&D, 2017-2021 (US$ million, AGR (%))
Figure 209 StemCell Technologies Inc.: EBITDA, 2017-2021 (US$ million, AGR (%))
Figure 210 Vericel Corporation: Net Revenue, 2017-2021 (US$ million, AGR (%))
Figure 211 Vericel Corporation: Gross Profit, 2017-2021 (US$ million, AGR (%))
Figure 212 Vericel Corporation: R&D, 2017-2021 (US$ million, AGR (%))
Figure 213 Vericel Corporation: EBITDA, 2017-2021 (US$ million, AGR (%))
Figure 214 BrainStorm Cell Limited. : R&D, 2017-2021 (US$ million, AGR (%))
Figure 215 BrainStorm Cell Limited. : EBITDA, 2017-2021 (US$ million, AGR (%))
Figure 216 Gamida Cell Ltd.: R&D, 2017-2021 (US$ million, AGR (%))
Figure 217 Gamida Cell Ltd.: EBITDA, 2017-2021 (US$ million, AGR (%))
Figure 218 Kangstem Biotech Co., Ltd.: Net Revenue, 2017-2021 (US$ million, AGR (%))
Figure 219 Kangstem Biotech Co., Ltd.: Gross Profit, 2017-2021 (US$ million, AGR (%))
Figure 220 Kangstem Biotech Co., Ltd.: R&D, 2017-2021 (US$ million, AGR (%))
Figure 221 Kangstem Biotech Co., Ltd.: EBITDA, 2017-2021 (US$ million, AGR (%))
ページTOPに戻る
- Ultrasound AI Market by Product (AI-enabled System (POCUS, Handheld, Cart), Solutions (Image Evaluation, Radiology)), Brand (Echopac, Aplio, Acuson, Butterfly), Application (OB/GYN, Cardio, Ortho), End User (Hospital, Clinic, ACC) - Global Forecast to 2030
- 遺伝子組換えリムルスおよび遺伝子組換えC因子試薬 - 世界市場シェアとランキング、全体売上高と需要予測 2025-2031
- コハク酸フロバトリプタン錠 - 世界市場シェア・ランキング、全体売上高・需要予測 2025-2031
- ハードカプセルの世界市場シェアとランキング、全体売上高と需要予測 2025-2031
- 人工代替血液 - 世界市場シェア・ランキング、全体売上高・需要予測 2025-2031
- フィブリノゲン - 世界市場シェア・ランキング、全体売上高・需要予測 2025-2031
- 副腎皮質ホルモンAPI - 世界市場シェアとランキング、総売上高と需要予測 2025-2031
- 救急箱 - 世界市場シェア・ランキング、全体売上高・需要予測 2025-2031
- 救急箱 - 世界市場シェア・ランキング、全体売上高・需要予測 2025-2031
- インドシアニングリーン - 世界市場シェア・ランキング、全体売上高・需要予測 2025-2031
よくあるご質問
Visiongain社はどのような調査会社ですか?
英国の調査会社ヴィジョンゲイン社(Visiongain)は、通信とエネルギーのほか、自動車や化学・医薬品、金属など、広範な市場を対象に調査を行っています。自動車市場については、市場全般に関する調査のほ... もっと見る
調査レポートの納品までの日数はどの程度ですか?
在庫のあるものは速納となりますが、平均的には 3-4日と見て下さい。
但し、一部の調査レポートでは、発注を受けた段階で内容更新をして納品をする場合もあります。
発注をする前のお問合せをお願いします。
注文の手続きはどのようになっていますか?
1)お客様からの御問い合わせをいただきます。
2)見積書やサンプルの提示をいたします。
3)お客様指定、もしくは弊社の発注書をメール添付にて発送してください。
4)データリソース社からレポート発行元の調査会社へ納品手配します。
5) 調査会社からお客様へ納品されます。最近は、pdfにてのメール納品が大半です。
お支払方法の方法はどのようになっていますか?
納品と同時にデータリソース社よりお客様へ請求書(必要に応じて納品書も)を発送いたします。
お客様よりデータリソース社へ(通常は円払い)の御振り込みをお願いします。
請求書は、納品日の日付で発行しますので、翌月最終営業日までの当社指定口座への振込みをお願いします。振込み手数料は御社負担にてお願いします。
お客様の御支払い条件が60日以上の場合は御相談ください。
尚、初めてのお取引先や個人の場合、前払いをお願いすることもあります。ご了承のほど、お願いします。
データリソース社はどのような会社ですか?
当社は、世界各国の主要調査会社・レポート出版社と提携し、世界各国の市場調査レポートや技術動向レポートなどを日本国内の企業・公官庁及び教育研究機関に提供しております。
世界各国の「市場・技術・法規制などの」実情を調査・収集される時には、データリソース社にご相談ください。
お客様の御要望にあったデータや情報を抽出する為のレポート紹介や調査のアドバイスも致します。
|
|

