バイオシミラーとフォローオンバイオロジクスの市場レポート:2023-2033
Biosimilars and Follow-On Biologics Market Report 2023-2033
レポート詳細
バイオシミラーとフォローオンバイオロジクスの市場レポート 2023-2033 :本レポートは、新たな収益の柱を目指すリーディングカンパニーが、業界とその背景にあるダイナミクスをより深く... もっと見る
※上記価格は部署ライセンス(Departmental licence)価格です。
その他の価格についてはデータリソースまでお問合せください。
日本語のページは自動翻訳を利用し作成しています。
実際のレポートは英文のみでご納品いたします。
サマリー
レポート詳細
バイオシミラーとフォローオンバイオロジクスの市場レポート 2023-2033:本レポートは、新たな収益の柱を目指すリーディングカンパニーが、業界とその背景にあるダイナミクスをより深く理解する上で、非常に有益なものとなるでしょう。また、異業種への進出や新地域での既存事業の拡大を目指す企業にとっても有用なレポートです。
バイオシミラーへのアクセスを遅らせる規制上のハードル
標準的なジェネリック医薬品に関する規制が以前から整備されている成熟した地域でも、特に高度なジェネリック医薬品に関しては、一定の課題が残っています。例えば、呼吸器系や一部の長時間作用型注射剤などの製品カテゴリーでは、依然として大量のエビデンスの作成が必要であり、これがコストを押し上げ、これらの市場におけるジェネリック医薬品の利用を制限しています。また、知的財産権(IP)に関する紛争や訴訟も頻繁に発生しており、オリジネーターは、提出された技術革新に対して当初の予定よりも長い保護期間を付与され、ジェネリック医薬品の利用を遅らせています。
同様に、バイオシミラーの規制経路が十分に明確化されているにもかかわらず、臨床試験費用は法外な額で推移しています。薬事科学や特性評価能力の向上により、このような規制の必要性が低くなることが予想されるとしても、研究者や生産者は高いリスクにさらされています。
また、新興国の中には、製品開発を迅速に行うための適切な規制環境の確立に苦労している国もある。これらの変数はジェネリック医薬品やバイオシミラーの開発に影響を与えますが、より独創的なパイプラインを構築しようとする場合には、より強い影響を及ぼします。十分な品質と有効性を確保しつつ、市場参入を加速するためには、規制要件をさらに簡素化することが重要でしょう。
ジェネリック医薬品・バイオシミラー企業にとって、新興国でのプレゼンス構築は引き続き課題となる新興国は大きな発展の可能性を秘めており、医薬品へのアクセスを向上させるために不可欠な市場ですが、同時にジェネリック医薬品とバイオシミラー医薬品企業にとって構造的・競争的に大きな課題も抱えています。現地での熾烈な競争はプレーヤーにとってこれらの市場でのプレゼンス確立を困難にしていますが、不安定な経済状況、価格統制、一部の市場における現地生産の推進、地域ごとに変化する規制要件などの追加的な要因はすべて、プレーヤーがこれらの市場にうまく注力する能力に影響を及ぼしています。また、一部の国では通貨の影響により、国際的な企業がこれらの市場に参入し、その発展を支援することが難しくなる可能性もあります。過去の提携や買収の成功例もさまざまで、この分野のプレーヤーは全体的な成長パフォーマンスに限界があります。
このような状況下では、自国の市場力学に精通した現地プレーヤーが、発展途上国経済を成長させる可能性はさらに高くなると思われます。国際的なプレーヤーは、ターゲットとなる国の慎重な選択(例えば、米国やEUのような他の市場と同等の法的要件を持つ市場)に集中し、すぐに見返りのない費用のかかる拡大策を避けるために、オーダーメイドのポートフォリオアプローチを実行する必要があります。
マーケットリサーチレポートを購入する前に、どのような質問をすべきでしょうか?
- バイオシミラーとフォローオンバイオロジクスの市場はどのように進化しているか?
- バイオシミラーとフォローオンバイオロジクス市場の推進要因と抑制要因は何か?
- バイオシミラーとフォローオンバイオロジクスの各サブマーケット区分は予測期間中にどのように成長し、2033年にこれらのサブマーケットが占める売上はどの程度になるのか?
- 2023年から2033年にかけて、各バイオシミラーとフォローオンバイオロジクスのサブマーケットの市場シェアはどのように推移するのでしょうか?
- 2023年から2033年にかけて、市場全体の主なドライバーは何になるのでしょうか?
- バイオシミラーとフォローオンバイオロジクスの主要市場はマクロ経済のダイナミクスに概ね追随するのか、それとも個々の国内市場が他を凌駕するのか?
- 2033年までに各国市場のシェアはどのように変化し、どの地域が2033年の市場をリードするのでしょうか。
- 主要プレイヤーは誰か、また予測期間中の見通しは?
- これらの主要企業のバイオシミラーとフォローオンバイオロジクスの後続品プロジェクトはどのようなものですか?
- 2023年から2033年の間に、業界はどのように進化していくのでしょうか?バイオシミラーと
現在および今後10年間に実施されるバイオシミラーとフォローオンバイオロジクスのプロジェクトにはどのような意味がありますか?
- バイオシミラーとフォローオンバイオロジクスの後続品市場をさらに拡大するために、製品の商業化の必要性が高まっていますか?
- バイオシミラーとフォローオンバイオロジクス市場はどこへ向かい、どのようにして市場の最前線に立つことを確実にするのか?
- 新製品・新サービスのための最適な投資オプションは?
- 企業を新たな成長軌道に乗せ、C-suiteに移行させるための重要な展望とは?
バイオシミラーとフォローオンバイオロジクス市場が現在、そして今後10年間にどのような影響を受けるかを知る必要があります。
- 337ページにわたる本レポートでは、127の表と154のグラフを独占的に提供します。
- このレポートでは、業界における主要な収益性の高い分野をハイライトしているため、今すぐターゲットを絞ることができます。
- 世界、地域、国別の売上高と成長率を詳細に分析しています。
- 競合他社が成功した主なトレンド、変化、収益予測をハイライトしています。
本レポートは、バイオシミラーとフォローオンバイオロジクスの市場が今後10年間にどのように発展し、コビド19の景気後退と回復の変動に沿うかを教えてくれるものです。この市場は、過去10年間のどの時点よりも、今がより重要なのです。
2033年までの予測やその他の分析により、商業的な展望が見えてきた
- 2033年までの収益予測に加え、直近の実績、成長率、市場シェアもご覧いただけます。
- ビジネスの展望や展開など、独自の分析もご覧いただけます。
- 定性的分析(市場力学、ドライバー、機会、阻害要因など)、ポーターの5つの力分析、PEST分析、最近の動向などをご覧いただけます。
本レポートでは、COVID-19が業界と貴社にどのような影響を及ぼすかについて、データ分析と貴重な洞察を掲載しています。本レポートでは、COVID-19の4つの回収パターンとその影響、すなわち「V」、「L」、「W」、「U」について論じています。
報告書の対象セグメント
製造タイプ
- インハウス
- CMO
タイプ
- モノクローナル抗体
- 融合タンパク質
- インスリン
- エリスロポエチン
- 顆粒球コロニー刺激因子
- インターフェロン
- 成長ホルモン
- 不妊症治療薬
- その他
用途
- 血液疾患
- がん関連疾患
- 慢性・自己免疫疾患
- 成長ホルモン欠乏症
- その他
技術紹介
- RDNA技術
- MAbs技術
- バイオアッセイ技術
世界市場全体とセグメントの収益予測に加え、5つの地域と18の主要国市場の収益予測も掲載しています。
北米
- 米国
- カナダ
欧州
- ドイツ
- 英国
- フランス
- イタリア
- スペイン
- その他の欧州
アジア太平洋
- 日本
- 中国
- インド
- その他のアジア太平洋地域
ラテンアメリカ
- ブラジル
- メキシコ
- その他のラテンアメリカ地域
MEA
- GCC
- 南アフリカ
- その他のMEA地域
バイオシミラーとフォローオンバイオロジクス市場の2023年から2033年までの主要企業のプロファイルと、これらの企業のこのセグメントに焦点を当てた内容も含まれています。
主要企業と市場成長の可能性
・ 3SBio, Inc.
・ AMEGA Biotech
・ Amgen Inc.
・ Apotex, Inc.
・ BIOCAD
・ Biocon Limited
・ Biogen, Inc.
・ Celltrion Healthcare Co., Ltd.
・ Coherus BioSciences
・ Dr. Reddy’s Laboratories Ltd.
・ Eli Lilly and Company
・ Gedeon Richter PLC
・ Intas Pharmaceutical Ltd.
・ Mabxience SA
・ Viatris Inc. (Mylan NV)
・ Novartis AG
・ Pfizer Inc.
・ Samsung Bioepis Co. Ltd.
・ Stada Arzneimittel AG
・ Teva Pharmaceutical
バイオシミラーとフォローオンバイオロジクス市場の世界全体の収益、2023年から2033年までの金額ベースで、市場は2022年に196億6800万米ドルを超えると、我々の仕事は計算しています。また、2033年までの間に売上高が大きく伸びると予測しています。本調査では、最も大きな可能性を秘めた組織を特定します。彼らの能力、進歩、商業的展望を発見することで、一歩先を行くことができます。
バイオシミラーとフォローオンバイオロジクスの市場、2023年から2033年 までのレポートはどのように役立つのでしょうか?
330ページを超えるレポートでは、要約すると以下のような知識を得ることができます。
- バイオシミラーとフォローオンバイオロジクスのの市場、2023年から2033年までの収益予測 世界と地域レベルでの製造タイプ、種類、用途、技術ごとの予測を掲載 - 業界の展望を発見し、投資と収益に最も有利な場所を見つけます。
- 5つの地域と18の主要国市場の2033年までの収益予測 - 北米、欧州、アジア太平洋、中南米、MEAのバイオシミラーとフォローオン生物製剤市場の2023年から2033年までの市場予測をご覧ください。また、米国、カナダ、メキシコ、ブラジル、ドイツ、フランス、英国、イタリア、中国、インド、日本、オーストラリアなどの主要経済圏の市場も予測されています。
- バイオシミラーとフォローオンバイオロジクスの市場に関わる主要企業20社の企業プロファイルを含む、既存企業と市場参入を目指す企業の展望(2023年から2033年まで)。
定量的・定性的な分析と独自の予測をご覧いただけます。私たちのレポートだけが持つ情報を入手し、貴重なビジネスインテリジェンスを得ることができます。
他にはない情報
私たちの新しいレポートがあれば、知識の遅れを取り戻し、チャンスを逃す可能性が低くなります。私たちの研究が貴社の調査、分析、意思決定にどのように役立つかをご覧ください。Visiongainの研究は、バイオシミラーとフォローオン生物製剤市場、2023年から2033年、市場をリードする企業のための商業分析を必要とするすべての人のためのものです。データ、トレンド、予測を見つけることができます。
ページTOPに戻る
目次
目次
1.レポートの概要
1.1 調査の目的
1.2 バイオシミラーとフォローオンバイオロジクスの市場紹介
1.3 本レポートが提供するもの
1.4 本レポートを読むべき理由
1.5 本分析レポートが回答する主な質問には以下が含まれます。
1.6 本レポートは誰のためのものなのか?
1.7 方法論
1.7.1 市場の定義
1.7.2 市場評価・予測手法
1.7.3 データの検証
1.7.3.1 一次調査
1.7.3.2 セカンダリーリサーチ
1.8 よくある質問(FAQ)
1.9 関連するVisiongainのレポート
1.10 Visiongainについて
2 エグゼクティブサマリー
3 市場の概要
3.1 主要な調査結果
3.2 マーケットダイナミクス
3.2.1 市場の推進要因
3.2.1.1 バイオシミラーを採用するプロバイダーへの動機付け
3.2.1.2 世界のバイオシミラーとフォローオンバイオロジクスの市場成長を牽引する先進地域
3.2.1.3 生物製剤の特許失効により、今後10年間、バイオシミラー企業にとって新たな収益ポケットが生まれる可能性
3.2.1.4 生物製剤と比較したバイオシミラーの価格優位性は、市場成長を促進すると予想される
3.2.2 市場抑制要因
3.2.2.1 製造における高コスト、不確実性、複雑性
3.2.2.2 生物製剤メーカーからの抵抗が市場成長を抑制
3.2.2.3 バイオシミラーへの切り替えに消極的な医療従事者
3.2.3 市場機会
3.2.3.1 先発メーカーの情報を活用し、開発・承認プロセスの短縮が可能
3.2.3.2 当局のアプローチの多様性
3.3 トレンド
3.3.1 規制上のハードルがバイオシミラーへのアクセスを遅らせる
3.3.2 COVID-19における世界の医薬品製造の脆弱性
3.3.3 新興国は、ジェネリック医薬品とバイオシミラー企業のプレゼンス構築のための課題をもたらし続けている
3.3.4 バイオシミラー産業の研究強化のための主要な実現手段としてのデジタル変革
3.4 COVID-19影響度分析
3.5 ポーターのファイブフォース分析
3.5.1 供給者パワー
3.5.2 バイヤーパワー
3.5.3 競合他社の競争力
3.5.4 代替品による脅威
3.5.5 新規参入者の脅威
3.6 PEST分析
3.6.1 バイオシミラーとフォローオンバイオロジクスの市場に影響を与える政治的要因
3.6.2 バイオシミラーとフォローオンバイオロジクスの市場に影響を与える経済的要因
3.6.3 バイオシミラーとフォローオンバイオロジクスの市場に影響を与える社会的要因
3.6.4 バイオシミラーとフォローオンバイオロジクスの市場に影響を与える技術的要因
4 バイオシミラーとフォローオンバイオロジック市場分析:製造タイプ別
4.1 主な調査結果
4.2 製造業の種類別セグメント市場魅力度指数
4.3 バイオシミラーとフォローオンバイオロジクスの製造タイプ別市場規模の推定と予測
4.4 インハウス
4.4.1 地域別市場予測、2023-2033 (US$ Mn)
4.4.2 地域別市場シェア、2023年&2033年(%)
4.5 CMO
4.5.1 地域別市場予測、2023年~2033年 (US$ Mn)
4.5.2 地域別市場シェア、2023年&2033年(%)
5 バイオシミラーとフォローオンバイオロジック市場分析:タイプ別
5.1 主要な調査結果
5.2 バイオシミラーとバイオロジクスのタイプ別市場規模の推定と予測
5.3 モノクローナル抗体
5.3.1 地域別市場予測、2023年〜2033年 (US$ Mn)
5.3.2 地域別市場シェア、2023年&2033年(%)
5.4 融合タンパク質
5.4.1 地域別市場予測、2023年~2033年(US$ Mn)
5.4.2 地域別市場シェア、2023年&2033年(%)
5.5 インスリン
5.5.1 地域別市場予測、2023年~2033年 (US$ Mn)
5.5.2 地域別市場シェア、2023年&2033年(%)
5.6 エリスロポエチン
5.6.1 地域別市場予測、2023年~2033年(US$ Mn)
5.6.2 地域別市場シェア、2023年&2033年(%)
5.7 グラニュロサイトコロニー刺激因子
5.7.1 地域別市場予測、2023年~2033年 (US$ Mn)
5.7.2 地域別市場シェア、2023年&2033年(%)
5.8 インターフェロン
5.8.1 地域別市場予測、2023年〜2033年 (US$ Mn)
5.8.2 地域別市場シェア、2023年&2033年(%)
5.9 成長ホルモン剤
5.9.1 地域別市場予測、2023年〜2033年 (US$ Mn)
5.9.2 地域別市場シェア、2023年&2033年(%)
5.10 排卵誘発ホルモン剤
5.10.1 地域別市場予測、2023年~2033年 (US$ Mn)
5.10.2 地域別市場シェア、2023年&2033年(%)
5.11 その他
5.11.1 地域別市場予測、2023年〜2033年 (US$ Mn)
5.11.2 地域別市場シェア、2023年&2033年(%)
6 バイオシミラーとフォローオンバイオロジック市場分析:用途別
6.1 主な調査結果
6.2 用途別セグメント市場魅力度指数
6.3 バイオシミラーとフォローオンバイオロジクスの市場規模の推定と予測用途別
6.4 血液疾患
6.4.1 地域別市場予測、2023年〜2033年 (US$ Mn)
6.4.2 地域別市場シェア、2023年&2033年(%)
6.5 腫瘍性疾患
6.5.1 地域別市場予測、2023年〜2033年 (US$ Mn)
6.5.2 地域別市場シェア、2023年&2033年(%)
6.6 慢性疾患・自己免疫疾患
6.6.1 地域別市場予測、2023年~2033年 (US$ Mn)
6.6.2 地域別市場シェア、2023年&2033年(%)
6.7 成長ホルモン欠乏症
6.7.1 地域別市場予測、2023年〜2033年 (US$ Mn)
6.7.2 地域別市場シェア、2023年&2033年(%)
6.8 その他
6.8.1 地域別市場予測、2023年〜2033年 (US$ Mn)
6.8.2 地域別市場シェア、2023年&2033年(%)
7 バイオシミラーとフォローオンバイオロジック市場分析:技術別
7.1 主な調査結果
7.2 技術セグメント市場魅力度指数
7.3 バイオシミラーとフォローオンバイオロジクスの技術別市場規模の推定と予測
7.4 rDNA技術
7.4.1 地域別市場予測、2023年〜2033年(US$ Mn)
7.4.2 地域別市場シェア、2023年&2033年(%)
7.5 mAbs技術
7.5.1 地域別市場予測、2023年~2033年(US$ Mn)
7.5.2 地域別市場シェア、2023年&2033年(%)
7.6 バイオアッセイ技術
7.6.1.1 クロマトグラフィー
7.6.1.2 質量分析法
7.6.1.3 NMR(核磁気共鳴)
7.6.1.4 電気泳動
7.6.2 地域別市場予測、2023-2033年 (US$ Mn)
7.6.3 地域別市場シェア、2023年&2033年(%)
8 バイオシミラーとフォローオンバイオロジックの市場分析地域別
8.1 主な調査結果
8.2 地域別市場規模の推定と予測
9 北米のバイオシミラーとフォローオンバイオロジクス市場分析
9.1 主な調査結果
9.2 北米バイオシミラーとフォローオンバイオロジクスの市場魅力度指数
9.3 国別市場規模、2022年、2027年&2032年(US$ Mn)
9.4 国別市場規模予測・予測、2023年〜2033年(US$ Mn)
9.5 製造タイプ別市場規模推定・予測、2023年~2033年(US$ Mn)
9.6 タイプ別市場規模推定・予測、2023年~2033年 (US$ Mn)
9.7 用途別市場規模推定・予測、2023年~2033年(US$ Mn)
9.8 技術別市場規模推定・予測、2023年~2033年(US$ Mn)
9.9 米国
9.9.1 米国は欧州バイオシミラー市場に追いつき始めたばかりだ
9.9.2 バイオシミラー採用率の上昇が米国バイオシミラー市場の成長を促進する
9.9.3 米国におけるバイオシミラー開発・承認の進展が市場成長を促進する
9.10 カナダ
9.10.1 カナダ各地域におけるバイオシミラー認可の動き
9.10.2 カナダ保健省のイニシアチブは今後10年間でカナダのバイオシミラーとフォローオン生物製剤の市場を促進する
9.10.3 がん治療におけるバイオシミラーの利用可能性が地域の成長を促進する
9.10.4 カナダのバイオシミラーとフォローオンバイオロジクスの市場展望
10 欧州のバイオシミラーとフォローオンバイオロジクス市場分析
10.1 主要な調査結果
10.2 生活習慣病の蔓延が欧州バイオシミラー市場の成長を促進すると予想される
10.3 バイオシミラーの継続的な効果により、長期的に有利な成長が見込まれる
10.4 欧州バイオシミラーおよびフォローオンバイオロジクスの市場魅力度指数
10.5 国別市場規模、2022年、2027年&2032年 (US$ Mn)
10.6 国別市場規模予測・予測、2023年〜2033年(US$ Mn)
10.7 製造タイプ別市場規模推定・予測、2023年〜2033年(US$ Mn)
10.8 タイプ別市場規模推定・予測、2023年~2033年 (US$ Mn)
10.9 用途別市場規模推定・予測、2023年~2033年(US$ Mn)
10.10 技術別市場規模推定・予測、2023年~2033年 (US$ Mn)
10.11 ドイツ
10.11.1 ドイツではバイオシミラーが医薬品を適切に使用するための重要な要素として受け入れられている
10.11.2 ドイツでは2022年8月までに生物製剤薬局への移行が予定されており、バイオシミラーの長期的な存続が危ぶまれる
10.11.3 ドイツのバイオシミラーとフォローオンバイオロジクスの市場展望
10.12 イギリス
10.12.1 NHSが英国でのバイオシミラー製造の成長を促進する
10.12.2 価格低下にもかかわらず、バイオシミラー医薬品は小売の場で広く使用されていない
10.12.3 イギリスのバイオシミラーとフォローオンバイオロジクスの市場展望
10.13 フランス
10.14 イタリア
10.14.1 イタリア政府の政策が地域全体のバイオシミラー市場の発展を促進すると予想される
10.14.2 イタリア全域でバイオシミラーによる医薬品価格の引き下げが期待される
10.15 スペイン
10.15.1 スペインにおけるバイオシミラー製品の予算インパクト分析
10.16 その他の欧州地域
11 アジア太平洋地域のバイオシミラーとフォローオンバイオロジクス市場分析
11.1 主要な調査結果
11.2 低い臨床開発コストと規制の容易さが地域の成長を促進する
11.3 インドの製薬会社はバイオシミラー市場で大きな可能性を持っている
11.4 アジア太平洋地域のバイオシミラーとフォローオンバイオロジクスの市場魅力度指数
11.5 国別市場規模、2022年、2027年&2032年(US$ Mn)
11.6 国別市場規模予測・予測、2023年〜2033年(US$ Mn)
11.7 製造タイプ別市場規模推定・予測、2023年〜2033年(US$ Mn)
11.8 タイプ別市場規模推定・予測、2023年~2033年 (US$ Mn)
11.9 用途別市場規模推定・予測、2023年~2033年(US$ Mn)
11.10 技術別市場規模推定・予測、2023年~2033年 (US$ Mn)
11.11 日本
11.11.1 バイオシミラーは今後10年間、日本の医療システムの成長を後押しする
11.11.2 日本は米国やEUと比較して、この分野の成長がまだ遅い
11.11.3 バイオシミラーの導入は地域の成長を促進する
11.11.4 高齢化する日本の人口が予測期間中にバイオシミラーの開発を要求する
11.12 中国
11.12.1 バイオシミラー認可の大幅な増加が市場成長を牽引
11.12.2 技術的進歩が予測期間中の中国バイオシミラー市場の成長を促進する
11.12.3 主要企業の事業拡大が中国のバイオシミラー市場の成長を促進する
11.12.4 中国市場の過密化が国際的プレイヤーの撤退を招いた
11.13 インド
11.13.1 インドは2030年末までに第6位の医薬品市場になる
11.13.2 有名製薬会社がインドの製薬会社と提携を結ぶ
11.13.3 インドのバイオシミラーとフォローオンバイオロジクスの市場展望
11.14 アジア太平洋地域のその他の地域
12 ラテンアメリカのバイオシミラーとフォローオンバイオロジック市場分析
12.1 主な調査結果
12.2 ラテンアメリカのバイオシミラーとフォローオンバイオロジクスの市場魅力度指数
12.3 国別市場規模、2022年、2027年&2032年(US$ Mn)
12.4 国別市場規模予測・予測、2023年〜2033年(US$ Mn)
12.5 製造タイプ別市場規模推定・予測、2023年~2033年(US$ Mn)
12.6 タイプ別市場規模推定・予測、2023年~2033年 (US$ Mn)
12.7 用途別市場規模推定・予測、2023年~2033年(US$ Mn)
12.8 技術別市場規模推定・予測、2023年~2033年 (US$ Mn)
12.9 ブラジル
12.9.1 ブラジルのバイオシミラー規制
12.10 メキシコ
12.11 ラテンアメリカの残りの地域
13 MEAのバイオシミラーとフォローオンバイオロジック市場分析
13.1 主な調査結果
13.2 MEAバイオシミラーとフォローオンバイオロジクスの市場魅力度指数
13.3 国別市場規模、2022年、2027年&2032年(US$ Mn)
13.4 国別市場規模の推定と予測、2023年~2033年(US$ Mn)
13.5 製造タイプ別市場規模推定・予測、2023年~2033年(US$ Mn)
13.6 タイプ別市場規模推定・予測、2023年~2033年 (US$ Mn)
13.7 用途別市場規模推定・予測、2023年~2033年(US$ Mn)
13.8 技術別の市場規模推定・予測、2023年~2033年 (US$ Mn)
13.9 GCC
13.9.1 バイオシミラーで大きく飛躍しようとするGCC
13.9.2 GCCの製薬会社間のコラボレーションは、予測期間中、市場プレイヤーに有利な成長見通しを提供する
13.10 南アフリカ
13.10.1 進化する人口統計学的・疫学的プロファイルが有利な成長見通しをもたらす
13.10.2 大手製薬会社の存在が競争を激化させる
13.11 その他のMEA地域
14 主要企業のプロフィール
14.1 3SBio, Inc.
14.1.1 会社概要
14.1.2 会社概要
14.1.3 製品のベンチマーク
14.1.4 戦略的展望
14.2 AMEGA Biotech
14.2.1 会社概要
14.2.2 会社概要
14.2.3 製品ベンチマーク
14.3 Amgen Inc.
14.3.1 企業スナップショット
14.3.2 会社概要
14.3.3 財務分析
14.3.3.1 純収益、2015-2021年
14.3.3.2 研究開発費、2015年-2021年
14.3.3.3 売上総利益、2015年-2021年
14.3.4 製品ベンチマーク
14.3.5 戦略的な展望
14.4 アポテックス社
14.4.1 企業スナップショット
14.4.2 会社概要
14.4.3 ベンチマーキング
14.5 BIOCAD
14.5.1 企業スナップショット
14.5.2 会社概要
14.5.3 ベンチマーキング
14.5.4 戦略的な展望
14.6 バイオコン・リミテッド
14.6.1 企業スナップショット
14.6.2 会社概要
14.6.3 財務分析
14.6.3.1 純収益、2017年-2021年
14.6.3.2 R&D費用、2017年-2021年
14.6.3.3 バイオシミラー売上高、2017年〜2021年
14.6.3.4 事業セグメント別市場シェア、2021年
14.6.3.5 地域別マーケットシェア(2021年
14.6.4 製品ベンチマーク
14.6.5 戦略的な展望
14.7 Biogen, Inc.
14.7.1 企業スナップショット
14.7.2 会社概要
14.7.3 ベンチマーキング
14.8 Celltrion Healthcare Co.,Ltd.
14.8.1 企業スナップショット
14.8.2 会社概要
14.8.3 ベンチマーキング
14.8.4 戦略的展望
14.9 Coherus BioSciences
14.9.1 企業スナップショット
14.9.2 会社概要
14.9.3 ベンチマーキング
14.9.4 戦略的展望
14.10 Dr. Reddy’s Laboratories Ltd.
14.10.1 企業スナップショット
14.10.2 会社概要
14.10.3 製品ベンチマーク
14.11 Eli Lilly and Company
14.11.1 企業スナップショット
14.11.2 会社概要
14.11.3 財務分析
14.11.3.1 純収益、2015-2021年
14.11.3.2 R&D費用、2015-2021年
14.11.3.3 売上総利益、2015年-2021年
14.11.3.4 地域別売上高、2018-2021年
14.11.4 製品ベンチマーク
14.11.5 戦略的な展望
14.12 Gedeon Richter PLC
14.12.1 企業スナップショット
14.12.2 会社概要
14.12.3 ベンチマーキング
14.12.4 戦略的展望
14.13 Intas Pharmaceutical Ltd.
14.13.1 企業スナップショット
14.13.2 会社概要
14.13.3 ベンチマーキング
14.14 Mabxience SA
14.14.1 企業スナップショット
14.14.2 会社概要
14.14.3 ベンチマーキング
14.14.4 戦略的な展望
14.15 Viatris Inc. (Mylan NV)
14.15.1 企業スナップショット
14.15.2 会社概要
14.15.3 財務分析
14.15.3.1 純収益、2015-2021年
14.15.3.2 R&D費用、2015-2021年
14.15.3.3 売上総利益、2015年-2021年
14.15.4 製品ベンチマーク
14.15.5 戦略的展望
14.16 Novartis AG
14.16.1 企業スナップショット
14.16.2 会社概要
14.16.3 財務分析
14.16.3.1 純収益、2015-2021年
14.16.3.2 研究開発費、2015年-2021年
14.16.3.3 売上総利益、2015年-2021年
14.16.3.4 事業セグメント別売上高、2019-2021年
14.16.3.5 サンド部門の事業フランチャイズ別第三者向け売上高(2020年
14.16.4 製品ベンチマーク
14.16.5 戦略的な展望
14.17 Pfizer Inc.
14.17.1 企業スナップショット
14.17.2 会社概要
14.17.3 財務分析
14.17.3.1 純収益、2015-2021年
14.17.3.2 研究開発費、2015年-2021年
14.17.3.3 売上総利益、2015年-2021年
14.17.3.4 地域別市場シェア(2021年)
14.17.4 製品ベンチマーク
14.17.5 戦略的展望
14.18 Samsung Bioepis Co.Ltd.
14.18.1 企業スナップショット
14.18.2 会社概要
14.18.3 製品ベンチマーク
14.18.4 戦略的な展望
14.19 Stada Arzneimittel AG
14.19.1 企業スナップショット
14.19.2 会社概要
14.19.3 財務分析
14.19.3.1 純収益、2016年-2020年
14.19.3.2 売上総利益、2016年-2020年
14.19.3.3 セグメント別純売上高、2019-2020年
14.19.4 製品ベンチマーク
14.19.5 戦略的な展望
14.20 Teva Pharmaceutical
14.20.1 企業スナップショット
14.20.2 会社概要
14.20.3 財務分析
14.20.3.1 純収益、2015-2021年
14.20.3.2 研究開発費、2015年-2021年
14.20.3.3 売上総利益、2015年-2021年
14.20.4 製品ベンチマーク
15 結論と提言
15.1 ヴィジョンゲインからの結論
15.2 市場関係者への提言
表の一覧
Table 1 Biosimilars and Follow-on Biologics Market Snapshot, 2023 & 2033 (US$ million, CAGR %)
Table 2 Biosimilars and Follow-on Biologics Market Forecast by Region, 2023-2033 (US$ mn, AGR%, CAGR%): "V" Shaped Recovery
Table 3 Biosimilars and Follow-on Biologics Market Forecast by Region, 2023-2033 (US$ mn, AGR%, CAGR%): "U" Shaped Recovery
Table 4 Biosimilars and Follow-on Biologics Market Forecast by Region, 2023-2033 (US$ mn, AGR%, CAGR%): "W" Shaped Recovery
Table 5 Biosimilars and Follow-on Biologics Market Forecast by Region, 2023-2033 (US$ mn, AGR%, CAGR%): "L" Shaped Recovery
Table 6 Biosimilars and Follow-on Biologics Market Forecast by Type of Manufacturing, 2023-2033 (US$ mn, AGR%, CAGR%)
Table 7 In-House Segment Market Forecast by Region, 2023-2033 (US$ mn, AGR%, CAGR%)
Table 8 CMOs Segment Market Forecast by Region, 2023-2033 (US$ mn, AGR%, CAGR%)
Table 9 Global Biosimilars and Follow-on Biologics Market Forecast by Type, 2023-2033 (US$ mn, AGR%, CAGR%)
Table 10 Monoclonal Antibodies Segment Market Forecast by Region, 2023-2033 (US$ mn, AGR%, CAGR%)
Table 11 Fusion Proteins Segment Market Forecast by Region, 2023-2033 (US$ mn, AGR%, CAGR%)
Table 12 Insulin Segment Market Forecast by Region, 2023-2033 (US$ mn, AGR%, CAGR%)
Table 13 Erythropoietin Segment Market Forecast by Region, 2023-2033 (US$ mn, AGR%, CAGR%)
Table 14 Granulocyte-Colony Stimulating Factor Companies Segment Market Forecast by Region, 2023-2033 (US$ mn, AGR%, CAGR%)
Table 15 Interferon Segment Market Forecast by Region, 2023-2033 (US$ mn, AGR%, CAGR%)
Table 16 Growth Hormones Segment Market Forecast by Region, 2023-2033 (US$ mn, AGR%, CAGR%)
Table 17 Fertility Hormones Segment Market Forecast by Region, 2023-2033 (US$ mn, AGR%, CAGR%)
Table 18 Others Segment Market Forecast by Region, 2023-2033 (US$ mn, AGR%, CAGR%)
Table 19 Global Biosimilars and Follow-on Biologics Market Forecast by Application, 2023-2033 (US$ mn, AGR%, CAGR%)
Table 20 Blood Disorders Segment Market Forecast by Region, 2023-2033 (US$ mn, AGR%, CAGR%)
Table 21 Oncology Diseases Segment Market Forecast by Region, 2023-2033 (US$ mn, AGR%, CAGR%)
Table 22 Chronic & Autoimmune Diseases Segment Market Forecast by Region, 2023-2033 (US$ mn, AGR%, CAGR%)
Table 23 Growth Hormone Deficiencies Segment Market Forecast by Region, 2023-2033 (US$ mn, AGR%, CAGR%)
Table 24 Others Segment Market Forecast by Region, 2023-2033 (US$ mn, AGR%, CAGR%)
Table 25 Biosimilars and Follow-on Biologics Market Forecast by Technology, 2023-2033 (US$ mn, AGR%, CAGR%)
Table 26 rDNA Technology Segment Market Forecast by Region, 2023-2033 (US$ mn, AGR%, CAGR%)
Table 27 Mab Technology Segment Market Forecast by Region, 2023-2033 (US$ mn, AGR%, CAGR%)
Table 28 Bioassay Technology Segment Market Forecast by Region, 2023-2033 (US$ mn, AGR%, CAGR%)
Table 29 Biosimilars and Follow-on Biologics Market Forecast by Region, 2023-2033 (US$ mn, AGR%, CAGR%)
Table 30 North America Biosimilars and Follow-on Biologics Market Forecast by Country, 2023-2033 (US$ mn, AGR%, CAGR%)
Table 31 North America Biosimilars and Follow-on Biologics Market Forecast by Type of Manufacturing, 2023-2033 (US$ mn, AGR%, CAGR%)
Table 32 North America Biosimilars and Follow-on Biologics Market Forecast by Type, 2023-2033 (US$ mn, AGR%, CAGR%)
Table 33 North America Biosimilars and Follow-on Biologics Market Forecast by Application, 2023-2033 (US$ mn, AGR%, CAGR%)
Table 34 North America Biosimilars and Follow-on Biologics Market Forecast by Technology, 2023-2033 (US$ mn, AGR%, CAGR%)
Table 35 FDA Approved Biosimilars as of September 2022
Table 36 U.S. Biosimilars and Follow-on Biologics Market Forecast, 2023-2033 (US$ mn, AGR%, CAGR%)
Table 37 Canada Biosimilars and Follow-on Biologics Market Forecast, 2023-2033 (US$ mn, AGR%, CAGR%)
Table 38 Europe Biosimilars and Follow-on Biologics Market Forecast by Country, 2023-2033 (US$ mn, AGR%, CAGR%)
Table 39 Europe Biosimilars and Follow-on Biologics Market Forecast by Type of Manufacturing, 2023-2033 (US$ mn, AGR%, CAGR%)
Table 40 Europe Biosimilars and Follow-on Biologics Market Forecast by Type, 2023-2033 (US$ mn, AGR%, CAGR%)
Table 41 Europe Biosimilars and Follow-on Biologics Market Forecast by Application, 2023-2033 (US$ mn, AGR%, CAGR%)
Table 42 Europe Biosimilars and Follow-on Biologics Market Forecast by Technology, 2023-2033 (US$ mn, AGR%, CAGR%)
Table 43 Germany Biosimilars and Follow-on Biologics Market Forecast, 2023-2033 (US$ mn, AGR%, CAGR%)
Table 44 UK Biosimilars and Follow-on Biologics Market Forecast, 2023-2033 (US$ mn, AGR%, CAGR%)
Table 45 France Biosimilars and Follow-on Biologics Market Forecast, 2023-2033 (US$ mn, AGR%, CAGR%)
Table 46 Italy Biosimilars and Follow-on Biologics Market Forecast, 2023-2033 (US$ mn, AGR%, CAGR%)
Table 47 Spain Biosimilars and Follow-on Biologics Market Forecast, 2023-2033 (US$ mn, AGR%, CAGR%)
Table 48 Rest of Europe Biosimilars and Follow-on Biologics Market Forecast, 2023-2033 (US$ mn, AGR%, CAGR%)
Table 49 Asia Pacific Biosimilars and Follow-on Biologics Market Forecast by Country, 2023-2033 (US$ mn, AGR%, CAGR%)
Table 50 Asia Pacific Biosimilars and Follow-on Biologics Market Forecast by Type of Manufacturing, 2023-2033 (US$ mn, AGR%, CAGR%)
Table 51 Asia Pacific Biosimilars and Follow-on Biologics Market Forecast by Type, 2023-2033 (US$ mn, AGR%, CAGR%)
Table 52 Asia Pacific Biosimilars and Follow-on Biologics Market Forecast by Application, 2023-2033 (US$ mn, AGR%, CAGR%)
Table 53 Asia Pacific Biosimilars and Follow-on Biologics Market Forecast by Technology, 2023-2033 (US$ mn, AGR%, CAGR%)
Table 54 Japan Biosimilars and Follow-on Biologics Market Forecast, 2023-2033 (US$ mn, AGR%, CAGR%)
Table 55 China Biosimilars and Follow-on Biologics Market Forecast, 2023-2033 (US$ mn, AGR%, CAGR%)
Table 56 India Biosimilars and Follow-on Biologics Market Forecast, 2023-2033 (US$ mn, AGR%, CAGR%)
Table 57 Rest of Asia Pacific Biosimilars and Follow-on Biologics Market Forecast, 2023-2033 (US$ mn, AGR%, CAGR%)
Table 58 Latin America Biosimilars and Follow-on Biologics Market Forecast by Country, 2023-2033 (US$ mn, AGR%, CAGR%)
Table 59 Latin America Biosimilars and Follow-on Biologics Market Forecast by Type of Manufacturing, 2023-2033 (US$ mn, AGR%, CAGR%)
Table 60 Latin America Biosimilars and Follow-on Biologics Market Forecast by Type, 2023-2033 (US$ mn, AGR%, CAGR%)
Table 61 Latin America Biosimilars and Follow-on Biologics Market Forecast by Application, 2023-2033 (US$ mn, AGR%, CAGR%)
Table 62 Latin America Biosimilars and Follow-on Biologics Market Forecast by Technology, 2023-2033 (US$ mn, AGR%, CAGR%)
Table 63 Brazil Biosimilars and Follow-on Biologics Market Forecast, 2023-2033 (US$ mn, AGR%, CAGR%)
Table 64 Mexico Biosimilars and Follow-on Biologics Market Forecast, 2023-2033 (US$ mn, AGR%, CAGR%)
Table 65 Rest of Latin America Biosimilars and Follow-on Biologics Market Forecast, 2023-2033 (US$ mn, AGR%, CAGR%)
Table 66 MEA Biosimilars and Follow-on Biologics Market Forecast by Country, 2023-2033 (US$ mn, AGR%, CAGR%)
Table 67 MEA Biosimilars and Follow-on Biologics Market Forecast by Type of Manufacturing, 2023-2033 (US$ mn, AGR%, CAGR%)
Table 68 MEA Biosimilars and Follow-on Biologics Market Forecast by Type, 2023-2033 (US$ mn, AGR%, CAGR%)
Table 69 MEA Biosimilars and Follow-on Biologics Market Forecast by Application, 2023-2033 (US$ mn, AGR%, CAGR%)
Table 70 MEA Biosimilars and Follow-on Biologics Market Forecast by Technology, 2023-2033 (US$ mn, AGR%, CAGR%)
Table 71 GCC Biosimilars and Follow-on Biologics Market Forecast, 2023-2033 (US$ mn, AGR%, CAGR%)
Table 72 South Africa Biosimilars and Follow-on Biologics Market Forecast, 2023-2033 (US$ mn, AGR%, CAGR%)
Table 73 Rest of MEA Biosimilars and Follow-on Biologics Market Forecast, 2023-2033 (US$ mn, AGR%, CAGR%)
Table 74 3SBio, Inc.: Key Details, (CEO, HQ, Revenue, Founded, No. of Employees, Company Type, Website, Business Segment)
Table 75 3SBio, Inc.: Product Benchmarking
Table 76 3SBio, Inc.: Strategic Outlook
Table 77 AMEGA Biotech: Key Details, (CEO, HQ, Revenue, Founded, No. of Employees, Company Type, Website, Business Segment)
Table 78 AMEGA Biotech: Product Benchmarking
Table 79 Amgen Inc.: Key Details, (CEO, HQ, Revenue, Founded, No. of Employees, Company Type, Website, Business Segment)
Table 80 Amgen Inc.: Product Benchmarking
Table 81 Amgen Inc.: Strategic Outlook
Table 82 Apotex, Inc.: Key Details, (CEO, HQ, Revenue, Founded, No. of Employees, Company Type, Website, Business Segment)
Table 83 Apotex, Inc.: Product Benchmarking
Table 84 BIOCAD: Key Details, (CEO, HQ, Revenue, Founded, No. of Employees, Company Type, Website, Business Segment)
Table 85 BIOCAD: Product Benchmarking
Table 86 BIOCAD: Strategic Outlook
Table 87 Biocon Limited: Key Details, (CEO, HQ, Revenue, Founded, No. of Employees, Company Type, Website, Business Segment)
Table 88 Biocon Limited: Product Benchmarking
Table 89 Biocon Limited: Strategic Outlook
Table 90 Biogen, Inc.: Key Details, (CEO, HQ, Revenue, Founded, No. of Employees, Company Type, Website, Business Segment)
Table 91 Biogen, Inc.: Product Benchmarking
Table 92 Celltrion Healthcare Co.,Ltd.: Key Details, (CEO, HQ, Revenue, Founded, No. of Employees, Company Type, Website, Business Segment)
Table 93 Celltrion Healthcare Co.,Ltd.: Product Benchmarking
Table 94 Celltrion Healthcare Co.,Ltd.: Strategic Outlook
Table 95 Coherus BioSciences: Key Details, (CEO, HQ, Revenue, Founded, No. of Employees, Company Type, Website, Business Segment)
Table 96 Coherus BioSciences: Product Benchmarking
Table 97 Coherus BioSciences: Strategic Outlook
Table 98 Dr. Reddy’s Laboratories Ltd.: Key Details, (CEO, HQ, Revenue, Founded, No. of Employees, Company Type, Website, Business Segment)
Table 99 Dr. Reddy’s Laboratories Ltd.: Product Benchmarking
Table 100 Eli Lilly and Company: Key Details, (CEO, HQ, Revenue, Founded, No. of Employees, Company Type, Website, Business Segment)
Table 101 Eli Lilly and Company: Product Benchmarking
Table 102 Eli Lilly and Company: Strategic Outlook
Table 103 Gedeon Richter PLC: Key Details, (CEO, HQ, Revenue, Founded, No. of Employees, Company Type, Website, Business Segment)
Table 104 Gedeon Richter PLC: Product Benchmarking
Table 105 Gedeon Richter PLC: Strategic Outlook
Table 106 Intas Pharmaceutical Ltd.: Key Details, (CEO, HQ, Revenue, Founded, No. of Employees, Company Type, Website, Business Segment)
Table 107 Intas Pharmaceutical Ltd.: Product Benchmarking
Table 108 Mabxience SA: Key Details, (CEO, HQ, Revenue, Founded, No. of Employees, Company Type, Website, Business Segment)
Table 109 Mabxience SA: Product Benchmarking
Table 110 Mabxience SA: Strategic Outlook
Table 111 Viatris Inc. (Mylan NV): Key Details, (CEO, HQ, Revenue, Founded, No. of Employees, Company Type, Website, Business Segment)
Table 112 Viatris Inc. (Mylan NV): Product Benchmarking
Table 113 Viatris Inc. (Mylan NV): Strategic Outlook
Table 114 Novartis AG: Key Details, (CEO, HQ, Revenue, Founded, No. of Employees, Company Type, Website, Business Segment)
Table 115 Novartis AG: Product Benchmarking
Table 116 Novartis AG: Strategic Outlook
Table 117 Pfizer Inc.: Key Details, (CEO, HQ, Revenue, Founded, No. of Employees, Company Type, Website, Business Segment)
Table 118 Pfizer Inc.: Product Benchmarking
Table 119 Pfizer Inc.: Strategic Outlook
Table 120 Samsung Bioepis Co. Ltd.: Key Details, (CEO, HQ, Revenue, Founded, No. of Employees, Company Type, Website, Business Segment)
Table 121 Samsung Bioepis Co. Ltd.: Product Benchmarking
Table 122 Samsung Bioepis Co. Ltd.: Strategic Outlook
Table 123 Stada Arzneimittel AG: Key Details, (CEO, HQ, Revenue, Founded, No. of Employees, Company Type, Website, Business Segment)
Table 124 Stada Arzneimittel AG: Product Benchmarking
Table 125 Stada Arzneimittel AG: Strategic Outlook
Table 126 Teva Pharmaceutical: Key Details, (CEO, HQ, Revenue, Founded, No. of Employees, Company Type, Website, Business Segment)
Table 127 Teva Pharmaceutical: Strategic Outlook
図の一覧
Figure 1 Biosimilars and Follow-on Biologics Market Segmentation
Figure 2 Biosimilars and Follow-on Biologics Market by Type of Manufacturing: Market Attractiveness Index
Figure 3 Biosimilars and Follow-on Biologics Market by Application: Market Attractiveness Index
Figure 4 Biosimilars and Follow-on Biologics Market by Technology: Market Attractiveness Index
Figure 5 Biosimilars and Follow-on Biologics Market Attractiveness Index by Region
Figure 6 Biosimilars and Follow-on Biologics Market: Market Dynamics
Figure 7 Biologics Patent Expiry, 2020-2030
Figure 8 Biosimilars and Follow-on Biologics Market by Region, 2023-2033 (US$ Mn, AGR %): “V” Shaped Recovery
Figure 9 Biosimilars and Follow-on Biologics Market by Region, 2023-2033 (US$ Mn, AGR %): “U” Shaped Recovery
Figure 10 Biosimilars and Follow-on Biologics Market by Region, 2023-2033 (US$ Mn, AGR %): “W” Shaped Recovery
Figure 11 Biosimilars and Follow-on Biologics Market by Region, 2023-2033 (US$ Mn, AGR %): “L” Shaped Recovery
Figure 12 Biosimilars and Follow-on Biologics Market: Porter’s Five Forces Analysis
Figure 13 Biosimilars and Follow-on Biologics Market: PEST Analysis
Figure 14 Biosimilars and Follow-on Biologics Market Attractiveness Index by Type of Manufacturing
Figure 15 Biosimilars and Follow-on Biologics Market Forecast by Type of Manufacturing, 2023-2033 (US$ million)
Figure 16 Biosimilars and Follow-on Biologics Market Share Forecast by Type of Manufacturing, 2023, 2028, 2033 (%)
Figure 17 In-House Market Forecast by Region, 2023-2033 (US$ million)
Figure 18 In-House Market Share Forecast by Region, 2023 & 2033 (%)
Figure 19 CMOs Market Forecast by Region, 2023-2033 (US$ million)
Figure 20 CMOs Market Share Forecast by Region, 2023 & 2033 (%)
Figure 21 Biosimilars and Follow-on Biologics Market Forecast by Type, 2023-2033 (US$ million)
Figure 22 Biosimilars and Follow-on Biologics Market Share Forecast by Type, 2023, 2028, 2033 (%)
Figure 23 Monoclonal Antibodies Market Forecast by Region, 2023-2033 (US$ million)
Figure 24 Monoclonal Antibodies Market Share Forecast by Region, 2023 & 2033 (%)
Figure 25 Fusion Proteins Market Forecast by Region, 2023-2033 (US$ million)
Figure 26 Fusion Proteins Market Share Forecast by Region, 2023 & 2033 (%)
Figure 27 Insulin Market Forecast by Region, 2023-2033 (US$ million)
Figure 28 Insulin Market Share Forecast by Region, 2023 & 2033 (%)
Figure 29 Erythropoietin Market Forecast by Region, 2023-2033 (US$ million)
Figure 30 Erythropoietin Market Share Forecast by Region, 2023 & 2033 (%)
Figure 31 Granulocyte-Colony Stimulating Factor Market Forecast by Region, 2023-2033 (US$ million)
Figure 32 Granulocyte-Colony Stimulating Factor Market Share Forecast by Region, 2023 & 2033 (%)
Figure 33 Interferon Market Forecast by Region, 2023-2033 (US$ million)
Figure 34 Interferon Market Share Forecast by Region, 2023 & 2033 (%)
Figure 35 Growth Hormones Market Forecast by Region, 2023-2033 (US$ million)
Figure 36 Growth Hormones Market Share Forecast by Region, 2023 & 2033 (%)
Figure 37 Fertility Hormones Market Forecast by Region, 2023-2033 (US$ million)
Figure 38 Fertility Hormones Market Share Forecast by Region, 2023 & 2033 (%)
Figure 39 Others Market Forecast by Region, 2023-2033 (US$ million)
Figure 40 Others Market Share Forecast by Region, 2023 & 2033 (%)
Figure 41 Biosimilars and Follow-on Biologics Market Attractiveness Index by Application
Figure 42 Biosimilars and Follow-on Biologics Market Forecast by Application, 2023-2033 (US$ million)
Figure 43 Biosimilars and Follow-on Biologics Market Share Forecast by Application, 2023, 2028, 2033 (%)
Figure 44 Blood Disorders Market Forecast by Region, 2023-2033 (US$ million)
Figure 45 Blood Disorders Market Share Forecast by Region, 2023 & 2033 (%)
Figure 46 Oncology Diseases Market Forecast by Region, 2023-2033 (US$ million)
Figure 47 Oncology Diseases Market Share Forecast by Region, 2023 & 2033 (%)
Figure 48 Chronic & Autoimmune Diseases Market Forecast by Region, 2023-2033 (US$ million)
Figure 49 Chronic & Autoimmune Diseases Market Share Forecast by Region, 2023 & 2033 (%)
Figure 50 Growth Hormone Deficiencies Market Forecast by Region, 2023-2033 (US$ million)
Figure 51 Growth Hormone Deficiencies Market Share Forecast by Region, 2023 & 2033 (%)
Figure 52 Others Market Forecast by Region, 2023-2033 (US$ million)
Figure 53 Others Market Share Forecast by Region, 2023 & 2033 (%)
Figure 54 Biosimilars and Follow-on Biologics Market Attractiveness Index by Technology
Figure 55 Biosimilars and Follow-on Biologics Market Forecast by Technology, 2023-2033 (US$ million)
Figure 56 Biosimilars and Follow-on Biologics Market Share Forecast by Technology, 2023, 2028, 2033 (%)
Figure 57 rDNA Technology Market Forecast by Region, 2023-2033 (US$ million)
Figure 58 rDNA Technology Market Share Forecast by Region, 2023 & 2033 (%)
Figure 59 mAbs Technology Market Forecast by Region, 2023-2033 (US$ million)
Figure 60 mAbs Technology Market Share Forecast by Region, 2023 & 2033 (%)
Figure 61 Bioassay Technology Market Forecast by Region, 2023-2033 (US$ million)
Figure 62 Bioassay Technology Market Share Forecast by Region, 2023 & 2033 (%)
Figure 63 Biosimilars and Follow-on Biologics Market Forecast by Region 2022, 2027, 2032 (Revenue, CAGR%)
Figure 64 Biosimilars and Follow-on Biologics Market Share Forecast by Region 2022, 2027, 2032(%)
Figure 65 Biosimilars and Follow-on Biologics Market by Region, 2023-2033 (US$ Mn)
Figure 66 North America Biosimilars and Follow-on Biologics Market Attractiveness Index
Figure 67 North America Biosimilars and Follow-on Biologics Market by Region, 2022, 2027 & 2032 (US$ million)
Figure 68 North America Biosimilars and Follow-on Biologics Market Forecast by Country, 2023-2033 (US$ million)
Figure 69 North America Biosimilars and Follow-on Biologics Market Share Forecast by Country, 2023 & 2033 (%)
Figure 70 North America Biosimilars and Follow-on Biologics Market Forecast by Type of Manufacturing, 2023-2033 (US$ million)
Figure 71 North America Biosimilars and Follow-on Biologics Market Forecast by Type, 2023-2033 (US$ million)
Figure 72 North America Biosimilars and Follow-on Biologics Market Forecast by Application, 2023-2033 (US$ million)
Figure 73 North America Biosimilars and Follow-on Biologics Market Forecast by Technology, 2023-2033 (US$ million)
Figure 74 U.S. Biosimilars and Follow-on Biologics Market Forecast, 2023-2033 (US$ million)
Figure 75 Canada Biosimilars and Follow-on Biologics Market Forecast, 2023-2033 (US$ million)
Figure 76 Europe Biosimilars and Follow-on Biologics Market Attractiveness Index
Figure 77 Europe Biosimilars and Follow-on Biologics Market by Region, 2022, 2027 & 2032 (US$ million)
Figure 78 Europe Biosimilars and Follow-on Biologics Market Forecast by Country, 2023-2033 (US$ million)
Figure 79 Europe Biosimilars and Follow-on Biologics Market Share Forecast by Country, 2023 & 2033 (%)
Figure 80 Europe Biosimilars and Follow-on Biologics Market Forecast by Type of Manufacturing, 2023-2033 (US$ million)
Figure 81 Europe Biosimilars and Follow-on Biologics Market Forecast by Type, 2023-2033 (US$ million)
Figure 82 Europe Biosimilars and Follow-on Biologics Market Forecast by Application, 2023-2033 (US$ million)
Figure 83 Europe Biosimilars and Follow-on Biologics Market Forecast by Technology, 2023-2033 (US$ million)
Figure 84 Germany Biosimilars and Follow-on Biologics Market Forecast, 2023-2033 (US$ million)
Figure 85 UK Biosimilars and Follow-on Biologics Market Forecast, 2023-2033 (US$ million)
Figure 86 France Biosimilars and Follow-on Biologics Market Forecast, 2023-2033 (US$ million)
Figure 87 Italy Biosimilars and Follow-on Biologics Market Forecast, 2023-2033 (US$ million)
Figure 88 Spain Biosimilars and Follow-on Biologics Market Forecast, 2023-2033 (US$ million)
Figure 89 Rest of Europe Biosimilars and Follow-on Biologics Market Forecast, 2023-2033 (US$ million)
Figure 90 Asia Pacific Biosimilars and Follow-on Biologics Market Attractiveness Index
Figure 91 Asia Pacific Biosimilars and Follow-on Biologics Market by Region, 2022, 2027 & 2032 (US$ million)
Figure 92 Asia Pacific Biosimilars and Follow-on Biologics Market Forecast by Country, 2023-2033 (US$ million)
Figure 93 Asia Pacific Biosimilars and Follow-on Biologics Market Share Forecast by Country, 2023 & 2033 (%)
Figure 94 Asia Pacific Biosimilars and Follow-on Biologics Market Forecast by Type of Manufacturing, 2023-2033 (US$ million)
Figure 95 Asia Pacific Biosimilars and Follow-on Biologics Market Forecast by Type, 2023-2033 (US$ million)
Figure 96 Asia Pacific Biosimilars and Follow-on Biologics Market Forecast by Application, 2023-2033 (US$ million)
Figure 97 Asia Pacific Biosimilars and Follow-on Biologics Market Forecast by Technology, 2023-2033 (US$ million)
Figure 98 Japan Biosimilars and Follow-on Biologics Market Forecast, 2023-2033 (US$ million)
Figure 99 Biosimilar Approvals in China vs. Japan & South Korea, 2015-2020
Figure 100 China Biosimilars and Follow-on Biologics Market Forecast, 2023-2033 (US$ million)
Figure 101 India Biosimilars and Follow-on Biologics Market Forecast, 2023-2033 (US$ million)
Figure 102 Rest of Asia Pacific Biosimilars and Follow-on Biologics Market Forecast, 2023-2033 (US$ million)
Figure 103 Latin America Biosimilars and Follow-on Biologics Market Attractiveness Index
Figure 104 Latin America Biosimilars and Follow-on Biologics Market by Region, 2022, 2027 & 2032 (US$ million)
Figure 105 Latin America Biosimilars and Follow-on Biologics Market Forecast by Country, 2023-2033 (US$ million)
Figure 106 Latin America Biosimilars and Follow-on Biologics Market Share Forecast by Country, 2023 & 2033 (%)
Figure 107 Latin America Biosimilars and Follow-on Biologics Market Forecast by Type of Manufacturing, 2023-2033 (US$ million)
Figure 108 Latin America Biosimilars and Follow-on Biologics Market Forecast by Type, 2023-2033 (US$ million)
Figure 109 Latin America Biosimilars and Follow-on Biologics Market Forecast by Application, 2023-2033 (US$ million)
Figure 110 Latin America Biosimilars and Follow-on Biologics Market Forecast by Technology, 2023-2033 (US$ million)
Figure 111 Brazil Biosimilars and Follow-on Biologics Market Forecast, 2023-2033 (US$ million)
Figure 112 Mexico Biosimilars and Follow-on Biologics Market Forecast, 2023-2033 (US$ million)
Figure 113 Rest of Latin America Biosimilars and Follow-on Biologics Market Forecast, 2023-2033 (US$ million)
Figure 114 MEA Biosimilars and Follow-on Biologics Market Attractiveness Index
Figure 115 MEA Biosimilars and Follow-on Biologics Market by Region, 2022, 2027 & 2032 (US$ million)
Figure 116 MEA Biosimilars and Follow-on Biologics Market Forecast by Country, 2023-2033 (US$ million)
Figure 117 MEA Biosimilars and Follow-on Biologics Market Share Forecast by Country, 2023 & 2033 (%)
Figure 118 MEA Biosimilars and Follow-on Biologics Market Forecast by Type of Manufacturing, 2023-2033 (US$ million)
Figure 119 MEA Biosimilars and Follow-on Biologics Market Forecast by Type, 2023-2033 (US$ million)
Figure 120 MEA Biosimilars and Follow-on Biologics Market Forecast by Application, 2023-2033 (US$ million)
Figure 121 MEA Biosimilars and Follow-on Biologics Market Forecast by Technology, 2023-2033 (US$ million)
Figure 122 GCC Biosimilars and Follow-on Biologics Market Forecast, 2023-2033 (US$ million)
Figure 123 South Africa Biosimilars and Follow-on Biologics Market Forecast, 2023-2033 (US$ million)
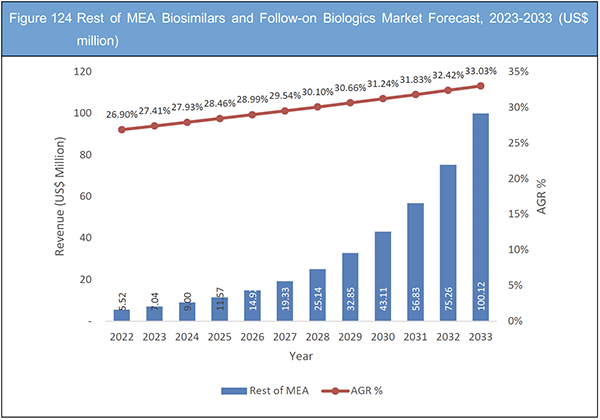
Figure 124 Rest of MEA Biosimilars and Follow-on Biologics Market Forecast, 2023-2033 (US$ million)
Figure 125 Amgen Inc.: Net Revenue, 2015-2021 (US$ million, AGR%)
Figure 126 Amgen Inc.: R&D Expenses, 2015-2021 (US$ million, AGR%)
Figure 127 Amgen Inc.: Gross Profit, 2015-2021 (US$ million, AGR%)
Figure 128 Biocon Limited: Net Revenue, 2017-2021 (US$ million, AGR%)
Figure 129 Biocon Limited: R&D Expenses, 2017-2021 (US$ million, AGR%)
Figure 130 Biocon Limited: Biosimilars Sales, 2017-2021 (US$ million, AGR%)
Figure 131 Biocon Limited: Business Segment Market Share, 2021 (%)
Figure 132 Biocon Limited: Geographic Market Share, 2021 (%)
Figure 133 Eli Lilly and Company: Net Revenue, 2015-2021 (US$ million, AGR%)
Figure 134 Eli Lilly and Company: R&D Expenses, 2015-2021 (US$ million, AGR%)
Figure 135 Eli Lilly and Company: Gross Profit, 2015-2021 (US$ million, AGR%)
Figure 136 Eli Lilly and Company: Geographic Revenue, 2018-2021 (US$ million)
Figure 137 Viatris Inc. (Mylan NV): Net Revenue, 2015-2021 (US$ million, AGR%)
Figure 138 Viatris Inc. (Mylan NV): R&D Expenses, 2015-2021 (US$ million, AGR%)
Figure 139 Viatris Inc. (Mylan NV): Gross Profit, 2015-2021 (US$ million, AGR%)
Figure 140 Novartis AG: Net Revenue, 2015-2021 (US$ million, AGR%)
Figure 141 Novartis AG: R&D Expenses, 2015-2021 (US$ million, AGR%)
Figure 142 Novartis AG: Gross Profit, 2015-2021 (US$ million, AGR%)
Figure 143 Novartis AG: Net Sales by Business Segment, 2019-2021 (US$ million)
Figure 144 Novartis AG: Net sales to third parties by business franchise in the Sandoz Division, 2020 (%)
Figure 145 Pfizer Inc.: Net Revenue, 2015-2021 (US$ million, AGR%)
Figure 146 Pfizer Inc.: R&D Expenses, 2015-2021 (US$ million, AGR%)
Figure 147 Pfizer Inc.: Gross Profit, 2015-2021 (US$ million, AGR%)
Figure 148 Pfizer Inc.: Geographic Revenue Share, 2021 (%)
Figure 149 Stada Arzneimittel AG: Net Revenue, 2016-2020 (US$ million, AGR%)
Figure 150 Stada Arzneimittel AG: Gross Profit, 2016-2020 (US$ million, AGR%)
Figure 151 Stada Arzneimittel AG: Net Income, 2021 (%)
Figure 152 Teva Pharmaceutical: Net Revenue, 2015-2021 (US$ million, AGR%)
Figure 153 Teva Pharmaceutical: R&D Expenses, 2015-2021 (US$ million, AGR%)
Figure 154 Teva Pharmaceutical: Gross Profit, 2015-2021 (US$ million, AGR%)
ページTOPに戻る
Summary
Report Details
The Biosimilars and Follow-On Biologics Market Report 2023-2033: This report will prove invaluable to leading firms striving for new revenue pockets if they wish to better understand the industry and its underlying dynamics. It will be useful for companies that would like to expand into different industries or to expand their existing operations in a new region.
Regulatory Hurdles Slowing Down Access to Biosimilars
Even in mature areas where regulations for standard generics have been in place for some time, there are still certain challenges, particularly with regard to sophisticated generics. Product categories like respiratory and some long-acting injectables, for instance, still require a large amount of evidence production, which drives up costs and restricts the availability of generics in these markets. This is frequently accompanied by intellectual property (IP) disputes and legal actions, wherein originators are granted prolonged protection periods beyond the initial time intended for the submitted innovation, delaying Generics access.
In a similar vein, clinical trial expenses continue to be exorbitant despite the fact that the regulatory pathways for biosimilars have been well delineated. Even if it is predicted that improvements in regulatory science and characterisation abilities would lessen the necessity for such restrictions, this places researchers and producers at a high degree of risk.
Some emerging nations are still having trouble establishing the proper regulatory environment to facilitate quicker product development. While these variables have an impact on the development of generics and biosimilars, they have a stronger influence when players attempt to build a more inventive pipeline. It will be important to further simplify regulatory requirements to speed up market access while ensuring adequate quality and efficacy.
Emerging Economies Continues to Pose Challenges for Building Presence for Generics and Biosimilars Companies
While emerging nations provide a substantial development potential and an essential playing field for greater access to medicines, they also present major structural and competitive market challenges for generics and biosimilars enterprises. While fierce local competition makes it challenging for players to establish a presence in these markets, additional factors like unstable economic conditions, price controls, the push for local manufacturing in some markets, and shifting regulatory requirements across geographies are all affecting players’ ability to successfully focus on these markets. It may also be less enticing for international firms to join in and assist the development of these markets due to currency repercussions in certain of the countries. Past partnerships and acquisitions have had varying degrees of success, which has limited overall growth performance for players in these fields.
In these conditions, local players who are familiar with the dynamics of their own marketplaces may have an even greater potential to grow developing economies. International players will need to concentrate on careful selection of target nations (e.g., markets with legislative requirements that are comparable to other markets, such as the US and EU) and implement a tailored portfolio approach to avoid costly expansion initiatives with little immediate return.
What Questions Should You Ask before Buying a Market Research Report?
• How is the biosimilars and follow-on biologics market evolving?
• What is driving and restraining the biosimilars and follow-on biologics market?
• How will each biosimilars and follow-on biologics submarket segment grow over the forecast period and how much revenue will these submarkets account for in 2033?
• How will the market shares for each biosimilars and follow-on biologics submarket develop from 2023 to 2033?
• What will be the main driver for the overall market from 2023 to 2033?
• Will leading biosimilars and follow-on biologics markets broadly follow the macroeconomic dynamics, or will individual national markets outperform others?
• How will the market shares of the national markets change by 2033 and which geographical region will lead the market in 2033?
• Who are the leading players and what are their prospects over the forecast period?
• What are the biosimilars and follow-on biologics projects for these leading companies?
• How will the industry evolve during the period between 2023 and 2033? What are the implications of
biosimilars and follow-on biologics projects taking place now and over the next 10 years?
• Is there a greater need for product commercialisation to further scale the biosimilars and follow-on biologics market?
• Where is the biosimilars and follow-on biologics market heading and how can you ensure you are at the forefront of the market?
• What are the best investment options for new product and service lines?
• What are the key prospects for moving companies into a new growth path and C-suite?
You need to discover how this will impact the biosimilars and follow-on biologics market today, and over the next 10 years:
• Our 337-page report provides 127 tables and 154 charts/graphs exclusively to you.
• The report highlights key lucrative areas in the industry so you can target them – NOW.
• It contains in-depth analysis of global, regional and national sales and growth.
• It highlights for you the key successful trends, changes and revenue projections made by your competitors.
This report tells you TODAY how the biosimilars and follow-on biologics market will develop in the next 10 years, and in line with the variations in COVID-19 economic recession and bounce. This market is more critical now than at any point over the last 10 years.
Forecasts to 2033 and other analyses reveal commercial prospects
• In addition to revenue forecasting to 2033, our new study provides you with recent results, growth rates, and market shares.
• You will find original analyses, with business outlooks and developments.
• Discover qualitative analyses (including market dynamics, drivers, opportunities, and restraints), Porter’s Five Forces Analysis, PEST Analysis and recent developments.
This report includes data analysis and invaluable insight into how COVID-19 will affect the industry and your company. Four COVID-19 recovery patterns and their impact, namely, “V”, “L”, “W” and “U” are discussed in this report.
Segments Covered in the Report
Type of Manufacturing
• In-House
• CMOs
Type
• Monoclonal Antibodies
• Fusion Proteins
• Insulin
• Erythropoietin
• Granulocyte-Colony Stimulating Factor
• Interferon
• Growth Hormones
• Fertility Hormones
• Others
Application
• Blood Disorders
• Oncology Diseases
• Chronic & Autoimmune Diseases
• Growth Hormone Deficiencies
• Others
Technology
• RDNA Technology
• MAbs Technology
• Bioassay Technology
In addition to the revenue predictions for the overall world market and segments, you will also find revenue forecasts for five regional and 18 leading national markets:
North America
• U.S.
• Canada
Europe
• Germany
• UK
• France
• Italy
• Spain
• Rest of Europe
Asia Pacific
• Japan
• China
• India
• Rest of Asia Pacific
Latin America
• Brazil
• Mexico
• Rest of Latin America
MEA
• GCC
• South Africa
• Rest of MEA
The report also includes profiles and for some of the leading companies in the Biosimilars and Follow-on Biologics Market, 2023 to 2033, with a focus on this segment of these companies’ operations.
Leading companies and the potential for market growth
• 3SBio, Inc.
• AMEGA Biotech
• Amgen Inc.
• Apotex, Inc.
• BIOCAD
• Biocon Limited
• Biogen, Inc.
• Celltrion Healthcare Co., Ltd.
• Coherus BioSciences
• Dr. Reddy’s Laboratories Ltd.
• Eli Lilly and Company
• Gedeon Richter PLC
• Intas Pharmaceutical Ltd.
• Mabxience SA
• Viatris Inc. (Mylan NV)
• Novartis AG
• Pfizer Inc.
• Samsung Bioepis Co. Ltd.
• Stada Arzneimittel AG
• Teva Pharmaceutical
Overall world revenue for Biosimilars and Follow-on Biologics Market, 2023 to 2033 in terms of value the market will surpass US$19,668 million in 2022, our work calculates. We predict strong revenue growth through to 2033. Our work identifies which organizations hold the greatest potential. Discover their capabilities, progress, and commercial prospects, helping you stay ahead.
How will the Biosimilars and Follow-on Biologics Market, 2023 to 2033 report help you?
In summary, our 330+ page report provides you with the following knowledge:
• Revenue forecasts to 2033 for Biosimilars and Follow-on Biologics Market, 2023 to 2033 Market, with forecasts for Type of Manufacturing, Type, Application, Technology each forecast at a global and regional level – discover the industry’s prospects, finding the most lucrative places for investments and revenues.
• Revenue forecasts to 2033 for five regional and 18 key national markets – See forecasts for the Biosimilars and Follow-on Biologics Market, 2023 to 2033 market in North America, Europe, Asia-Pacific, Latin America, and MEA. Also forecasted is the market in the US, Canada, Mexico, Brazil, Germany, France, UK, Italy, China, India, Japan, and Australia among other prominent economies.
• Prospects for established firms and those seeking to enter the market – including company profiles for 20 of the major companies involved in the Biosimilars and Follow-on Biologics Market, 2023 to 2033.
Find quantitative and qualitative analyses with independent predictions. Receive information that only our report contains, staying informed with invaluable business intelligence.
Information found nowhere else
With our new report, you are less likely to fall behind in knowledge or miss out on opportunities. See how our work could benefit your research, analyses, and decisions. Visiongain’s study is for everybody needing commercial analyses for the Biosimilars and Follow-on Biologics Market, 2023 to 2033, market-leading companies. You will find data, trends and predictions.
ページTOPに戻る
Table of Contents
Table of Contents
1. Report Overview
1.1 Objectives of the Study
1.2 Introduction to Biosimilars and Follow-on Biologics Market
1.3 What This Report Delivers
1.4 Why You Should Read This Report
1.5 Key Questions Answered by This Analytical Report Include:
1.6 Who is This Report For?
1.7 Methodology
1.7.1 Market Definitions
1.7.2 Market Evaluation & Forecasting Methodology
1.7.3 Data Validation
1.7.3.1 Primary Research
1.7.3.2 Secondary Research
1.8 Frequently Asked Questions (FAQs)
1.9 Associated Visiongain Reports
1.10 About Visiongain
2 Executive Summary
3 Market Overview
3.1 Key Findings
3.2 Market Dynamics
3.2.1 Market Driving Factors
3.2.1.1 Incentivizing Providers to Adopt Biosimilars
3.2.1.2 Developed Regions Driving the Worldwide Biosimilars and Follow-on Biologics Market Growth
3.2.1.3 Biologics Patent Expiry Set to Open Fresh Revenue Pockets for Biosimilars Companies Over the Next Decade
3.2.1.4 Pricing Advantage of Biosimilars Comparison to Biologics Anticipated to Fuel Market Growth
3.2.2 Market Restraining Factors
3.2.2.1 High Cost Involvement, Uncertainty and Complexities in Manufacturing
3.2.2.2 Resistance from Biologics Manufacturers to Restrain Market Growth
3.2.2.3 Reluctance of Healthcare Providers to Switch to Biosimilars
3.2.3 Market Opportunities
3.2.3.1 Companies Can Use Information of Original Innovator thus Shorten Development & Approval Processes
3.2.3.2 Diversity in Approach Among the Authorities
3.3 Trends
3.3.1 Regulatory Hurdles Slowing Down Access to Biosimilars
3.3.2 Vulnerability of Global Pharmaceutical Manufacturing Amid COVID-19
3.3.3 Emerging Economies Continues to Pose Challenges for Building Presence for Generics and Biosimilars Companies
3.3.4 Digital Transformations as a Key Enabler to Strengthen Research in Biosimilars Industry
3.4 COVID-19 Impact Analysis
3.5 Porter’s Five Forces Analysis
3.5.1 Supplier Power
3.5.2 Buyer Power
3.5.3 Competitive Rivalry
3.5.4 Threat from Substitutes
3.5.5 Threat of New Entrants
3.6 PEST Analysis
3.6.1 Political Factors Impacting Biosimilars and Follow-on Biologics Market
3.6.2 Economic Factors Impacting Biosimilars and Follow-on Biologics Market
3.6.3 Social Factors Impacting Biosimilars and Follow-on Biologics Market
3.6.4 Technological Factors Impacting Biosimilars and Follow-on Biologics Market
4 Biosimilars and Follow-on Biologics Market Analysis by Type of Manufacturing
4.1 Key Findings
4.2 Type of Manufacturing Segment: Market Attractiveness Index
4.3 Biosimilars and Follow-on Biologics Market Size Estimation and Forecast by Type of Manufacturing
4.4 In-House
4.4.1 Market Forecast by Region, 2023-2033 (US$ Mn)
4.4.2 Market Share by Region, 2023 & 2033 (%)
4.5 CMOs
4.5.1 Market Forecast by Region, 2023-2033 (US$ Mn)
4.5.2 Market Share by Region, 2023 & 2033 (%)
5 Biosimilars and Follow-on Biologics Market Analysis by Type
5.1 Key Findings
5.2 Biosimilars and Follow-on Biologics Market Size Estimation and Forecast by Type
5.3 Monoclonal Antibodies
5.3.1 Market Forecast by Region, 2023-2033 (US$ Mn)
5.3.2 Market Share by Region, 2023 & 2033 (%)
5.4 Fusion Proteins
5.4.1 Market Forecast by Region, 2023-2033 (US$ Mn)
5.4.2 Market Share by Region, 2023 & 2033 (%)
5.5 Insulin
5.5.1 Market Forecast by Region, 2023-2033 (US$ Mn)
5.5.2 Market Share by Region, 2023 & 2033 (%)
5.6 Erythropoietin
5.6.1 Market Forecast by Region, 2023-2033 (US$ Mn)
5.6.2 Market Share by Region, 2023 & 2033 (%)
5.7 Granulocyte-Colony Stimulating Factor
5.7.1 Market Forecast by Region, 2023-2033 (US$ Mn)
5.7.2 Market Share by Region, 2023 & 2033 (%)
5.8 Interferon
5.8.1 Market Forecast by Region, 2023-2033 (US$ Mn)
5.8.2 Market Share by Region, 2023 & 2033 (%)
5.9 Growth Hormones
5.9.1 Market Forecast by Region, 2023-2033 (US$ Mn)
5.9.2 Market Share by Region, 2023 & 2033 (%)
5.10 Fertility Hormones
5.10.1 Market Forecast by Region, 2023-2033 (US$ Mn)
5.10.2 Market Share by Region, 2023 & 2033 (%)
5.11 Others
5.11.1 Market Forecast by Region, 2023-2033 (US$ Mn)
5.11.2 Market Share by Region, 2023 & 2033 (%)
6 Biosimilars and Follow-on Biologics Market Analysis by Application
6.1 Key Findings
6.2 Application Segment: Market Attractiveness Index
6.3 Biosimilars and Follow-on Biologics Market Size Estimation and Forecast by Application
6.4 Blood Disorders
6.4.1 Market Forecast by Region, 2023-2033 (US$ Mn)
6.4.2 Market Share by Region, 2023 & 2033 (%)
6.5 Oncology Diseases
6.5.1 Market Forecast by Region, 2023-2033 (US$ Mn)
6.5.2 Market Share by Region, 2023 & 2033 (%)
6.6 Chronic & Autoimmune Diseases
6.6.1 Market Forecast by Region, 2023-2033 (US$ Mn)
6.6.2 Market Share by Region, 2023 & 2033 (%)
6.7 Growth Hormone Deficiencies
6.7.1 Market Forecast by Region, 2023-2033 (US$ Mn)
6.7.2 Market Share by Region, 2023 & 2033 (%)
6.8 Others
6.8.1 Market Forecast by Region, 2023-2033 (US$ Mn)
6.8.2 Market Share by Region, 2023 & 2033 (%)
7 Biosimilars and Follow-on Biologics Market Analysis by Technology
7.1 Key Findings
7.2 Technology Segment: Market Attractiveness Index
7.3 Biosimilars and Follow-on Biologics Market Size Estimation and Forecast by Technology
7.4 rDNA Technology
7.4.1 Market Forecast by Region, 2023-2033 (US$ Mn)
7.4.2 Market Share by Region, 2023 & 2033 (%)
7.5 mAbs Technology
7.5.1 Market Forecast by Region, 2023-2033 (US$ Mn)
7.5.2 Market Share by Region, 2023 & 2033 (%)
7.6 Bioassay Technology
7.6.1.1 Chromatography
7.6.1.2 Mass Spectrometry
7.6.1.3 NMR (Nuclear Magnetic Resonance)
7.6.1.4 Electrophoresis
7.6.2 Market Forecast by Region, 2023-2033 (US$ Mn)
7.6.3 Market Share by Region, 2023 & 2033 (%)
8 Biosimilars and Follow-on Biologics Market Analysis by Region
8.1 Key Findings
8.2 Regional Market Size Estimation and Forecast
9 North America Biosimilars and Follow-on Biologics Market Analysis
9.1 Key Findings
9.2 North America Biosimilars and Follow-on Biologics Market Attractiveness Index
9.3 Market Size by Country, 2022, 2027 & 2032 (US$ Mn)
9.4 Market Size Estimation and Forecast by Country, 2023-2033 (US$ Mn)
9.5 Market Size Estimation and Forecast by Type of Manufacturing, 2023-2033 (US$ Mn)
9.6 Market Size Estimation and Forecast by Type, 2023-2033 (US$ Mn)
9.7 Market Size Estimation and Forecast by Application, 2023-2033 (US$ Mn)
9.8 Market Size Estimation and Forecast by Technology, 2023-2033 (US$ Mn)
9.9 U.S.
9.9.1 United States is Just Beginning to Catch Up European Biosimilars Market
9.9.2 Rising Biosimilar Uptake to Fuel U.S. Biosimilars Market Growth
9.9.3 Advancements in Biosimilars Development and Approvals Across the United States to Fuel Market Growth
9.10 Canada
9.10.1 Biosimilar Authorization Activity Across Canadian Region
9.10.2 Initiatives by Health Canada to Boost Canadian Biosimilars and Follow-on Biologics Market Over the Next Decade
9.10.3 Availability of Biosimilars in Oncology Treatment Landscape Driving Regional Growth
9.10.4 Canada Biosimilars and Follow-on Biologics Market Outlook
10 Europe Biosimilars and Follow-on Biologics Market Analysis
10.1 Key Findings
10.2 Growing Prevalence of Lifestyle Diseases Anticipated to Fuel European Biosimilars Market Growth
10.3 Continued Benefits of Biosimilars to Offer Lucrative Growth Prospects in Long Term
10.4 Europe Biosimilars and Follow-on Biologics Market Attractiveness Index
10.5 Market Size by Country, 2022, 2027 & 2032 (US$ Mn)
10.6 Market Size Estimation and Forecast by Country, 2023-2033 (US$ Mn)
10.7 Market Size Estimation and Forecast by Type of Manufacturing, 2023-2033 (US$ Mn)
10.8 Market Size Estimation and Forecast by Type, 2023-2033 (US$ Mn)
10.9 Market Size Estimation and Forecast by Application, 2023-2033 (US$ Mn)
10.10 Market Size Estimation and Forecast by Technology, 2023-2033 (US$ Mn)
10.11 Germany
10.11.1 Biosimilars Have Been Accepted as an Important Component of Proper Medication Usage in Germany
10.11.2 Germany Intends to Switch to Biologics Pharmacies by August 2022 thus Jeopardising the Long-Term Viability of Biosimilars
10.11.3 Germany Biosimilars and Follow-on Biologics Market Outlook
10.12 UK
10.12.1 NHS Encouraging the Growth of Biosimilar Manufacturing in United Kingdom
10.12.2 Despite Price Reduction, Biosimilar Medications are not Widely Used in Retail Settings
10.12.3 UK Biosimilars and Follow-on Biologics Market Outlook
10.13 France
10.14 Italy
10.14.1 Italian Government Policies Anticipated to Fuel Development of Biosimilars Market Across the Region
10.14.2 Biosimilars to Help Reduce Price of Pharmaceuticals Across the Italian Region
10.15 Spain
10.15.1 Budget Impact Analysis of Biosimilar Products in Spain
10.16 Rest of Europe
11 Asia Pacific Biosimilars and Follow-on Biologics Market Analysis
11.1 Key Findings
11.2 Low Clinical Development Costs Coupled with Regulatory Framework Ease to Fuel Regional Growth
11.3 Indian Pharmaceutical Companies Have an Enormous Scope in the Biosimilars Market
11.4 Asia Pacific Biosimilars and Follow-on Biologics Market Attractiveness Index
11.5 Market Size by Country, 2022, 2027 & 2032 (US$ Mn)
11.6 Market Size Estimation and Forecast by Country, 2023-2033 (US$ Mn)
11.7 Market Size Estimation and Forecast by Type of Manufacturing, 2023-2033 (US$ Mn)
11.8 Market Size Estimation and Forecast by Type, 2023-2033 (US$ Mn)
11.9 Market Size Estimation and Forecast by Application, 2023-2033 (US$ Mn)
11.10 Market Size Estimation and Forecast by Technology, 2023-2033 (US$ Mn)
11.11 Japan
11.11.1 Biosimilars to Bolster Japanese Healthcare System Growth Over the Next Decade
11.11.2 Japan still has a slow growth in this sector compared to US and EU
11.11.3 Introduction of Biosimilars to Boost Regional Growth
11.11.4 Ageing Japanese Population Demanding the Development of Biosimilars Over the Forecast Period
11.12 China
11.12.1 Significant Surge in Biosimilar Approvals to Drive Market Growth
11.12.2 Technological Advancements to Fuel Chinese Biosimilars Market Growth Over the Forecast Period
11.12.3 Expansion by Major Firms to Boost Chinese Biosimilars Market Growth
11.12.4 Overcrowding of Chinese Market Has Led to the Withdrawal of International Players
11.13 India
11.13.1 India Set to Become Sixth Largest Pharmaceutical Market By End of 2030
11.13.2 Renowned Pharmaceutical Companies Establishing Partnerships with Indian Pharma Companies
11.13.3 India Biosimilars and Follow-on Biologics Market Outlook
11.14 Rest of Asia Pacific
12 Latin America Biosimilars and Follow-on Biologics Market Analysis
12.1 Key Findings
12.2 Latin America Biosimilars and Follow-on Biologics Market Attractiveness Index
12.3 Market Size by Country, 2022, 2027 & 2032 (US$ Mn)
12.4 Market Size Estimation and Forecast by Country, 2023-2033 (US$ Mn)
12.5 Market Size Estimation and Forecast by Type of Manufacturing, 2023-2033 (US$ Mn)
12.6 Market Size Estimation and Forecast by Type, 2023-2033 (US$ Mn)
12.7 Market Size Estimation and Forecast by Application, 2023-2033 (US$ Mn)
12.8 Market Size Estimation and Forecast by Technology, 2023-2033 (US$ Mn)
12.9 Brazil
12.9.1 Brazilian Biosimilars Regulations
12.10 Mexico
12.11 Rest of Latin America
13 MEA Biosimilars and Follow-on Biologics Market Analysis
13.1 Key Findings
13.2 MEA Biosimilars and Follow-on Biologics Market Attractiveness Index
13.3 Market Size by Country, 2022, 2027 & 2032 (US$ Mn)
13.4 Market Size Estimation and Forecast by Country, 2023-2033 (US$ Mn)
13.5 Market Size Estimation and Forecast by Type of Manufacturing, 2023-2033 (US$ Mn)
13.6 Market Size Estimation and Forecast by Type, 2023-2033 (US$ Mn)
13.7 Market Size Estimation and Forecast by Application, 2023-2033 (US$ Mn)
13.8 Market Size Estimation and Forecast by Technology, 2023-2033 (US$ Mn)
13.9 GCC
13.9.1 GCC Gearing Up to Take Big Jump on Biosimilars
13.9.2 Collaborations Among Pharmaceutical Firms Across GCC to Offer Lucrative Growth Prospects for Market Players Over the Forecast Period
13.10 South Africa
13.10.1 South African Evolving Demographic and Epidemiological Profile to Offer Lucrative Growth Prospects
13.10.2 Presence of Major Pharmaceutical Firms to Intensify Competition
13.11 Rest of MEA
14 Company Profiles
14.1 3SBio, Inc.
14.1.1 Company Snapshot
14.1.2 Company Overview
14.1.3 Product Benchmarking
14.1.4 Strategic Outlook
14.2 AMEGA Biotech
14.2.1 Company Snapshot
14.2.2 Company Overview
14.2.3 Product Benchmarking
14.3 Amgen Inc.
14.3.1 Company Snapshot
14.3.2 Company Overview
14.3.3 Financial Analysis
14.3.3.1 Net Revenue, 2015-2021
14.3.3.2 R&D Expenses, 2015-2021
14.3.3.3 Gross Profit, 2015-2021
14.3.4 Product Benchmarking
14.3.5 Strategic Outlook
14.4 Apotex, Inc.
14.4.1 Company Snapshot
14.4.2 Company Overview
14.4.3 Product Benchmarking
14.5 BIOCAD
14.5.1 Company Snapshot
14.5.2 Company Overview
14.5.3 Product Benchmarking
14.5.4 Strategic Outlook
14.6 Biocon Limited
14.6.1 Company Snapshot
14.6.2 Company Overview
14.6.3 Financial Analysis
14.6.3.1 Net Revenue, 2017-2021
14.6.3.2 R&D Expenses, 2017-2021
14.6.3.3 Biosimilars Sales, 2017-2021
14.6.3.4 Business Segment Market Share, 2021
14.6.3.5 Geographic Market Share, 2021
14.6.4 Product Benchmarking
14.6.5 Strategic Outlook
14.7 Biogen, Inc.
14.7.1 Company Snapshot
14.7.2 Company Overview
14.7.3 Product Benchmarking
14.8 Celltrion Healthcare Co.,Ltd.
14.8.1 Company Snapshot
14.8.2 Company Overview
14.8.3 Product Benchmarking
14.8.4 Strategic Outlook
14.9 Coherus BioSciences
14.9.1 Company Snapshot
14.9.2 Company Overview
14.9.3 Product Benchmarking
14.9.4 Strategic Outlook
14.10 Dr. Reddy’s Laboratories Ltd.
14.10.1 Company Snapshot
14.10.2 Company Overview
14.10.3 Product Benchmarking
14.11 Eli Lilly and Company
14.11.1 Company Snapshot
14.11.2 Company Overview
14.11.3 Financial Analysis
14.11.3.1 Net Revenue, 2015-2021
14.11.3.2 R&D Expenses, 2015-2021
14.11.3.3 Gross Profit, 2015-2021
14.11.3.4 Geographic Revenue, 2018-2021
14.11.4 Product Benchmarking
14.11.5 Strategic Outlook
14.12 Gedeon Richter PLC
14.12.1 Company Snapshot
14.12.2 Company Overview
14.12.3 Product Benchmarking
14.12.4 Strategic Outlook
14.13 Intas Pharmaceutical Ltd.
14.13.1 Company Snapshot
14.13.2 Company Overview
14.13.3 Product Benchmarking
14.14 Mabxience SA
14.14.1 Company Snapshot
14.14.2 Company Overview
14.14.3 Product Benchmarking
14.14.4 Strategic Outlook
14.15 Viatris Inc. (Mylan NV)
14.15.1 Company Snapshot
14.15.2 Company Overview
14.15.3 Financial Analysis
14.15.3.1 Net Revenue, 2015-2021
14.15.3.2 R&D Expenses, 2015-2021
14.15.3.3 Gross Profit, 2015-2021
14.15.4 Product Benchmarking
14.15.5 Strategic Outlook
14.16 Novartis AG
14.16.1 Company Snapshot
14.16.2 Company Overview
14.16.3 Financial Analysis
14.16.3.1 Net Revenue, 2015-2021
14.16.3.2 R&D Expenses, 2015-2021
14.16.3.3 Gross Profit, 2015-2021
14.16.3.4 Net Sales by Business Segment, 2019-2021
14.16.3.5 Net sales to third parties by business franchise in the Sandoz Division, 2020
14.16.4 Product Benchmarking
14.16.5 Strategic Outlook
14.17 Pfizer Inc.
14.17.1 Company Snapshot
14.17.2 Company Overview
14.17.3 Financial Analysis
14.17.3.1 Net Revenue, 2015-2021
14.17.3.2 R&D Expenses, 2015-2021
14.17.3.3 Gross Profit, 2015-2021
14.17.3.4 Geographic Market Share, 2021
14.17.4 Product Benchmarking
14.17.5 Strategic Outlook
14.18 Samsung Bioepis Co. Ltd.
14.18.1 Company Snapshot
14.18.2 Company Overview
14.18.3 Product Benchmarking
14.18.4 Strategic Outlook
14.19 Stada Arzneimittel AG
14.19.1 Company Snapshot
14.19.2 Company Overview
14.19.3 Financial Analysis
14.19.3.1 Net Revenue, 2016-2020
14.19.3.2 Gross Profit, 2016-2020
14.19.3.3 Net Sales by Segment, 2019-2020
14.19.4 Product Benchmarking
14.19.5 Strategic Outlook
14.20 Teva Pharmaceutical
14.20.1 Company Snapshot
14.20.2 Company Overview
14.20.3 Financial Analysis
14.20.3.1 Net Revenue, 2015-2021
14.20.3.2 R&D Expenses, 2015-2021
14.20.3.3 Gross Profit, 2015-2021
14.20.4 Product Benchmarking
15 Conclusion and Recommendations
15.1 Concluding Remarks from Visiongain
15.2 Recommendations for Market Players
List of Tables
Table 1 Biosimilars and Follow-on Biologics Market Snapshot, 2023 & 2033 (US$ million, CAGR %)
Table 2 Biosimilars and Follow-on Biologics Market Forecast by Region, 2023-2033 (US$ mn, AGR%, CAGR%): "V" Shaped Recovery
Table 3 Biosimilars and Follow-on Biologics Market Forecast by Region, 2023-2033 (US$ mn, AGR%, CAGR%): "U" Shaped Recovery
Table 4 Biosimilars and Follow-on Biologics Market Forecast by Region, 2023-2033 (US$ mn, AGR%, CAGR%): "W" Shaped Recovery
Table 5 Biosimilars and Follow-on Biologics Market Forecast by Region, 2023-2033 (US$ mn, AGR%, CAGR%): "L" Shaped Recovery
Table 6 Biosimilars and Follow-on Biologics Market Forecast by Type of Manufacturing, 2023-2033 (US$ mn, AGR%, CAGR%)
Table 7 In-House Segment Market Forecast by Region, 2023-2033 (US$ mn, AGR%, CAGR%)
Table 8 CMOs Segment Market Forecast by Region, 2023-2033 (US$ mn, AGR%, CAGR%)
Table 9 Global Biosimilars and Follow-on Biologics Market Forecast by Type, 2023-2033 (US$ mn, AGR%, CAGR%)
Table 10 Monoclonal Antibodies Segment Market Forecast by Region, 2023-2033 (US$ mn, AGR%, CAGR%)
Table 11 Fusion Proteins Segment Market Forecast by Region, 2023-2033 (US$ mn, AGR%, CAGR%)
Table 12 Insulin Segment Market Forecast by Region, 2023-2033 (US$ mn, AGR%, CAGR%)
Table 13 Erythropoietin Segment Market Forecast by Region, 2023-2033 (US$ mn, AGR%, CAGR%)
Table 14 Granulocyte-Colony Stimulating Factor Companies Segment Market Forecast by Region, 2023-2033 (US$ mn, AGR%, CAGR%)
Table 15 Interferon Segment Market Forecast by Region, 2023-2033 (US$ mn, AGR%, CAGR%)
Table 16 Growth Hormones Segment Market Forecast by Region, 2023-2033 (US$ mn, AGR%, CAGR%)
Table 17 Fertility Hormones Segment Market Forecast by Region, 2023-2033 (US$ mn, AGR%, CAGR%)
Table 18 Others Segment Market Forecast by Region, 2023-2033 (US$ mn, AGR%, CAGR%)
Table 19 Global Biosimilars and Follow-on Biologics Market Forecast by Application, 2023-2033 (US$ mn, AGR%, CAGR%)
Table 20 Blood Disorders Segment Market Forecast by Region, 2023-2033 (US$ mn, AGR%, CAGR%)
Table 21 Oncology Diseases Segment Market Forecast by Region, 2023-2033 (US$ mn, AGR%, CAGR%)
Table 22 Chronic & Autoimmune Diseases Segment Market Forecast by Region, 2023-2033 (US$ mn, AGR%, CAGR%)
Table 23 Growth Hormone Deficiencies Segment Market Forecast by Region, 2023-2033 (US$ mn, AGR%, CAGR%)
Table 24 Others Segment Market Forecast by Region, 2023-2033 (US$ mn, AGR%, CAGR%)
Table 25 Biosimilars and Follow-on Biologics Market Forecast by Technology, 2023-2033 (US$ mn, AGR%, CAGR%)
Table 26 rDNA Technology Segment Market Forecast by Region, 2023-2033 (US$ mn, AGR%, CAGR%)
Table 27 Mab Technology Segment Market Forecast by Region, 2023-2033 (US$ mn, AGR%, CAGR%)
Table 28 Bioassay Technology Segment Market Forecast by Region, 2023-2033 (US$ mn, AGR%, CAGR%)
Table 29 Biosimilars and Follow-on Biologics Market Forecast by Region, 2023-2033 (US$ mn, AGR%, CAGR%)
Table 30 North America Biosimilars and Follow-on Biologics Market Forecast by Country, 2023-2033 (US$ mn, AGR%, CAGR%)
Table 31 North America Biosimilars and Follow-on Biologics Market Forecast by Type of Manufacturing, 2023-2033 (US$ mn, AGR%, CAGR%)
Table 32 North America Biosimilars and Follow-on Biologics Market Forecast by Type, 2023-2033 (US$ mn, AGR%, CAGR%)
Table 33 North America Biosimilars and Follow-on Biologics Market Forecast by Application, 2023-2033 (US$ mn, AGR%, CAGR%)
Table 34 North America Biosimilars and Follow-on Biologics Market Forecast by Technology, 2023-2033 (US$ mn, AGR%, CAGR%)
Table 35 FDA Approved Biosimilars as of September 2022
Table 36 U.S. Biosimilars and Follow-on Biologics Market Forecast, 2023-2033 (US$ mn, AGR%, CAGR%)
Table 37 Canada Biosimilars and Follow-on Biologics Market Forecast, 2023-2033 (US$ mn, AGR%, CAGR%)
Table 38 Europe Biosimilars and Follow-on Biologics Market Forecast by Country, 2023-2033 (US$ mn, AGR%, CAGR%)
Table 39 Europe Biosimilars and Follow-on Biologics Market Forecast by Type of Manufacturing, 2023-2033 (US$ mn, AGR%, CAGR%)
Table 40 Europe Biosimilars and Follow-on Biologics Market Forecast by Type, 2023-2033 (US$ mn, AGR%, CAGR%)
Table 41 Europe Biosimilars and Follow-on Biologics Market Forecast by Application, 2023-2033 (US$ mn, AGR%, CAGR%)
Table 42 Europe Biosimilars and Follow-on Biologics Market Forecast by Technology, 2023-2033 (US$ mn, AGR%, CAGR%)
Table 43 Germany Biosimilars and Follow-on Biologics Market Forecast, 2023-2033 (US$ mn, AGR%, CAGR%)
Table 44 UK Biosimilars and Follow-on Biologics Market Forecast, 2023-2033 (US$ mn, AGR%, CAGR%)
Table 45 France Biosimilars and Follow-on Biologics Market Forecast, 2023-2033 (US$ mn, AGR%, CAGR%)
Table 46 Italy Biosimilars and Follow-on Biologics Market Forecast, 2023-2033 (US$ mn, AGR%, CAGR%)
Table 47 Spain Biosimilars and Follow-on Biologics Market Forecast, 2023-2033 (US$ mn, AGR%, CAGR%)
Table 48 Rest of Europe Biosimilars and Follow-on Biologics Market Forecast, 2023-2033 (US$ mn, AGR%, CAGR%)
Table 49 Asia Pacific Biosimilars and Follow-on Biologics Market Forecast by Country, 2023-2033 (US$ mn, AGR%, CAGR%)
Table 50 Asia Pacific Biosimilars and Follow-on Biologics Market Forecast by Type of Manufacturing, 2023-2033 (US$ mn, AGR%, CAGR%)
Table 51 Asia Pacific Biosimilars and Follow-on Biologics Market Forecast by Type, 2023-2033 (US$ mn, AGR%, CAGR%)
Table 52 Asia Pacific Biosimilars and Follow-on Biologics Market Forecast by Application, 2023-2033 (US$ mn, AGR%, CAGR%)
Table 53 Asia Pacific Biosimilars and Follow-on Biologics Market Forecast by Technology, 2023-2033 (US$ mn, AGR%, CAGR%)
Table 54 Japan Biosimilars and Follow-on Biologics Market Forecast, 2023-2033 (US$ mn, AGR%, CAGR%)
Table 55 China Biosimilars and Follow-on Biologics Market Forecast, 2023-2033 (US$ mn, AGR%, CAGR%)
Table 56 India Biosimilars and Follow-on Biologics Market Forecast, 2023-2033 (US$ mn, AGR%, CAGR%)
Table 57 Rest of Asia Pacific Biosimilars and Follow-on Biologics Market Forecast, 2023-2033 (US$ mn, AGR%, CAGR%)
Table 58 Latin America Biosimilars and Follow-on Biologics Market Forecast by Country, 2023-2033 (US$ mn, AGR%, CAGR%)
Table 59 Latin America Biosimilars and Follow-on Biologics Market Forecast by Type of Manufacturing, 2023-2033 (US$ mn, AGR%, CAGR%)
Table 60 Latin America Biosimilars and Follow-on Biologics Market Forecast by Type, 2023-2033 (US$ mn, AGR%, CAGR%)
Table 61 Latin America Biosimilars and Follow-on Biologics Market Forecast by Application, 2023-2033 (US$ mn, AGR%, CAGR%)
Table 62 Latin America Biosimilars and Follow-on Biologics Market Forecast by Technology, 2023-2033 (US$ mn, AGR%, CAGR%)
Table 63 Brazil Biosimilars and Follow-on Biologics Market Forecast, 2023-2033 (US$ mn, AGR%, CAGR%)
Table 64 Mexico Biosimilars and Follow-on Biologics Market Forecast, 2023-2033 (US$ mn, AGR%, CAGR%)
Table 65 Rest of Latin America Biosimilars and Follow-on Biologics Market Forecast, 2023-2033 (US$ mn, AGR%, CAGR%)
Table 66 MEA Biosimilars and Follow-on Biologics Market Forecast by Country, 2023-2033 (US$ mn, AGR%, CAGR%)
Table 67 MEA Biosimilars and Follow-on Biologics Market Forecast by Type of Manufacturing, 2023-2033 (US$ mn, AGR%, CAGR%)
Table 68 MEA Biosimilars and Follow-on Biologics Market Forecast by Type, 2023-2033 (US$ mn, AGR%, CAGR%)
Table 69 MEA Biosimilars and Follow-on Biologics Market Forecast by Application, 2023-2033 (US$ mn, AGR%, CAGR%)
Table 70 MEA Biosimilars and Follow-on Biologics Market Forecast by Technology, 2023-2033 (US$ mn, AGR%, CAGR%)
Table 71 GCC Biosimilars and Follow-on Biologics Market Forecast, 2023-2033 (US$ mn, AGR%, CAGR%)
Table 72 South Africa Biosimilars and Follow-on Biologics Market Forecast, 2023-2033 (US$ mn, AGR%, CAGR%)
Table 73 Rest of MEA Biosimilars and Follow-on Biologics Market Forecast, 2023-2033 (US$ mn, AGR%, CAGR%)
Table 74 3SBio, Inc.: Key Details, (CEO, HQ, Revenue, Founded, No. of Employees, Company Type, Website, Business Segment)
Table 75 3SBio, Inc.: Product Benchmarking
Table 76 3SBio, Inc.: Strategic Outlook
Table 77 AMEGA Biotech: Key Details, (CEO, HQ, Revenue, Founded, No. of Employees, Company Type, Website, Business Segment)
Table 78 AMEGA Biotech: Product Benchmarking
Table 79 Amgen Inc.: Key Details, (CEO, HQ, Revenue, Founded, No. of Employees, Company Type, Website, Business Segment)
Table 80 Amgen Inc.: Product Benchmarking
Table 81 Amgen Inc.: Strategic Outlook
Table 82 Apotex, Inc.: Key Details, (CEO, HQ, Revenue, Founded, No. of Employees, Company Type, Website, Business Segment)
Table 83 Apotex, Inc.: Product Benchmarking
Table 84 BIOCAD: Key Details, (CEO, HQ, Revenue, Founded, No. of Employees, Company Type, Website, Business Segment)
Table 85 BIOCAD: Product Benchmarking
Table 86 BIOCAD: Strategic Outlook
Table 87 Biocon Limited: Key Details, (CEO, HQ, Revenue, Founded, No. of Employees, Company Type, Website, Business Segment)
Table 88 Biocon Limited: Product Benchmarking
Table 89 Biocon Limited: Strategic Outlook
Table 90 Biogen, Inc.: Key Details, (CEO, HQ, Revenue, Founded, No. of Employees, Company Type, Website, Business Segment)
Table 91 Biogen, Inc.: Product Benchmarking
Table 92 Celltrion Healthcare Co.,Ltd.: Key Details, (CEO, HQ, Revenue, Founded, No. of Employees, Company Type, Website, Business Segment)
Table 93 Celltrion Healthcare Co.,Ltd.: Product Benchmarking
Table 94 Celltrion Healthcare Co.,Ltd.: Strategic Outlook
Table 95 Coherus BioSciences: Key Details, (CEO, HQ, Revenue, Founded, No. of Employees, Company Type, Website, Business Segment)
Table 96 Coherus BioSciences: Product Benchmarking
Table 97 Coherus BioSciences: Strategic Outlook
Table 98 Dr. Reddy’s Laboratories Ltd.: Key Details, (CEO, HQ, Revenue, Founded, No. of Employees, Company Type, Website, Business Segment)
Table 99 Dr. Reddy’s Laboratories Ltd.: Product Benchmarking
Table 100 Eli Lilly and Company: Key Details, (CEO, HQ, Revenue, Founded, No. of Employees, Company Type, Website, Business Segment)
Table 101 Eli Lilly and Company: Product Benchmarking
Table 102 Eli Lilly and Company: Strategic Outlook
Table 103 Gedeon Richter PLC: Key Details, (CEO, HQ, Revenue, Founded, No. of Employees, Company Type, Website, Business Segment)
Table 104 Gedeon Richter PLC: Product Benchmarking
Table 105 Gedeon Richter PLC: Strategic Outlook
Table 106 Intas Pharmaceutical Ltd.: Key Details, (CEO, HQ, Revenue, Founded, No. of Employees, Company Type, Website, Business Segment)
Table 107 Intas Pharmaceutical Ltd.: Product Benchmarking
Table 108 Mabxience SA: Key Details, (CEO, HQ, Revenue, Founded, No. of Employees, Company Type, Website, Business Segment)
Table 109 Mabxience SA: Product Benchmarking
Table 110 Mabxience SA: Strategic Outlook
Table 111 Viatris Inc. (Mylan NV): Key Details, (CEO, HQ, Revenue, Founded, No. of Employees, Company Type, Website, Business Segment)
Table 112 Viatris Inc. (Mylan NV): Product Benchmarking
Table 113 Viatris Inc. (Mylan NV): Strategic Outlook
Table 114 Novartis AG: Key Details, (CEO, HQ, Revenue, Founded, No. of Employees, Company Type, Website, Business Segment)
Table 115 Novartis AG: Product Benchmarking
Table 116 Novartis AG: Strategic Outlook
Table 117 Pfizer Inc.: Key Details, (CEO, HQ, Revenue, Founded, No. of Employees, Company Type, Website, Business Segment)
Table 118 Pfizer Inc.: Product Benchmarking
Table 119 Pfizer Inc.: Strategic Outlook
Table 120 Samsung Bioepis Co. Ltd.: Key Details, (CEO, HQ, Revenue, Founded, No. of Employees, Company Type, Website, Business Segment)
Table 121 Samsung Bioepis Co. Ltd.: Product Benchmarking
Table 122 Samsung Bioepis Co. Ltd.: Strategic Outlook
Table 123 Stada Arzneimittel AG: Key Details, (CEO, HQ, Revenue, Founded, No. of Employees, Company Type, Website, Business Segment)
Table 124 Stada Arzneimittel AG: Product Benchmarking
Table 125 Stada Arzneimittel AG: Strategic Outlook
Table 126 Teva Pharmaceutical: Key Details, (CEO, HQ, Revenue, Founded, No. of Employees, Company Type, Website, Business Segment)
Table 127 Teva Pharmaceutical: Strategic Outlook
List of Figures
Figure 1 Biosimilars and Follow-on Biologics Market Segmentation
Figure 2 Biosimilars and Follow-on Biologics Market by Type of Manufacturing: Market Attractiveness Index
Figure 3 Biosimilars and Follow-on Biologics Market by Application: Market Attractiveness Index
Figure 4 Biosimilars and Follow-on Biologics Market by Technology: Market Attractiveness Index
Figure 5 Biosimilars and Follow-on Biologics Market Attractiveness Index by Region
Figure 6 Biosimilars and Follow-on Biologics Market: Market Dynamics
Figure 7 Biologics Patent Expiry, 2020-2030
Figure 8 Biosimilars and Follow-on Biologics Market by Region, 2023-2033 (US$ Mn, AGR %): “V” Shaped Recovery
Figure 9 Biosimilars and Follow-on Biologics Market by Region, 2023-2033 (US$ Mn, AGR %): “U” Shaped Recovery
Figure 10 Biosimilars and Follow-on Biologics Market by Region, 2023-2033 (US$ Mn, AGR %): “W” Shaped Recovery
Figure 11 Biosimilars and Follow-on Biologics Market by Region, 2023-2033 (US$ Mn, AGR %): “L” Shaped Recovery
Figure 12 Biosimilars and Follow-on Biologics Market: Porter’s Five Forces Analysis
Figure 13 Biosimilars and Follow-on Biologics Market: PEST Analysis
Figure 14 Biosimilars and Follow-on Biologics Market Attractiveness Index by Type of Manufacturing
Figure 15 Biosimilars and Follow-on Biologics Market Forecast by Type of Manufacturing, 2023-2033 (US$ million)
Figure 16 Biosimilars and Follow-on Biologics Market Share Forecast by Type of Manufacturing, 2023, 2028, 2033 (%)
Figure 17 In-House Market Forecast by Region, 2023-2033 (US$ million)
Figure 18 In-House Market Share Forecast by Region, 2023 & 2033 (%)
Figure 19 CMOs Market Forecast by Region, 2023-2033 (US$ million)
Figure 20 CMOs Market Share Forecast by Region, 2023 & 2033 (%)
Figure 21 Biosimilars and Follow-on Biologics Market Forecast by Type, 2023-2033 (US$ million)
Figure 22 Biosimilars and Follow-on Biologics Market Share Forecast by Type, 2023, 2028, 2033 (%)
Figure 23 Monoclonal Antibodies Market Forecast by Region, 2023-2033 (US$ million)
Figure 24 Monoclonal Antibodies Market Share Forecast by Region, 2023 & 2033 (%)
Figure 25 Fusion Proteins Market Forecast by Region, 2023-2033 (US$ million)
Figure 26 Fusion Proteins Market Share Forecast by Region, 2023 & 2033 (%)
Figure 27 Insulin Market Forecast by Region, 2023-2033 (US$ million)
Figure 28 Insulin Market Share Forecast by Region, 2023 & 2033 (%)
Figure 29 Erythropoietin Market Forecast by Region, 2023-2033 (US$ million)
Figure 30 Erythropoietin Market Share Forecast by Region, 2023 & 2033 (%)
Figure 31 Granulocyte-Colony Stimulating Factor Market Forecast by Region, 2023-2033 (US$ million)
Figure 32 Granulocyte-Colony Stimulating Factor Market Share Forecast by Region, 2023 & 2033 (%)
Figure 33 Interferon Market Forecast by Region, 2023-2033 (US$ million)
Figure 34 Interferon Market Share Forecast by Region, 2023 & 2033 (%)
Figure 35 Growth Hormones Market Forecast by Region, 2023-2033 (US$ million)
Figure 36 Growth Hormones Market Share Forecast by Region, 2023 & 2033 (%)
Figure 37 Fertility Hormones Market Forecast by Region, 2023-2033 (US$ million)
Figure 38 Fertility Hormones Market Share Forecast by Region, 2023 & 2033 (%)
Figure 39 Others Market Forecast by Region, 2023-2033 (US$ million)
Figure 40 Others Market Share Forecast by Region, 2023 & 2033 (%)
Figure 41 Biosimilars and Follow-on Biologics Market Attractiveness Index by Application
Figure 42 Biosimilars and Follow-on Biologics Market Forecast by Application, 2023-2033 (US$ million)
Figure 43 Biosimilars and Follow-on Biologics Market Share Forecast by Application, 2023, 2028, 2033 (%)
Figure 44 Blood Disorders Market Forecast by Region, 2023-2033 (US$ million)
Figure 45 Blood Disorders Market Share Forecast by Region, 2023 & 2033 (%)
Figure 46 Oncology Diseases Market Forecast by Region, 2023-2033 (US$ million)
Figure 47 Oncology Diseases Market Share Forecast by Region, 2023 & 2033 (%)
Figure 48 Chronic & Autoimmune Diseases Market Forecast by Region, 2023-2033 (US$ million)
Figure 49 Chronic & Autoimmune Diseases Market Share Forecast by Region, 2023 & 2033 (%)
Figure 50 Growth Hormone Deficiencies Market Forecast by Region, 2023-2033 (US$ million)
Figure 51 Growth Hormone Deficiencies Market Share Forecast by Region, 2023 & 2033 (%)
Figure 52 Others Market Forecast by Region, 2023-2033 (US$ million)
Figure 53 Others Market Share Forecast by Region, 2023 & 2033 (%)
Figure 54 Biosimilars and Follow-on Biologics Market Attractiveness Index by Technology
Figure 55 Biosimilars and Follow-on Biologics Market Forecast by Technology, 2023-2033 (US$ million)
Figure 56 Biosimilars and Follow-on Biologics Market Share Forecast by Technology, 2023, 2028, 2033 (%)
Figure 57 rDNA Technology Market Forecast by Region, 2023-2033 (US$ million)
Figure 58 rDNA Technology Market Share Forecast by Region, 2023 & 2033 (%)
Figure 59 mAbs Technology Market Forecast by Region, 2023-2033 (US$ million)
Figure 60 mAbs Technology Market Share Forecast by Region, 2023 & 2033 (%)
Figure 61 Bioassay Technology Market Forecast by Region, 2023-2033 (US$ million)
Figure 62 Bioassay Technology Market Share Forecast by Region, 2023 & 2033 (%)
Figure 63 Biosimilars and Follow-on Biologics Market Forecast by Region 2022, 2027, 2032 (Revenue, CAGR%)
Figure 64 Biosimilars and Follow-on Biologics Market Share Forecast by Region 2022, 2027, 2032(%)
Figure 65 Biosimilars and Follow-on Biologics Market by Region, 2023-2033 (US$ Mn)
Figure 66 North America Biosimilars and Follow-on Biologics Market Attractiveness Index
Figure 67 North America Biosimilars and Follow-on Biologics Market by Region, 2022, 2027 & 2032 (US$ million)
Figure 68 North America Biosimilars and Follow-on Biologics Market Forecast by Country, 2023-2033 (US$ million)
Figure 69 North America Biosimilars and Follow-on Biologics Market Share Forecast by Country, 2023 & 2033 (%)
Figure 70 North America Biosimilars and Follow-on Biologics Market Forecast by Type of Manufacturing, 2023-2033 (US$ million)
Figure 71 North America Biosimilars and Follow-on Biologics Market Forecast by Type, 2023-2033 (US$ million)
Figure 72 North America Biosimilars and Follow-on Biologics Market Forecast by Application, 2023-2033 (US$ million)
Figure 73 North America Biosimilars and Follow-on Biologics Market Forecast by Technology, 2023-2033 (US$ million)
Figure 74 U.S. Biosimilars and Follow-on Biologics Market Forecast, 2023-2033 (US$ million)
Figure 75 Canada Biosimilars and Follow-on Biologics Market Forecast, 2023-2033 (US$ million)
Figure 76 Europe Biosimilars and Follow-on Biologics Market Attractiveness Index
Figure 77 Europe Biosimilars and Follow-on Biologics Market by Region, 2022, 2027 & 2032 (US$ million)
Figure 78 Europe Biosimilars and Follow-on Biologics Market Forecast by Country, 2023-2033 (US$ million)
Figure 79 Europe Biosimilars and Follow-on Biologics Market Share Forecast by Country, 2023 & 2033 (%)
Figure 80 Europe Biosimilars and Follow-on Biologics Market Forecast by Type of Manufacturing, 2023-2033 (US$ million)
Figure 81 Europe Biosimilars and Follow-on Biologics Market Forecast by Type, 2023-2033 (US$ million)
Figure 82 Europe Biosimilars and Follow-on Biologics Market Forecast by Application, 2023-2033 (US$ million)
Figure 83 Europe Biosimilars and Follow-on Biologics Market Forecast by Technology, 2023-2033 (US$ million)
Figure 84 Germany Biosimilars and Follow-on Biologics Market Forecast, 2023-2033 (US$ million)
Figure 85 UK Biosimilars and Follow-on Biologics Market Forecast, 2023-2033 (US$ million)
Figure 86 France Biosimilars and Follow-on Biologics Market Forecast, 2023-2033 (US$ million)
Figure 87 Italy Biosimilars and Follow-on Biologics Market Forecast, 2023-2033 (US$ million)
Figure 88 Spain Biosimilars and Follow-on Biologics Market Forecast, 2023-2033 (US$ million)
Figure 89 Rest of Europe Biosimilars and Follow-on Biologics Market Forecast, 2023-2033 (US$ million)
Figure 90 Asia Pacific Biosimilars and Follow-on Biologics Market Attractiveness Index
Figure 91 Asia Pacific Biosimilars and Follow-on Biologics Market by Region, 2022, 2027 & 2032 (US$ million)
Figure 92 Asia Pacific Biosimilars and Follow-on Biologics Market Forecast by Country, 2023-2033 (US$ million)
Figure 93 Asia Pacific Biosimilars and Follow-on Biologics Market Share Forecast by Country, 2023 & 2033 (%)
Figure 94 Asia Pacific Biosimilars and Follow-on Biologics Market Forecast by Type of Manufacturing, 2023-2033 (US$ million)
Figure 95 Asia Pacific Biosimilars and Follow-on Biologics Market Forecast by Type, 2023-2033 (US$ million)
Figure 96 Asia Pacific Biosimilars and Follow-on Biologics Market Forecast by Application, 2023-2033 (US$ million)
Figure 97 Asia Pacific Biosimilars and Follow-on Biologics Market Forecast by Technology, 2023-2033 (US$ million)
Figure 98 Japan Biosimilars and Follow-on Biologics Market Forecast, 2023-2033 (US$ million)
Figure 99 Biosimilar Approvals in China vs. Japan & South Korea, 2015-2020
Figure 100 China Biosimilars and Follow-on Biologics Market Forecast, 2023-2033 (US$ million)
Figure 101 India Biosimilars and Follow-on Biologics Market Forecast, 2023-2033 (US$ million)
Figure 102 Rest of Asia Pacific Biosimilars and Follow-on Biologics Market Forecast, 2023-2033 (US$ million)
Figure 103 Latin America Biosimilars and Follow-on Biologics Market Attractiveness Index
Figure 104 Latin America Biosimilars and Follow-on Biologics Market by Region, 2022, 2027 & 2032 (US$ million)
Figure 105 Latin America Biosimilars and Follow-on Biologics Market Forecast by Country, 2023-2033 (US$ million)
Figure 106 Latin America Biosimilars and Follow-on Biologics Market Share Forecast by Country, 2023 & 2033 (%)
Figure 107 Latin America Biosimilars and Follow-on Biologics Market Forecast by Type of Manufacturing, 2023-2033 (US$ million)
Figure 108 Latin America Biosimilars and Follow-on Biologics Market Forecast by Type, 2023-2033 (US$ million)
Figure 109 Latin America Biosimilars and Follow-on Biologics Market Forecast by Application, 2023-2033 (US$ million)
Figure 110 Latin America Biosimilars and Follow-on Biologics Market Forecast by Technology, 2023-2033 (US$ million)
Figure 111 Brazil Biosimilars and Follow-on Biologics Market Forecast, 2023-2033 (US$ million)
Figure 112 Mexico Biosimilars and Follow-on Biologics Market Forecast, 2023-2033 (US$ million)
Figure 113 Rest of Latin America Biosimilars and Follow-on Biologics Market Forecast, 2023-2033 (US$ million)
Figure 114 MEA Biosimilars and Follow-on Biologics Market Attractiveness Index
Figure 115 MEA Biosimilars and Follow-on Biologics Market by Region, 2022, 2027 & 2032 (US$ million)
Figure 116 MEA Biosimilars and Follow-on Biologics Market Forecast by Country, 2023-2033 (US$ million)
Figure 117 MEA Biosimilars and Follow-on Biologics Market Share Forecast by Country, 2023 & 2033 (%)
Figure 118 MEA Biosimilars and Follow-on Biologics Market Forecast by Type of Manufacturing, 2023-2033 (US$ million)
Figure 119 MEA Biosimilars and Follow-on Biologics Market Forecast by Type, 2023-2033 (US$ million)
Figure 120 MEA Biosimilars and Follow-on Biologics Market Forecast by Application, 2023-2033 (US$ million)
Figure 121 MEA Biosimilars and Follow-on Biologics Market Forecast by Technology, 2023-2033 (US$ million)
Figure 122 GCC Biosimilars and Follow-on Biologics Market Forecast, 2023-2033 (US$ million)
Figure 123 South Africa Biosimilars and Follow-on Biologics Market Forecast, 2023-2033 (US$ million)
Figure 124 Rest of MEA Biosimilars and Follow-on Biologics Market Forecast, 2023-2033 (US$ million)
Figure 125 Amgen Inc.: Net Revenue, 2015-2021 (US$ million, AGR%)
Figure 126 Amgen Inc.: R&D Expenses, 2015-2021 (US$ million, AGR%)
Figure 127 Amgen Inc.: Gross Profit, 2015-2021 (US$ million, AGR%)
Figure 128 Biocon Limited: Net Revenue, 2017-2021 (US$ million, AGR%)
Figure 129 Biocon Limited: R&D Expenses, 2017-2021 (US$ million, AGR%)
Figure 130 Biocon Limited: Biosimilars Sales, 2017-2021 (US$ million, AGR%)
Figure 131 Biocon Limited: Business Segment Market Share, 2021 (%)
Figure 132 Biocon Limited: Geographic Market Share, 2021 (%)
Figure 133 Eli Lilly and Company: Net Revenue, 2015-2021 (US$ million, AGR%)
Figure 134 Eli Lilly and Company: R&D Expenses, 2015-2021 (US$ million, AGR%)
Figure 135 Eli Lilly and Company: Gross Profit, 2015-2021 (US$ million, AGR%)
Figure 136 Eli Lilly and Company: Geographic Revenue, 2018-2021 (US$ million)
Figure 137 Viatris Inc. (Mylan NV): Net Revenue, 2015-2021 (US$ million, AGR%)
Figure 138 Viatris Inc. (Mylan NV): R&D Expenses, 2015-2021 (US$ million, AGR%)
Figure 139 Viatris Inc. (Mylan NV): Gross Profit, 2015-2021 (US$ million, AGR%)
Figure 140 Novartis AG: Net Revenue, 2015-2021 (US$ million, AGR%)
Figure 141 Novartis AG: R&D Expenses, 2015-2021 (US$ million, AGR%)
Figure 142 Novartis AG: Gross Profit, 2015-2021 (US$ million, AGR%)
Figure 143 Novartis AG: Net Sales by Business Segment, 2019-2021 (US$ million)
Figure 144 Novartis AG: Net sales to third parties by business franchise in the Sandoz Division, 2020 (%)
Figure 145 Pfizer Inc.: Net Revenue, 2015-2021 (US$ million, AGR%)
Figure 146 Pfizer Inc.: R&D Expenses, 2015-2021 (US$ million, AGR%)
Figure 147 Pfizer Inc.: Gross Profit, 2015-2021 (US$ million, AGR%)
Figure 148 Pfizer Inc.: Geographic Revenue Share, 2021 (%)
Figure 149 Stada Arzneimittel AG: Net Revenue, 2016-2020 (US$ million, AGR%)
Figure 150 Stada Arzneimittel AG: Gross Profit, 2016-2020 (US$ million, AGR%)
Figure 151 Stada Arzneimittel AG: Net Income, 2021 (%)
Figure 152 Teva Pharmaceutical: Net Revenue, 2015-2021 (US$ million, AGR%)
Figure 153 Teva Pharmaceutical: R&D Expenses, 2015-2021 (US$ million, AGR%)
Figure 154 Teva Pharmaceutical: Gross Profit, 2015-2021 (US$ million, AGR%)
ページTOPに戻る
- 本レポートと同じKEY WORDの最新刊レポートはありません。
よくあるご質問
Visiongain社はどのような調査会社ですか?
英国の調査会社ヴィジョンゲイン社(Visiongain)は、通信とエネルギーのほか、自動車や化学・医薬品、金属など、広範な市場を対象に調査を行っています。自動車市場については、市場全般に関する調査のほ... もっと見る
調査レポートの納品までの日数はどの程度ですか?
在庫のあるものは速納となりますが、平均的には 3-4日と見て下さい。
但し、一部の調査レポートでは、発注を受けた段階で内容更新をして納品をする場合もあります。
発注をする前のお問合せをお願いします。
注文の手続きはどのようになっていますか?
1)お客様からの御問い合わせをいただきます。
2)見積書やサンプルの提示をいたします。
3)お客様指定、もしくは弊社の発注書をメール添付にて発送してください。
4)データリソース社からレポート発行元の調査会社へ納品手配します。
5) 調査会社からお客様へ納品されます。最近は、pdfにてのメール納品が大半です。
お支払方法の方法はどのようになっていますか?
納品と同時にデータリソース社よりお客様へ請求書(必要に応じて納品書も)を発送いたします。
お客様よりデータリソース社へ(通常は円払い)の御振り込みをお願いします。
請求書は、納品日の日付で発行しますので、翌月最終営業日までの当社指定口座への振込みをお願いします。振込み手数料は御社負担にてお願いします。
お客様の御支払い条件が60日以上の場合は御相談ください。
尚、初めてのお取引先や個人の場合、前払いをお願いすることもあります。ご了承のほど、お願いします。
データリソース社はどのような会社ですか?
当社は、世界各国の主要調査会社・レポート出版社と提携し、世界各国の市場調査レポートや技術動向レポートなどを日本国内の企業・公官庁及び教育研究機関に提供しております。
世界各国の「市場・技術・法規制などの」実情を調査・収集される時には、データリソース社にご相談ください。
お客様の御要望にあったデータや情報を抽出する為のレポート紹介や調査のアドバイスも致します。
|
|

