抗体医薬コンジュゲート市場レポート:2022-2032
Antibody Drug Conjugates Market Report 2022-2032
レポート詳細
抗体医薬コンジュゲート市場レポート 2022-2032 :本レポートは、新たな収益の柱を目指すリーディングカンパニーが、業界とその背景にあるダイナミクスをより深く理解する上で、非常に有... もっと見る
※上記価格は部署ライセンス(Departmental licence)価格です。
その他の価格についてはデータリソースまでお問合せください。
日本語のページは自動翻訳を利用し作成しています。
実際のレポートは英文のみでご納品いたします。
サマリー
レポート詳細
抗体医薬コンジュゲート市場レポート 2022-2032:本レポートは、新たな収益の柱を目指すリーディングカンパニーが、業界とその背景にあるダイナミクスをより深く理解する上で、非常に有益なものとなるでしょう。また、異業種への進出や新地域での既存事業の拡大を目指す企業にとっても有用なレポートです。
効果的で的を絞った医薬品が注目を集めている
COVID-19パンデミックによってもたらされた世界的な健康上の緊急事態において、効果的で的を絞った医薬品が緊急に求められています。抗体医薬は、従来の低分子医薬に比べて開発が比較的容易であり、SARS-CoV-2コロナウイルスに着目するとワクチンと同等の精度を持つことから、最近注目されている。Protein Data Bankに保存されている3次元構造を持つ7つのSARS-CoV-2抗体についてレビューした(PDB)。また、SARS-CoVのスパイク(S)タンパク質と結合した5つの3次元抗体構造について、SARS-CoV-2を中和する可能性を評価した。これらの抗体のSタンパク質受容体結合ドメイン(RBD)との相互作用は、ACE2を含む複合体とRBDとの相互作用と対比されています。
世界が注目するがん治療用抗体医薬コンジュゲート(ADC)について
この市場は、がん治療用に新たに開発された抗体薬物複合体(ADC)が豊富に存在し、世界中から注目されているため、大きな牽引力を持っています。ADCは、抗体、リンカー、ペイロードの適切な組み合わせを見つけることが非常に難しいにもかかわらず、2021年9月現在、11のADCがFDAの認可を受けており、そのうち8つが2017年に認可されています。2020年には、COVID-19の大流行にもかかわらず、ADC分野で多くの合併や提携が記録され、ビッグファーマがこの治療アプローチに高い関心を抱いていることが示されました。
マーケットリサーチレポートを購入する前に、どのような質問をすべきでしょうか?
- 抗体医薬品コンジュゲート市場はどのように進化しているのか?
- 抗体医薬品コンジュゲート市場の推進要因と抑制要因は何か?
- 各抗体薬結合体サブマーケットセグメントは予測期間中にどのように成長し、これらのサブマーケットが2032年に占める売上はどの程度になるのか?
- 2022年から2032年にかけて、各抗体薬結合体サブマーケットの市場シェアはどのように推移するのでしょうか?
- 2022年から2032年にかけて、市場全体の主なドライバーは何になるのでしょうか?
- 抗体医薬品コンジュゲートの主要市場はマクロ経済のダイナミクスに概ね追随するのか、それとも個々の国内市場が他を凌駕するのか?
- 2032年までに各国市場のシェアはどのように変化し、どの地域が2032年に市場をリードするのでしょうか。
- 主要プレイヤーは誰か、また予測期間中の見通しは?
- これらのリーディング企業の抗体医薬品コンジュゲートプロジェクトはどのようなものですか?
- 2020年から2032年の間に、業界はどのように進化していくのでしょうか?現在および今後10年間に実施される抗体医薬品コンジュゲート・プロジェクトはどのような意味を持つのか?
- 抗体医薬品コンジュゲート市場をさらに拡大するために、製品の商業化の必要性が高まっているのか?
- 抗体医薬品コンジュゲート市場の方向性と、市場の最前線に立つためにはどうすればよいか?
- 新製品やサービスラインに対する最適な投資オプションは何か?
- 企業を新たな成長軌道に乗せ、C-suiteに移行させるための重要な展望とは?
このことが、現在および今後10年間の抗体医薬品コンジュゲート市場にどのような影響を与えるかを知る必要があります。
- 434ページにわたる本レポートは、184の表と242のグラフを掲載しています。
- このレポートでは、業界における主要な収益性の高い分野に焦点を当て、お客様が今すぐターゲットとすることができるようにしています。
- 世界、地域、国別の売上高と成長率の詳細な分析が含まれています。
- 競合他社が成功した主要なトレンド、変化、収益予測をハイライトしています。
本レポートは、抗体医薬品コンジュゲート市場が今後10年間にどのように発展し、COVID-19の景気後退と回復の変動に対応していくかを教えてくれるものです。この市場は、過去10年間のどの時点よりも、今がより重要なのです。
2032年までの予測やその他の分析により、商業的な展望が見えてくる
- 2032年までの収益予測に加え、直近の実績、成長率、市場シェアもご覧いただけます。
- ビジネスの展望や展開など、独自の分析もご覧いただけます。
- 定性的分析(市場力学、促進要因、機会、阻害要因、課題など)、コスト構造、抗体医薬品コンジュゲート価格上昇の影響、最近の動向などをご覧いただけます。
本レポートでは、COVID-19が業界と貴社にどのような影響を与えるかについて、データ分析と貴重な洞察を掲載しています。本レポートでは、COVID-19の4つの回収パターンとその影響、すなわち「V」、「L」、「W」、「U」について論じています。
報告書の対象セグメント
ペイロードタイプ別市場セグメント
- MMAE
- DM4
- カンプトテシン
- DM1
- MMAF
- その他ペイロードタイプ
技術別市場セグメント
- 開裂型リンカー
- 非開裂型リンカー
- その他の技術
リンカータイプ別市場セグメント
- VC
- スルホ-SPDB
- SMCC
- その他リンカータイプ
- VA
- ヒドラゾン
ターゲット抗原別市場セグメント
- CD30
- HER2
- CD22
- CD33
- その他のターゲット抗原
用途別市場区分
- 血液癌
- 乳がん
- 卵巣癌
- 肺がん
- 脳腫瘍
- その他の用途
世界市場全体およびセグメントの収益予測に加え、4地域および20の主要国市場の収益予測も掲載しています。
北米
- アメリカ
- カナダ
欧州
- ドイツ
- ロシア
- イギリス
- フランス
- イタリア
- その他の地域
アジア太平洋地域
- 中国
- 日本
- インド
- オーストラリア
- 韓国
- その他のアジア太平洋地域
南米
- ブラジル
- メキシコ
- その他の南米地域
中東・アフリカ
- サウジアラビア
- 南アフリカ共和国
- UAE
- その他の中東・アフリカ
抗体医薬品コンジュゲート市場の2022年から2032年までの主要企業のプロファイルと、これらの企業の事業のこのセグメントに焦点を当てたものも含まれています。
主要企業と市場成長の可能性
・ AbbVie Inc. Company
・ Astellas Pharma Inc.
・ Bayer AG
・ Celldex Therapeutics, Inc.
・ F. Hoffmann-La Roche Ltd.
・ Genentech, Inc.
・ Gilead Sciences, Inc.
・ ImmunoGen, Inc.
・ Lantheus Holdings, Inc.
・ Lonza Group AG
・ Merck KGaA
・ Mersana Therapeutics Inc.
・ Pfizer Inc.
・ Seagen Inc.
・ Takeda Pharmaceutical Company Limited
抗体医薬品コンジュゲート市場の世界全体の収益、2022年から2032年まで、金額ベースで2022年に41億8200万米ドルを突破すると、当研究所は算出しています。また、2032年まで力強い収益成長が予測されます。本調査では、最も大きな可能性を秘めた企業を特定しました。彼らの能力、進歩、商業的展望を発見することで、一歩先を行くことができます。
抗体医薬コンジュゲート市場、2022年から2032年までのレポートはどのように役立つのでしょうか?
430ページを超えるレポートでは、要約すると以下のような知識を得ることができます。
- 抗体医薬コンジュゲート市場の2032年までの収益予測、ペイロードタイプ、技術、リンカータイプ、標的抗原、用途、企業規模別に、それぞれ世界と地域レベルで予測 - 産業の展望を見出し、投資と収益に最も有利な場所を見つけることができます。
- 4つの地域と20の主要国市場の2032年までの収益予測 - Antibody Drug Conjugates Market, 2022 to 2032の北米、欧州、アジア太平洋、南米、中東&アフリカの市場予測をご覧いただけます。また、米国、カナダ、メキシコ、ブラジル、ドイツ、ロシア、英国、イタリア、中国、インド、日本、オーストラリアなどの主要経済圏の市場も予測されています。
- 抗体医薬品コンジュゲート市場に関与する主要企業15社の企業プロファイルを含む、既存企業および市場参入を目指す企業の展望(2022年から2032年まで)。
定量的・定性的な分析と独自の予測をご覧いただけます。私たちのレポートだけが持つ情報を入手し、貴重なビジネスインテリジェンスを得ることができます。
他にはない情報
私たちの新しいレポートがあれば、知識の遅れを取り戻し、チャンスを逃す可能性が低くなります。私たちの研究が貴社の研究、分析、意思決定にどのように役立つかをご覧ください。Visiongainの研究は、抗体医薬品コンジュゲート市場、2022年から2032年、市場をリードする企業のための商業分析を必要とするすべての人のためのものです。データ、トレンド、予測を見つけることができます。
ページTOPに戻る
目次
目次
1.レポートの概要
1.1 研究の目的
1.2 抗体医薬コンジュゲート市場の紹介
1.3 本レポートが提供するもの
1.4 なぜ本レポートを読むべきなのか
1.5 本分析レポートが回答する重要な質問
1.6 本レポートは誰のためのものか?
1.7 方法論
1.7.1 市場の定義
1.7.2 市場評価・予測手法
1.7.3 データの検証
1.8 よくある質問と回答(FAQ)
1.9 関連するVisiongainレポート
1.10 Visiongainについて
2 エグゼクティブサマリー
2.1 地域別スナップショット。抗体医薬コンジュゲートの世界市場
2.2 技術セグメント市場魅力度指数
2.3 ペイロード・タイプ・セグメント:市場魅力度指標
2.4 標的抗原セグメント市場魅力度指標
2.5 リンカー型セグメント市場魅力度指標
2.6 アプリケーションセグメント市場魅力度指数
3 市場の概要
3.1 主要な調査結果
3.2 ADC市場
3.2.1 FDAが承認した抗体薬物コンジュゲート
3.3 サプライチェーン
3.4 バリューチェーン
3.5 コールドチェーン
3.6 最近の動向・開発状況
3.7 市場ダイナミクス
3.7.1 市場促進要因
3.7.2 市場の抑制要因
3.7.3 市場機会
3.8 COVID-19影響度分析
3.9 ポーターのファイブフォース分析
3.9.1 供給者のバーゲニングパワー(高)
3.9.2 バイヤーの交渉力(中程度)
3.9.3 市場における競合の競争力 (高)
3.9.4 代替品による脅威(低)
3.9.5 新規参入者の脅威(低)
3.10 環境影響度分析
3.10.1 政治的要因
3.10.2 経済的
3.10.3 社会的
3.10.4 技術的
3.10.5 法律的
3.10.6 環境
4 世界の抗体医薬コンジュゲート市場分析
4.1 主要な調査結果
4.2 世界市場の展望
4.3 地域別の成長展望
4.4 抗体医薬コンジュゲートの世界地域別市場シェア、2022年&2032年
4.5 抗体医薬コンジュゲートの世界市場シェア予測
4.5.1 COVID-19前の市場シナリオ
4.5.2 ポストCOVID-19市場シナリオ(V、W、U、L字回復分析)
4.6 世界の医薬品受託販売市場の地域別規模推定・予測
4.6.1 COVID-19前の市場シナリオ
4.6.2 ポストCOVID-19市場シナリオ(V、W、U、L字回復分析)
5 世界の抗体医薬コンジュゲート市場分析:技術別
5.1 主な調査結果
5.2 世界の技術市場の展望
5.3 世界の抗体薬物複合体の技術別市場魅力度指数
5.4 地域別市場規模の推定と予測
5.5 クリベイラブルリンカー
5.5.1 クリーバブルリンカーの世界市場予測
5.5.2 クリーバブルリンカーの世界市場予測:地域別
5.6 ノンクリーバブルリンカー
5.6.1 ノンクレバブルリンカーの世界市場予測
5.6.2 ノンクレバブルリンカーの世界市場予測:地域別
5.7 その他の技術
5.7.1 その他の技術の世界市場展望
5.7.2 その他の技術の世界市場展望:地域別
6 世界の抗体医薬コンジュゲート市場分析:ペイロードタイプ別
6.1 主要な調査結果
6.2 ペイロード・タイプの世界市場展望
6.3 抗体医薬コンジュゲートのペイロードタイプ別世界市場魅力度指数
6.4 抗体医薬コンジュゲートのペイロードタイプ別世界市場
6.5 MMAE
6.5.1 MMAEの世界市場展望
6.5.2 MMAEの世界市場予測:地域別
6.6 DM4
6.6.1 DM4の世界市場展望
6.6.2 DM4の世界市場予測:地域別
6.7 カンプトテシン
6.7.1 カンプトテシンの世界市場展望
6.7.2 カンプトテシンの世界市場予測:地域別
6.8 DM1
6.8.1 DM1の世界市場
6.8.2 DM1の世界市場予測:地域別
6.9 MMAF
6.9.1 MMAFの世界市場予測
6.9.2 MMAFの世界市場予測:地域別
6.10 その他のペイロードタイプ
6.10.1 その他のペイロードタイプの世界市場展望
6.10.2 その他のペイロードタイプの世界市場予測:地域別
7 世界の体抗医薬コンジュゲート市場分析:ターゲット抗原別
7.1 主な調査結果
7.2 ターゲット抗原の世界市場の展望
7.3 抗体医薬コンジュゲートのターゲット抗原別世界市場魅力度指数
7.4 抗体医薬コンジュゲートの世界市場:ターゲット抗原別
7.5 CD30
7.5.1 CD30の世界市場展望
7.5.2 CD30の世界市場予測:地域別
7.6 HER2
7.6.1 HER2の世界市場展望
7.6.2 世界のHER2市場予測:地域別
7.7 CD22
7.7.1 CD22の世界市場展望
7.7.2 CD22の世界市場予測:地域別
7.8 CD33
7.8.1 CD33の世界市場展望
7.8.2 CD33の世界市場予測:地域別
7.9 その他の標的抗原
7.9.1 その他の標的抗原の世界市場展望
7.9.2 その他の標的抗原の世界市場予測:地域別
8 世界の体抗医薬コンジュゲート市場分析:リンカタイプ
8.1 主な調査結果
8.2 リンカー型の世界市場展望
8.3 リンカー型別抗体医薬コンジュゲートの世界市場魅力度指数
8.4 リンカータイプ別抗体薬物複合体の世界市場
8.5 VC
8.5.1 VCの世界市場展望
8.5.2 VCの世界地域別市場展望
8.6 Sulfo-SPDB
8.6.1 Sulfo-SPDBの世界市場展望
8.6.2 Sulfo-SPDBの世界地域別市場展望
8.7 SMCCの市場
8.7.1 SMCCの世界市場展望
8.7.2 SMCCの世界地域別市場展望
8.8 VA
8.8.1 VA の世界市場展望
8.8.2 世界のVA地域別市場
8.9 ヒドラゾン
8.9.1 ヒドラゾンの世界市場展望
8.9.2 ヒドラゾーンの世界市場予測:地域別
8.10 その他のリンカータイプ
8.10.1 その他のリンカータイプの世界市場予測
8.10.2 その他のリンカータイプの世界地域別市場展望
9 世界の体抗医薬コンジュゲート市場分析:用途別
9.1 主な調査結果
9.2 世界の用途市場の展望
9.3 世界の抗体医薬コンジュゲートの用途別市場魅力度指数
9.4 抗体医薬コンジュゲートの用途別世界市場
9.5 血液がん
9.5.1 血液癌の世界市場展望
9.5.2 血液がんの世界市場:地域別
9.6 乳がん
9.6.1 乳癌の世界市場展望
9.6.2 乳癌の世界市場:地域別
9.7 卵巣癌
9.7.1 卵巣癌の世界市場展望
9.7.2 卵巣癌の世界市場予測:地域別
9.8 肺がん
9.8.1 肺癌の世界市場展望
9.8.2 肺癌の世界市場予測:地域別
9.9 脳腫瘍
9.9.1 脳腫瘍の世界市場予測
9.9.2 脳腫瘍の世界市場予測:地域別
9.10 その他の用途
9.10.1 その他の用途の世界市場展望
9.10.2 その他の用途の世界市場:地域別
10 北米の抗抗体医薬コンジュゲート市場分析
10.1 主な調査結果
10.2 抗体医薬の世界市場は北米が支配的
10.3 北米抗体医薬品コンジュゲート市場魅力度指数
10.4 北米抗体医薬コンジュゲート市場規模推定・予測:金額別
10.5 北米抗体医薬コンジュゲート市場規模予測・国別予測
10.6 北米抗体医薬コンジュゲート市場の技術別市場規模予測・予想
10.7 北米抗体薬物コンジュゲート市場のペイロードタイプ別市場規模予測・予想
10.8 北米抗体薬物コンジュゲート市場規模予測・予測:標的抗原別
10.9 北米抗体薬物コンジュゲート市場規模予測・予測:リンカー種類別
10.10 北米抗体薬物コンジュゲート市場規模予測・用途別予測
10.11 米国
10.11.1 米国の抗体医薬コンジュゲート市場:金額別
10.12 カナダ
10.12.1 カナダ 抗体医薬コンジュゲート市場:金額別
11 欧州の抗体医薬コンジュゲート市場分析
11.1 主な調査結果
11.2 欧州抗体薬物複合体市場の魅力度指数
11.3 欧州の抗体薬物複合体の市場規模予測・予想:金額別
11.4 欧州の抗体薬物コンジュゲート市場の国別市場規模予測・予想
11.5 欧州の抗体医薬コンジュゲートの市場規模予測・技術別予測
11.6 欧州の抗体薬物コンジュゲート市場のペイロードタイプ別市場規模予測・予想
11.7 欧州の抗体薬物コンジュゲートの市場規模予測・予測:標的抗原別
11.8 欧州の抗体薬物コンジュゲート市場規模予測・予測:リンカータイプ別
11.9 欧州の抗体薬物コンジュゲートの市場規模予測・用途別予測
11.10 ドイツ
11.10.1 ドイツ抗体薬コンジュゲート市場:金額別
11.11 イギリス
11.11.1 イギリス 抗体医薬コンジュゲート市場:金額別
11.12 フランス
11.12.1 フランス 抗体医薬コンジュゲート市場:金額別
11.13 イタリア
11.13.1 イタリア 抗体医薬コンジュゲート市場:金額別
11.14 ロシア
11.14.1 ロシアの抗体薬物コンジュゲート市場:金額別
11.15 ヨーロッパのその他の地域
11.15.1 抗体医薬コンジュゲートの欧州市場:金額別
12 アジア太平洋地域の抗体医薬コンジュゲート市場分析
12.1 主な調査結果
12.2 アジア太平洋地域の抗体医薬コンジュゲート市場の魅力度指数
12.3 アジア太平洋地域の抗体医薬コンジュゲート市場規模予測・予想:金額別
12.4 アジア太平洋地域の抗体医薬コンジュゲート市場の国別市場規模予測・予想
12.5 アジア太平洋地域の抗体医薬コンジュゲート市場の技術別市場規模予測・予想
12.6 アジア太平洋地域の抗体薬物コンジュゲート市場のペイロードタイプ別市場規模予測・予想
12.7 アジア太平洋地域の抗体薬物コンジュゲート市場規模予測・予測:標的抗原別
12.8 アジア太平洋地域の抗体薬物コンジュゲート市場のリンカータイプ別市場規模予測・予想
12.9 アジア太平洋地域の抗体薬物コンジュゲート市場の用途別市場規模予測・予測
12.10 中国
12.10.1 中国抗体薬コンジュゲート市場:金額別
12.11 インド
12.11.1 インド抗体薬コンジュゲート市場:金額別
12.12 日本
12.12.1 抗体医薬コンジュゲート日本市場:金額別
12.13 韓国
12.13.1 韓国の抗体薬物コンジュゲート市場:金額別
12.14 オーストラリア
12.14.1 オーストラリアの抗体薬物コンジュゲート市場:金額別
12.15 アジア太平洋地域のその他の地域
12.15.1 アジア太平洋地域の抗体医薬コンジュゲート市場(金額別
13 中東・アフリカの抗体医薬コンジュゲート市場分析
13.1 主な調査結果
13.2 中東・アフリカ抗体医薬品コンジュゲート市場魅力度指数
13.3 中東・アフリカ抗体薬物複合体の市場規模推定・予測:金額別
13.4 中東・アフリカ抗体医薬コンジュゲート市場規模予測・国別予測
13.5 中東・アフリカ 抗体医薬コンジュゲート市場の技術別市場規模予測・予想
13.6 中東・アフリカ抗体薬物複合体のペイロードタイプ別市場規模予測・予想
13.7 中東・アフリカ抗体薬物コンジュゲート市場規模予測・予測:標的抗原別
13.8 中東・アフリカ抗体薬物複合体の市場規模予測・予測:リンカー種類別
13.9 中東・アフリカ抗体薬物コンジュゲート市場規模予測・用途別予測
13.10 南アフリカ
13.10.1 南アフリカの抗体医薬コンジュゲート市場:金額別
13.11 サウジアラビア
13.11.1 サウジアラビアの抗体医薬コンジュゲート市場:金額別
13.12 U.A.E.
13.12.1 アラブ首長国連邦 抗体医薬コンジュゲート市場:金額別
13.13 中東・アフリカ
13.13.1 その他の中東・アフリカ地域の抗体医薬コンジュゲート市場:金額別
14 南米の抗体薬物複合体の市場分析
14.1 主な調査結果
14.2 南米の抗体医薬コンジュゲート市場の魅力度指数
14.3 南米の抗体医薬コンジュゲート市場規模予測・予想」金額別
14.4 南米の抗体医薬コンジュゲート市場の国別市場規模予測・予想
14.5 南米の抗体医薬コンジュゲート市場規模予測・技術別予測
14.6 南米の抗体薬物コンジュゲート市場のペイロードタイプ別市場規模予測・予想
14.7 南米の抗体薬物コンジュゲートの市場規模予測・予測:標的抗原別
14.8 南米の抗体薬物コンジュゲート市場のリンカータイプ別サイズ推定・予測
14.9 南米の抗体薬物コンジュゲート市場規模予測・用途別予測
14.10 ブラジル
14.10.1 ブラジル抗体薬物コンジュゲート市場:金額別
14.11 メキシコ
14.11.1 メキシコ抗体薬コンジュゲート市場:金額別
14.12 南米の残りの地域
14.12.1 南米その他の地域 抗体薬剤コンジュゲート市場:金額別
15 競合他社の状況
15.1 企業シェア分析
15.2 主要事業戦略分析-買収
15.3 主要事業戦略分析-契約
15.4 主要事業戦略分析-協業
15.5 主要な事業戦略分析-開発
15.6 主要事業戦略分析-拡大
15.7 主要事業戦略分析-投資
15.8 主要事業戦略分析-合併
15.9 主要事業戦略分析-新製品上市
15.10 主要事業戦略分析-パートナーシップ
16 主要企業のプロフィール
16.1 Abbvie Inc. Company
16.1.1 会社概要
16.1.2 会社概要
16.1.3 財務分析
16.1.4 製品ベンチマーク
16.1.5 戦略的展望
16.2 Astellas Pharma Inc.
16.2.1 企業スナップショット
16.2.2 会社概要
16.2.3 財務分析
16.2.4 製品ベンチマーク
16.2.5 戦略的展望
16.3 Bayer AG
16.3.1 企業スナップショット
16.3.2 会社概要
16.3.3 財務分析
16.3.4 製品ベンチマーク
16.3.5 戦略的展望
16.4 Celldex Therapeutics, Inc.
16.4.1 企業スナップショット
16.4.2 会社概要
16.4.3 財務分析
16.4.4 製品ベンチマーク
16.4.5 戦略的展望
16.5 Genentech, Inc.
16.5.1 企業スナップショット
16.5.2 会社概要
16.5.3 ベンチマーキング
16.5.4 戦略的展望
16.6 ImmunoGen, Inc.
16.6.1 企業スナップショット
16.6.2 会社概要
16.6.3 財務分析
16.6.4 製品ベンチマーク
16.6.5 戦略的展望
16.7 Gilead Sciences, Inc.
16.7.1 企業スナップショット
16.7.2 会社概要
16.7.3 財務分析
16.7.4 製品ベンチマーク
16.7.5 戦略的展望
16.8 Lonza Group AG
16.8.1 企業スナップショット
16.8.2 会社概要
16.8.3 財務分析
16.8.4 製品ベンチマーク
16.8.5 戦略的展望
16.9 Mersana Therapeutics Inc.
16.9.1 企業スナップショット
16.9.2 会社概要
16.9.3 財務分析
16.9.4 製品ベンチマーク
16.9.5 戦略的展望
16.10 Takeda Pharmaceutical Company Limited
16.10.1 会社概要
16.10.2 会社概要
16.10.3 財務分析
16.10.4 製品ベンチマーク
16.10.5 戦略的展望
16.11 Pfizer Inc.
16.11.1 企業スナップショット
16.11.2 会社概要
16.11.3 財務分析
16.11.4 製品ベンチマーク
16.11.5 戦略的な展望
16.12 F. Hoffmann-La Roche Ltd
16.12.1 企業スナップショット
16.12.2 会社概要
16.12.3 財務分析
16.12.4 製品ベンチマーク
16.12.5 戦略的展望
16.13 Lantheus Holdings, Inc.
16.13.1 企業スナップショット
16.13.2 会社概要
16.13.3 財務分析
16.13.4 製品ベンチマーク
16.13.5 戦略的な展望
16.14 Seagen Inc.
16.14.1 企業スナップショット
16.14.2 会社概要
16.14.3 財務分析
16.14.4 製品ベンチマーク
16.14.5 戦略的展望
16.15 Merck KGaA
16.15.1 企業スナップショット
16.15.2 会社概要
16.15.3 財務分析
16.15.4 製品ベンチマーク
16.15.5 戦略的展望
17 結論と提言
17.1 ヴィジョンゲインからの結論
17.2 市場関係者への提言
表の一覧
Table 1 Global Antibody Drug Conjugates Market Snapshot, 2022 & 2032 (US$ million, CAGR %)
Table 2 Global Antibody Drug Conjugate Approved Drugs, 2022-2032 (US$ Mn, AGR (%), CAGR (%))
Table 3 Global Antibody Drug Conjugates Market by Region, 2022-2032 (US$ Mn, AGR (%), CAGR (%)) (V-Shaped Recovery Scenario)
Table 4 Global Antibody Drug Conjugates Market by Region, 2022-2032 (US$ Mn, AGR (%), CAGR (%)) (U-Shaped Recovery Scenario)
Table 5 Global Antibody Drug Conjugates Market by Region, 2022-2032 (US$ Mn, AGR (%), CAGR (%)) (W-Shaped Recovery Scenario)
Table 6 Global Antibody Drug Conjugates Market by Region, 2022-2032 (US$ Mn, AGR (%), CAGR (%)) (L-Shaped Recovery Scenario)
Table 7 Summary of Antibody–Drug Conjugates Approved For Market Worldwide For Clinical Use, 2021
Table 8 Global Antibody Drug Conjugates Market Forecast, 2022-2032 (US$ Mn, AGR (%), CAGR (%))
Table 9 Global Antibody Drug Conjugates Market Forecast, 2022-2032 (US$ Mn, AGR (%), CAGR (%)) (V-Shaped Recovery Scenario)
Table 10 Global Antibody Drug Conjugates Market Forecast, 2022-2032 (US$ Mn, AGR (%), CAGR (%)) (W-Shaped Recovery Scenario)
Table 11 Global Antibody Drug Conjugates Market Forecast, 2022-2032 (US$ Mn, AGR (%), CAGR (%)) (U-Shaped Recovery Scenario)
Table 12 Global Antibody Drug Conjugates Market Forecast, 2022-2032 (US$ Mn, AGR (%), CAGR (%)) (L-Shaped Recovery Scenario)
Table 13 Global Antibody Drug Conjugates Market by Region, 2022-2032 (US$ Mn, AGR (%), CAGR (%))
Table 14 Global Antibody Drug Conjugates Market by Region, 2022-2032 (US$ Mn, AGR (%), CAGR (%)) (V-Shaped Recovery Scenario)
Table 15 Global Antibody Drug Conjugates Market by Region, 2022-2032 (US$ Mn, AGR (%), CAGR (%)) (W-Shaped Recovery Scenario)
Table 16 Global Antibody Drug Conjugates Market by Region, 2022-2032 (US$ Mn, AGR (%), CAGR (%)) (U-Shaped Recovery Scenario)
Table 17 Global Antibody Drug Conjugates Market by Region, 2022-2032 (US$ Mn, AGR (%), CAGR (%)) (L-Shaped Recovery Scenario)
Table 18 Global Antibody Drug Conjugates Market by Technology, 2022-2032 (US$ Mn, AGR (%), CAGR (%))
Table 19 Global Cleavable Linkers Market Forecast, 2022-2032 (US$ Mn, AGR (%), CAGR (%))
Table 20 Global Cleavable Linkers Market by Region, 2022-2032 (US$ Mn, AGR (%), CAGR (%))
Table 21 Global Non-Cleavable Linkers Market Forecast, 2022-2032 (US$ Mn, AGR (%), CAGR (%))
Table 22 Global Non-Cleavable Linkers Market by Region, 2022-2032 (US$ Mn, AGR (%), CAGR (%))
Table 23 Global Other Technology Market Forecast, 2022-2032 (US$ Mn, AGR (%), CAGR (%))
Table 24 Global Other Technology Market by Region, 2022-2032 (US$ Mn, AGR (%), CAGR (%))
Table 25 Global Antibody Drug Conjugates Market by Payload Type, 2022-2032 (US$ Mn, AGR (%), CAGR (%))
Table 26 Global MMAE Market Forecast, 2022-2032 (US$ Mn, AGR (%), CAGR (%))
Table 27 Global MMAE Market by Region, 2022-2032 (US$ Mn, AGR (%), CAGR (%))
Table 28 Global DM4 Market Forecast, 2022-2032 (US$ Mn, AGR (%), CAGR (%))
Table 29 Global DM4 Market by Region, 2022-2032 (US$ Mn, AGR (%), CAGR (%))
Table 30 Global Camptothecin Market Forecast, 2022-2032 (US$ Mn, AGR (%), CAGR (%))
Table 31 Global Camptothecin Market by Region, 2022-2032 (US$ Mn, AGR (%), CAGR (%))
Table 32 Global DM1 Market Forecast, 2022-2032 (US$ Mn, AGR (%), CAGR (%))
Table 33 Global DM1 Market by Region, 2022-2032 (US$ Mn, AGR (%), CAGR (%))
Table 34 Global MMAF Market Forecast, 2022-2032 (US$ Mn, AGR (%), CAGR (%))
Table 35 Global MMAF Market by Region, 2022-2032 (US$ Mn, AGR (%), CAGR (%))
Table 36 Global Other Payload Type Market Forecast, 2022-2032 (US$ Mn, AGR (%), CAGR (%))
Table 37 Global Other Payload Type Market by Region, 2022-2032 (US$ Mn, AGR (%), CAGR (%))
Table 38 Global Antibody Drug Conjugates Market by Target Antigen, 2022-2032 (US$ Mn, AGR (%), CAGR (%))
Table 39 Global CD30 Market Forecast, 2022-2032 (US$ Mn, AGR (%), CAGR (%))
Table 40 Global CD30 Market by Region, 2022-2032 (US$ Mn, AGR (%), CAGR (%))
Table 41 Global HER2 Market Forecast, 2022-2032 (US$ Mn, AGR (%), CAGR (%))
Table 42 Global HER2 Market by Region, 2022-2032 (US$ Mn, AGR (%), CAGR (%))
Table 43 Global CD22 Market Forecast, 2022-2032 (US$ Mn, AGR (%), CAGR (%))
Table 44 Global CD22 Market by Region, 2022-2032 (US$ Mn, AGR (%), CAGR (%))
Table 45 Global CD33 Market Forecast, 2022-2032 (US$ Mn, AGR (%), CAGR (%))
Table 46 Global CD33 Market by Region, 2022-2032 (US$ Mn, AGR (%), CAGR (%))
Table 47 Global Other Target Antigen Market Forecast, 2022-2032 (US$ Mn, AGR (%), CAGR (%))
Table 48 Global Other Target Antigen Market by Region, 2022-2032 (US$ Mn, AGR (%), CAGR (%))
Table 49 Global Antibody Drug Conjugates Market by Linker Type, 2022-2032 (US$ Mn, AGR (%), CAGR (%))
Table 50 Global VC Market Forecast, 2022-2032 (US$ Mn, AGR (%), CAGR (%))
Table 51 Global VC Market by Region, 2022-2032 (US$ Mn, AGR (%), CAGR (%))
Table 52 Global Sulfo-SPDB Market Forecast, 2022-2032 (US$ Mn, AGR (%), CAGR (%))
Table 53 Global Sulfo-SPDB Market by Region, 2022-2032 (US$ Mn, AGR (%), CAGR (%))
Table 54 Global SMCC Market Forecast, 2022-2032 (US$ Mn, AGR (%), CAGR (%))
Table 55 Global SMCC Market by Region, 2022-2032 (US$ Mn, AGR (%), CAGR (%))
Table 56 Global VA Market Forecast, 2022-2032 (US$ Mn, AGR (%), CAGR (%))
Table 57 Global VA Market by Region, 2022-2032 (US$ Mn, AGR (%), CAGR (%))
Table 58 Global Hydrazone Market Forecast, 2022-2032 (US$ Mn, AGR (%), CAGR (%))
Table 59 Global Hydrazone Market by Region, 2022-2032 (US$ Mn, AGR (%), CAGR (%))
Table 60 Global Other Linker Type Market Forecast, 2022-2032 (US$ Mn, AGR (%), CAGR (%))
Table 61 Global Other Linker Type Market by Region, 2022-2032 (US$ Mn, AGR (%), CAGR (%))
Table 62 Global Antibody Drug Conjugates Market by Application, 2022-2032 (US$ Mn, AGR (%), CAGR (%))
Table 63 Global Blood Cancer Market Forecast, 2022-2032 (US$ Mn, AGR (%), CAGR (%))
Table 64 Global Blood Cancer Market by Region, 2022-2032 (US$ Mn, AGR (%), CAGR (%))
Table 65 Global Breast Cancer Market Forecast, 2022-2032 (US$ Mn, AGR (%), CAGR (%))
Table 66 Global Breast Cancer Market by Region, 2022-2032 (US$ Mn, AGR (%), CAGR (%))
Table 67 Global Ovarian Cancer Market Forecast, 2022-2032 (US$ Mn, AGR (%), CAGR (%))
Table 68 Global Ovarian Cancer Market by Region, 2022-2032 (US$ Mn, AGR (%), CAGR (%))
Table 69 Global Lung Cancer Market Forecast, 2022-2032 (US$ Mn, AGR (%), CAGR (%))
Table 70 Global Lung Cancer Market by Region, 2022-2032 (US$ Mn, AGR (%), CAGR (%))
Table 71 Global Brain Tumor Market Forecast, 2022-2032 (US$ Mn, AGR (%), CAGR (%))
Table 72 Global Brain Tumor Market by Region, 2022-2032 (US$ Mn, AGR (%), CAGR (%))
Table 73 Global Other Application Market Forecast, 2022-2032 (US$ Mn, AGR (%), CAGR (%))
Table 74 Global Other Application Market by Region, 2022-2032 (US$ Mn, AGR (%), CAGR (%))
Table 75 North America Antibody Drug Conjugates Market by Value, 2022-2032 (US$ Mn, AGR (%), CAGR (%))
Table 76 North America Antibody Drug Conjugates Market by Country, 2022-2032 (US$ Mn, AGR (%), CAGR (%))
Table 77 North America Antibody Drug Conjugates Market by Technology, 2022-2032 (US$ Mn, AGR (%), CAGR (%))
Table 78 North America Antibody Drug Conjugates Market by Payload Type, 2022-2032 (US$ Mn, AGR (%), CAGR (%))
Table 79 North America Antibody Drug Conjugates Market by Target Antigen, 2022-2032 (US$ Mn, AGR (%), CAGR (%))
Table 80 North America Antibody Drug Conjugates Market by Linker Type, 2022-2032 (US$ Mn, AGR (%), CAGR (%))
Table 81 North America Antibody Drug Conjugates Market by Application, 2022-2032 (US$ Mn, AGR (%), CAGR (%))
Table 82 US Antibody Drug Conjugates Market by Value, 2022-2032 (US$ Mn, AGR (%), CAGR (%))
Table 83 Canada Antibody Drug Conjugates Market by Value, 2022-2032 (US$ Mn, AGR (%), CAGR (%))
Table 84 Europe Antibody Drug Conjugates Market by Value, 2022-2032 (US$ Mn, AGR (%), CAGR (%))
Table 85 Europe Antibody Drug Conjugates Market by Country, 2022-2032 (US$ Mn, AGR (%), CAGR (%))
Table 86 Europe Antibody Drug Conjugates Market by Technology, 2022-2032 (US$ Mn, AGR (%), CAGR (%))
Table 87 Europe Antibody Drug Conjugates Market by Payload Type, 2022-2032 (US$ Mn, AGR (%), CAGR (%))
Table 88 Europe Antibody Drug Conjugates Market by Target Antigen, 2022-2032 (US$ Mn, AGR (%), CAGR (%))
Table 89 Europe Antibody Drug Conjugates Market by Linker Type, 2022-2032 (US$ Mn, AGR (%), CAGR (%))
Table 90 Europe Antibody Drug Conjugates Market by Application, 2022-2032 (US$ Mn, AGR (%), CAGR (%))
Table 91 Germany Antibody Drug Conjugates Market by Value, 2022-2032 (US$ Mn, AGR (%), CAGR (%))
Table 92 UK Antibody Drug Conjugates Market by Value, 2022-2032 (US$ Mn, AGR (%), CAGR (%))
Table 93 France Antibody Drug Conjugates Market by Value, 2022-2032 (US$ Mn, AGR (%), CAGR (%))
Table 94 Italy Antibody Drug Conjugates Market by Value, 2022-2032 (US$ Mn, AGR (%), CAGR (%))
Table 95 Russia Antibody Drug Conjugates Market by Value, 2022-2032 (US$ Mn, AGR (%), CAGR (%))
Table 96 Rest of Europe Antibody Drug Conjugates Market by Value, 2022-2032 (US$ Mn, AGR (%), CAGR (%))
Table 97 Asia-Pacific Antibody Drug Conjugates Market by Value, 2022-2032 (US$ Mn, AGR (%), CAGR (%))
Table 98 Asia-Pacific Antibody Drug Conjugates Market by Country, 2022-2032 (US$ Mn, AGR (%), CAGR (%))
Table 99 Asia-Pacific Antibody Drug Conjugates Market by Technology, 2022-2032 (US$ Mn, AGR (%), CAGR (%))
Table 100 Asia-Pacific Antibody Drug Conjugates Market by Payload Type, 2022-2032 (US$ Mn, AGR (%), CAGR (%))
Table 101 Asia-Pacific Antibody Drug Conjugates Market by Target Antigen, 2022-2032 (US$ Mn, AGR (%), CAGR (%))
Table 102 Asia-Pacific Antibody Drug Conjugates Market by Linker Type, 2022-2032 (US$ Mn, AGR (%), CAGR (%))
Table 103 Asia-Pacific Antibody Drug Conjugates Market by Application, 2022-2032 (US$ Mn, AGR (%), CAGR (%))
Table 104 China Antibody Drug Conjugates Market by Value, 2022-2032 (US$ Mn, AGR (%), CAGR (%))
Table 105 India Antibody Drug Conjugates Market by Value, 2022-2032 (US$ Mn, AGR (%), CAGR (%))
Table 106 Japan Antibody Drug Conjugates Market by Value, 2022-2032 (US$ Mn, AGR (%), CAGR (%))
Table 107 South Korea Antibody Drug Conjugates Market by Value, 2022-2032 (US$ Mn, AGR (%), CAGR (%))
Table 108 Australia Antibody Drug Conjugates Market by Value, 2022-2032 (US$ Mn, AGR (%), CAGR (%))
Table 109 Rest of Asia-Pacific Antibody Drug Conjugates Market by Value, 2022-2032 (US$ Mn, AGR (%), CAGR (%))
Table 110 Middle East & Africa Antibody Drug Conjugates Market by Value, 2022-2032 (US$ Mn, AGR (%), CAGR (%))
Table 111 Middle East & Africa Antibody Drug Conjugates Market by Country, 2022-2032 (US$ Mn, AGR (%), CAGR (%))
Table 112 Middle East & Africa Antibody Drug Conjugates Market by Technology, 2022-2032 (US$ Mn, AGR (%), CAGR (%))
Table 113 Middle East & Africa Antibody Drug Conjugates Market by Payload Type, 2022-2032 (US$ Mn, AGR (%), CAGR (%))
Table 114 Middle East & Africa Antibody Drug Conjugates Market by Target Antigen, 2022-2032 (US$ Mn, AGR (%), CAGR (%))
Table 115 Middle East & Africa Antibody Drug Conjugates Market by Linker Type, 2022-2032 (US$ Mn, AGR (%), CAGR (%))
Table 116 Middle East & Africa Antibody Drug Conjugates Market by Application, 2022-2032 (US$ Mn, AGR (%), CAGR (%))
Table 117 South Africa Antibody Drug Conjugates Market by Value, 2022-2032 (US$ Mn, AGR (%), CAGR (%))
Table 118 Saudi Arabia Antibody Drug Conjugates Market by Value, 2022-2032 (US$ Mn, AGR (%), CAGR (%))
Table 119 UAE Antibody Drug Conjugates Market by Value, 2022-2032 (US$ Mn, AGR (%), CAGR (%))
Table 120 Rest of Middle East & Africa Antibody Drug Conjugates Market by Value, 2022-2032 (US$ Mn, AGR (%), CAGR (%))
Table 121 South America Antibody Drug Conjugates Market by Value, 2022-2032 (US$ Mn, AGR (%), CAGR (%))
Table 122 South America Antibody Drug Conjugates Market by Country, 2022-2032 (US$ Mn, AGR (%), CAGR (%))
Table 123 South America Antibody Drug Conjugates Market by Technology, 2022-2032 (US$ Mn, AGR (%), CAGR (%))
Table 124 South America Antibody Drug Conjugates Market by Payload Type, 2022-2032 (US$ Mn, AGR (%), CAGR (%))
Table 125 South America Antibody Drug Conjugates Market by Target Antigen, 2022-2032 (US$ Mn, AGR (%), CAGR (%))
Table 126 South America Antibody Drug Conjugates Market by Linker Type, 2022-2032 (US$ Mn, AGR (%), CAGR (%))
Table 127 South America Antibody Drug Conjugates Market by Application, 2022-2032 (US$ Mn, AGR (%), CAGR (%))
Table 128 Brazil Antibody Drug Conjugates Market by Value, 2022-2032 (US$ Mn, AGR (%), CAGR (%))
Table 129 Mexico Antibody Drug Conjugates Market by Value, 2022-2032 (US$ Mn, AGR (%), CAGR (%))
Table 130 Rest of South America Antibody Drug Conjugates Market by Value, 2022-2032 (US$ Mn, AGR (%), CAGR (%))
Table 131 Key Business Strategies Adopted by Key Players in Global Antibody Drug Conjugates Market
Table 132 Key Business Strategies Adopted by Key Players in Global Antibody Drug Conjugates Market
Table 133 Key Business Strategies Adopted by Key Players in Global Antibody Drug Conjugates Market
Table 134 Key Business Strategies Adopted by Key Players in Global Antibody Drug Conjugates Market
Table 135 Key Business Strategies Adopted by Key Players in Global Antibody Drug Conjugates Market
Table 136 Key Business Strategies Adopted by Key Players in Global Antibody Drug Conjugates Market
Table 137 Key Business Strategies Adopted by Key Players in Global Antibody Drug Conjugates Market
Table 138 Key Business Strategies Adopted by Key Players in Global Antibody Drug Conjugates Market
Table 139 Key Business Strategies Adopted by Key Players in Global Antibody Drug Conjugates Market
Table 140 Abbvie Inc. Company: Key Details, (CEO, HQ, Revenue, Founded, No. of Employees, Company Type, Website, Business Segment)
Table 141 Abbvie Inc. Company: Product Benchmarking
Table 142 Abbvie Inc. Company: Strategic Outlook
Table 143 Astellas Pharma Inc.: Key Details, (CEO, HQ, Revenue, Founded, No. of Employees, Company Type, Website, Business Segment)
Table 144 Astellas Pharma Inc.: Product Benchmarking
Table 145 Astellas Pharma Inc.: Strategic Outlook
Table 146 Bayer AG: Key Details, (CEO, HQ, Revenue, Founded, No. of Employees, Company Type, Website, Business Segment)
Table 147 Bayer AG: Product Benchmarking
Table 148 Bayer AG: Strategic Outlook
Table 149 Celldex Therapeutics, Inc.: Key Details, (CEO, HQ, Revenue, Founded, No. of Employees, Company Type, Website, Business Segment)
Table 150 Celldex Therapeutics, Inc.: Product Benchmarking
Table 151 Celldex Therapeutics, Inc.: Strategic Outlook
Table 152 Genentech, Inc.: Key Details, (CEO, HQ, Revenue, Founded, No. of Employees, Company Type, Website, Business Segment)
Table 153 Genentech, Inc.: Product Benchmarking
Table 154 Genentech, Inc.: Strategic Outlook
Table 155 ImmunoGen, Inc.: Key Details, (CEO, HQ, Revenue, Founded, No. of Employees, Company Type, Website, Business Segment)
Table 156 ImmunoGen, Inc.: Product Benchmarking
Table 157 ImmunoGen, Inc.: Strategic Outlook
Table 158 Gilead Sciences, Inc.: Key Details, (CEO, HQ, Revenue, Founded, No. of Employees, Company Type, Website, Business Segment)
Table 159 Gilead Sciences, Inc.: Product Benchmarking
Table 160 Gilead Sciences, Inc.: Strategic Outlook
Table 161 Lonza Group AG: Key Details, (CEO, HQ, Revenue, Founded, No. of Employees, Company Type, Website, Business Segment)
Table 162 Lonza Group AG: Product Benchmarking
Table 163 Lonza Group AG: Strategic Outlook
Table 164 Mersana Therapeutics Inc.: Key Details, (CEO, HQ, Revenue, Founded, No. of Employees, Company Type, Website, Business Segment)
Table 165 Mersana Therapeutics Inc.: Product Benchmarking
Table 166 Mersana Therapeutics Inc.: Strategic Outlook
Table 167 Takeda Pharmaceutical Company Limited: Key Details, (CEO, HQ, Revenue, Founded, No. of Employees, Company Type, Website, Business Segment)
Table 168 Takeda Pharmaceutical Company Limited: Product Benchmarking
Table 169 Takeda Pharmaceutical Company Limited: Strategic Outlook
Table 170 Pfizer Inc.: Key Details, (CEO, HQ, Revenue, Founded, No. of Employees, Company Type, Website, Business Segment)
Table 171 Pfizer Inc.: Product Benchmarking
Table 172 Pfizer Inc.: Strategic Outlook
Table 173 F. Hoffmann-La Roche Ltd: Key Details, (CEO, HQ, Revenue, Founded, No. of Employees, Company Type, Website, Business Segment)
Table 174 F. Hoffmann-La Roche Ltd: Product Benchmarking
Table 175 F. Hoffmann-La Roche Ltd: Strategic Outlook
Table 176 Lantheus Holdings, Inc.: Key Details, (CEO, HQ, Revenue, Founded, No. of Employees, Company Type, Website, Business Segment)
Table 177 Lantheus Holdings, Inc.: Product Benchmarking
Table 178 Lantheus Holdings, Inc.: Strategic Outlook
Table 179 Seagen Inc.: Key Details, (CEO, HQ, Revenue, Founded, No. of Employees, Company Type, Website, Business Segment)
Table 180 Seagen Inc.: Product Benchmarking
Table 181 Seagen Inc.: Strategic Outlook
Table 182 Merck KGaA: Key Details, (CEO, HQ, Revenue, Founded, No. of Employees, Company Type, Website, Business Segment)
Table 183 Merck KGaA: Product Benchmarking
Table 184 Merck KGaA: Strategic Outlook
図の一覧
Figure 1 Global Antibody Drug Conjugates Market Segmentation
Figure 2 Global Antibody Drug Conjugates Market Forecast by Region: Market Attractiveness Index
Figure 3 Global Antibody Drug Conjugates Market by Technology: Market Attractiveness Index
Figure 4 Global Antibody Drug Conjugates Market by Payload Type: Market Attractiveness Index
Figure 5 Global Antibody Drug Conjugates Market by Target Antigen: Market Attractiveness Index
Figure 6 Global Antibody Drug Conjugates Market by Linker Type: Market Attractiveness Index
Figure 7 Global Antibody Drug Conjugates Market by Application: Market Attractiveness Index
Figure 8 Global Antibody Drug Conjugates Market: Market Dynamics
Figure 9 Global COVID Impact Analysis: Antibody Drug Conjugates Market Recovery Scenarios
Figure 10 Global Antibody Drug Conjugates Market by Region, 2022-2032 (US$ Mn ,AGR (%)) (V – Shaped Recovery)
Figure 11 Global Antibody Drug Conjugates Market by Region, 2022-2032 (US$ Mn ,AGR (%)) (U – Shaped Recovery)
Figure 12 Global Antibody Drug Conjugates Market by Region, 2022-2032 (US$ Mn, AGR (%)) (W – Shaped Recovery)
Figure 13 Global Antibody Drug Conjugates Market by Region, 2022-2032 (US$ Mn, AGR (%)) (L – Shaped Recovery)
Figure 14 Global Antibody Drug Conjugates Market: Porter’s Five Forces Analysis
Figure 15 Global Antibody Drug Conjugates Market: PESTLE Analysis
Figure 16 Global Antibody Drug Conjugates Market Forecast by Region 2022 to 2032 (Revenue, CAGR %)
Figure 17 Global Antibody Drug Conjugates Market Forecast by Region 2022, 2027, 2032 (Revenue, Market Share %)
Figure 18 Global Antibody Drug Conjugates Market by Value, 2022-2032 (US$ Mn, AGR (%))
Figure 19 Global Antibody Drug Conjugates Market by Value, 2022-2032 (US$ Mn, AGR (%)) (V – Shaped Recovery)
Figure 20 Global Antibody Drug Conjugates Market by Value, 2022-2032 (US$ Mn, AGR (%)) (W – Shaped Recovery)
Figure 21 Global Antibody Drug Conjugates Market by Value, 2022-2032 (US$ Mn, AGR (%)) (U – Shaped Recovery)
Figure 22 Global Antibody Drug Conjugates Market by Value, 2022-2032 (US$ Mn, AGR (%)) (L – Shaped Recovery)
Figure 23 Global Antibody Drug Conjugates Market by Region, 2022-2032 (US$ Mn, AGR (%))
Figure 24 Global Antibody Drug Conjugates KKK Market by Region, 2022-2032 (US$ Mn, AGR (%)) (V – Shaped Recovery)
Figure 25 Global Antibody Drug Conjugates Market by Region, 2022-2032 (US$ Mn, AGR (%)) (W – Shaped Recovery)
Figure 26 Global Antibody Drug Conjugates KKK Market by Region, 2022-2032 (US$ Mn, AGR (%)) (U – Shaped Recovery)
Figure 27 Global Antibody Drug Conjugates Market by Region, 2022-2032 (US$ Mn, AGR (%)) (L – Shaped Recovery)
Figure 28 Global Antibody Drug Conjugates by Technology Market Attractiveness Index
Figure 29 Global Antibody Drug Conjugates Market Forecast by Technology 2022, 2032 (Revenue, Market Share %)
Figure 30 Global Antibody Drug Conjugates Market by Technology, 2022-2032 (US$ Mn, AGR (%), CAGR (%))
Figure 31 Global Cleavable Linkers Market Forecast, 2022-2032, 2022-2032 (US$ Mn, AGR (%))
Figure 32 Global Cleavable Linkers Market by Region, 2022-2032 (US$ Mn)
Figure 33 Global Non-Cleavable Linkers Market Forecast, 2022-2032 (US$ Mn)
Figure 34 Global Non-Cleavable Linkers Market by Region,, 2022-2032, 2022-2032 (US$ Mn)
Figure 35 Global Other Technology Market by Region, 2022-2032, 2022-2032 (US$ Mn)
Figure 36 Global Other Technology Market by Region, 2022-2032, 2022-2032 (US$ Mn)
Figure 37 Global Antibody Drug Conjugates by Payload Type Market Attractiveness Index
Figure 38 Global Antibody Drug Conjugates Market Forecast by Payload Type 2022, 2032 (Revenue, Market Share (%))
Figure 39 Global Antibody Drug Conjugates Market by Payload Type, 2022-2032 (US$ Mn, AGR (%))
Figure 40 Global MMAE Market Forecast, 2022-2032, 2022-2032 (US$ Mn)
Figure 41 Global MMAE Market by Region, 2022-2032, 2022-2032 (US$ Mn)
Figure 42 Global DM4 Market Forecast, 2022-2032, 2022-2032 (US$ Mn)
Figure 43 Global DM4 Market by Region, 2022-2032, 2022-2032 (US$ Mn)
Figure 44 Global Camptothecin Market Forecast, 2022-2032, (US$ Mn)
Figure 45 Global Camptothecin Market by Region, 2022-2032, 2022-2032 (US$ Mn)
Figure 46 Global DM1 Market Forecast 2022-2032, 2022-2032 (US$ Mn)
Figure 47 Global DM1 Market Forecast 2022-2032, 2022-2032 (US$ Mn)
Figure 48 Global MMAF Market Forecast, 2022-2032, 2022-2032 (US$ Mn)
Figure 49 Global MMAF Market by Region 2022-2032, 2022-2032 (US$ Mn)
Figure 50 Global Other Payload Type Market Forecast 2022-2032, 2022-2032 (US$ Mn)
Figure 51 Global Other Payload Type Market by Region 2022-2032, 2022-2032 (US$ Mn)
Figure 52 Global Antibody Drug Conjugates by Target Antigen Market Attractiveness Index
Figure 53 Global Antibody Drug Conjugates Market Forecast by Target Antigen 2022, 2032 (Revenue, Market Share %)
Figure 54 Global Antibody Drug Conjugates Market by Target Antigen, 2022-2032 (US$ Mn, AGR (%))
Figure 55 Global CD30 Market Forecast 2022-2032, 2022-2032 (US$ Mn)
Figure 56 Global CD30 Market by Region 2022-2032, 2022-2032 (US$ Mn)
Figure 57 Global HER2 Market Forecast 2022-2032, 2022-2032 (US$ Mn)
Figure 58 Global HER2 Market by Region 2022-2032, 2022-2032 (US$ Mn)
Figure 59 Global CD22 Market Forecast 2022-2032, 2022-2032 (US$ Mn)
Figure 60 Global CD22 Market by Region 2022-2032, 2022-2032 (US$ Mn)
Figure 61 Global CD33 Market Forecast 2022-2032, 2022-2032 (US$ Mn)
Figure 62 Global CD33 Market by Region 2022-2032, 2022-2032 (US$ Mn)
Figure 63 Global Other Target Antigen Market Forecast 2022-2032, 2022-2032 (US$ Mn)
Figure 64 Global Other Target Antigen Market by Region 2022-2032, 2022-2032 (US$ Mn)
Figure 65 Global Antibody Drug Conjugates by Linker Type Market Attractiveness Index
Figure 66 Global Antibody Drug Conjugates Market Forecast by Linker Type 2022, 2032 (Revenue, Market Share %)
Figure 67 Global Antibody Drug Conjugates Market by Linker Type, 2022-2032 (US$ Mn)
Figure 68 Global VC Market Forecast 2022-2032, 2022-2032 (US$ Mn)
Figure 69 Global VC Market by Region 2022-2032, 2022-2032 (US$ Mn)
Figure 70 Global Sulfo-SPDB Market Forecast 2022-2032, 2022-2032 (US$ Mn)
Figure 71 Global Sulfo-SPDB Market by Region 2022-2032, 2022-2032 (US$ Mn)
Figure 72 Global SMCC Market Forecast 2022-2032, 2022-2032 (US$ Mn)
Figure 73 Global SMCC Market by Region, 2022-2032 (US$ Mn, AGR (%), CAGR (%))2022-2032, 2022-2032 (US$ Mn)
Figure 74 Global VA Market Forecast, 2022-2032 (US$ Mn)
Figure 75 Global VA Market by Region, 2022-2032 (US$ Mn)
Figure 76 Global VA Market by Region, 2022-2032 (US$ Mn)
Figure 77 Global Hydrazone Market by Region, 2022-2032 (US$ Mn)
Figure 78 Global Other Linker Type Market Forecast, 2022-2032 (US$ Mn)
Figure 79 Global Other Linker Type Market by Region, 2022-2032, 2022-2032 (US$ Mn)
Figure 80 Global Antibody Drug Conjugates by Application Market Attractiveness Index
Figure 81 Global Antibody Drug Conjugates Market Forecast by Application 2022, 2032 (Market Share %)
Figure 82 Global Antibody Drug Conjugates Market by Application, 2022-2032 (US$ Mn)
Figure 83 Global Blood Cancer Market Forecast, 2022-2032 (US$ Mn)
Figure 84 Global Blood Cancer Market by Region, 2022-2032 (US$ Mn)
Figure 85 Global Breast Cancer Market Forecast, 2022-2032 (US$ Mn)
Figure 86 Global Breast Cancer Market by Region, 2022-2032 (US$ Mn)
Figure 87 Global Ovarian Cancer Market Forecast, 2022-2032 (US$ Mn)
Figure 88 Global Ovarian Cancer Market by Region, 2022-2032 (US$ Mn)
Figure 89 Global Lung Cancer Market Forecast, 2022-2032 (US$ Mn)
Figure 90 Global Lung Cancer Market by Region, 2022-2032 (US$ Mn)
Figure 91 Global Brain Tumor Market Forecast, 2022-2032 (US$ Mn)
Figure 92 Global Brain Tumor Market by Region, 2022-2032 (US$ Mn)
Figure 93 Global Other Application Market Forecast, 2022-2032 (US$ Mn)
Figure 94 Global Other Application Market by Region, 2022-2032 (US$ Mn)
Figure 95 North America Antibody Drug Conjugates Market Attractiveness Index
Figure 96 North America Antibody Drug Conjugates Market Forecast by Value, 2022-2032 (US$ million, AGR (%))
Figure 97 North America Antibody Drug Conjugates Market Forecast by Country, 2022-2032 (US$ million, AGR (%))
Figure 98 North America Antibody Drug Conjugates Market Share Forecast by Country, 2022 & 2032 (%)
Figure 99 North America Antibody Drug Conjugates Market Forecast by Technology, 2022-2032 (US$ million, AGR (%))
Figure 100 North America Antibody Drug Conjugates Market Share Forecast by Technology, 2022 & 2032 (%)
Figure 101 North America Antibody Drug Conjugates Market Forecast by Payload Type, 2022-2032 (US$ million, AGR (%))
Figure 102 North America Antibody Drug Conjugates Market Share Forecast by Payload Type, 2022 & 2032 (%)
Figure 103 North America Antibody Drug Conjugates Market Forecast by Target Antigen, 2022-2032 (US$ million, AGR (%))
Figure 104 North America Antibody Drug Conjugates Market Share Forecast by Target Antigen, 2022 & 2032 (%)
Figure 105 North America Antibody Drug Conjugates Market Forecast by Linker Type, 2022-2032 (US$ million, AGR %)
Figure 106 North America Antibody Drug Conjugates Market Share Forecast by Linker Type, 2022 & 2032 (%)
Figure 107 North America Antibody Drug Conjugates Market Forecast by Application, 2022-2032 (US$ million, AGR (%))
Figure 108 North America Antibody Drug Conjugates Market Share Forecast by Application, 2022 & 2032 (%)
Figure 109 U.S. Antibody Drug Conjugates Market Forecast by Value, 2022-2032 (US$ million, AGR (%))
Figure 110 Canada Antibody Drug Conjugates Market Forecast by Value, 2022-2032 (US$ million, AGR (%))
Figure 111 Europe Antibody Drug Conjugates Market Attractiveness Index
Figure 112 Europe Antibody Drug Conjugates Market Forecast by Value, 2022-2032 (US$ million, AGR (%))
Figure 113 Europe Antibody Drug Conjugates Market Forecast by Country, 2022-2032 (US$ million, AGR (%))
Figure 114 Europe Antibody Drug Conjugates Market Share Forecast by Country, 2022 & 2032 (%)
Figure 115 Europe Antibody Drug Conjugates Market Forecast by Technology, 2022-2032 (US$ million, AGR (%))
Figure 116 Europe Antibody Drug Conjugates Market Share Forecast by Technology, 2022 & 2032 (%)
Figure 117 Europe Antibody Drug Conjugates Market Forecast by Payload Type, 2022-2032 (US$ million, AGR (%))
Figure 118 Europe Antibody Drug Conjugates Market Share Forecast by Payload Type, 2022 & 2032 (%)
Figure 119 Europe Antibody Drug Conjugates Market Forecast by Target Antigen, 2022-2032 (US$ million, AGR (%))
Figure 120 Europe Antibody Drug Conjugates Market Share Forecast by Target Antigen, 2022 & 2032 (%)
Figure 121 Europe Antibody Drug Conjugates Market Forecast by Linker Type, 2022-2032 (US$ million, AGR (%))
Figure 122 Europe Antibody Drug Conjugates Market Share Forecast by Linker Type, 2022 & 2032 (%)
Figure 123 Europe Antibody Drug Conjugates Market Forecast by Application, 2022-2032 (US$ million, AGR (%))
Figure 124 Europe Antibody Drug Conjugates Market Share Forecast by Application, 2022 & 2032 (%)
Figure 125 Germany Antibody Drug Conjugates Market Forecast by Value, 2022-2032 (US$ million, AGR (%))
Figure 126 U.K. Antibody Drug Conjugates Market Forecast by Value, 2022-2032 (US$ million, AGR (%))
Figure 127 France Antibody Drug Conjugates Market Forecast by Value, 2022-2032 (US$ million, AGR (%))
Figure 128 Italy Antibody Drug Conjugates Market Forecast by Value, 2022-2032 (US$ million, AGR (%))
Figure 129 Russia Antibody Drug Conjugates Market Forecast by Value, 2022-2032 (US$ million, AGR (%))
Figure 130 Rest Of Europe Antibody Drug Conjugates Market Forecast by Value, 2022-2032 (US$ million, AGR (%))
Figure 131 Asia-Pacific Antibody Drug Conjugates Market Attractiveness Index
Figure 132 Asia-Pacific Antibody Drug Conjugates Market Forecast by Value, 2022-2032 (US$ million, AGR (%))
Figure 133 Asia-Pacific Antibody Drug Conjugates Market Forecast by Country, 2022-2032 (US$ million, AGR (%))
Figure 134 Asia-Pacific Antibody Drug Conjugates Market Share Forecast by Country, 2022 & 2032 (%)
Figure 135 Asia-Pacific Antibody Drug Conjugates Market Forecast by Technology, 2022-2032 (US$ million, AGR (%))
Figure 136 Asia-Pacific Antibody Drug Conjugates Market Share Forecast by Technology, 2022 & 2032 (%)
Figure 137 Asia-Pacific Antibody Drug Conjugates Market Forecast by Payload Type, 2022-2032 (US$ million, AGR (%))
Figure 138 Asia-Pacific Antibody Drug Conjugates Market Share Forecast by Payload Type, 2022 & 2032 (%)
Figure 139 Asia-Pacific Antibody Drug Conjugates Market Forecast by Target Antigen, 2022-2032 (US$million, AGR (%))
Figure 140 Asia-Pacific Antibody Drug Conjugates Market Share Forecast by Target Antigen, 2022 & 2032 (%)
Figure 141 Asia-Pacific Antibody Drug Conjugates Market Forecast by Linker Type, 2022-2032 (US$million, AGR (%))
Figure 142 Asia-Pacific Antibody Drug Conjugates Market Share Forecast by Linker Type, 2022 & 2032 (%)
Figure 143 Asia-Pacific Antibody Drug Conjugates Market Forecast by Application, 2022-2032 (US$million, AGR (%))
Figure 144 Asia-Pacific Antibody Drug Conjugates Market Share Forecast by Application, 2022 & 2032 (%)
Figure 145 China Antibody Drug Conjugates Market Forecast by Value, 2022-2032 (US$million, AGR (%))
Figure 146 India Antibody Drug Conjugates Market Forecast by Value, 2022-2032 (US$million, AGR (%))
Figure 147 Japan Antibody Drug Conjugates Market Forecast by Value, 2022-2032 (US$million, AGR (%))
Figure 148 South Korea Antibody Drug Conjugates Market Forecast by Value, 2022-2032 (US$million, AGR (%))
Figure 149 Australia Antibody Drug Conjugates Market Forecast by Value, 2022-2032 (US$million, AGR (%))
Figure 150 Rest of Asia-Pacific Antibody Drug Conjugates Market Forecast by Value, 2022-2032 (US$million, AGR (%))
Figure 151 Middle East & Africa Antibody Drug Conjugates Market Attractiveness Index
Figure 152 Middle East & Africa Antibody Drug Conjugates Market Forecast by Value, 2022-2032 (US$million, AGR (%))
Figure 153 Middle East & Africa Antibody Drug Conjugates Market Forecast by Country, 2022-2032 (US$million, AGR (%))
Figure 154 Middle East & Africa Antibody Drug Conjugates Market Share Forecast by Country, 2022 & 2032 (%)
Figure 155 Middle East & Africa Antibody Drug Conjugates Market Forecast by Technology, 2022-2032 (US$million, AGR (%))
Figure 156 Middle East & Africa Antibody Drug Conjugates Market Share Forecast by Technology, 2022 & 2032 (%)
Figure 157 Middle East & Africa Antibody Drug Conjugates Market Forecast by Payload Type, 2022-2032 (US$million, AGR (%))
Figure 158 Middle East & Africa Antibody Drug Conjugates Market Share Forecast by Payload Type, 2022 & 2032 (%)
Figure 159 Middle East & Africa Antibody Drug Conjugates Market Forecast by Target Antigen, 2022-2032 (US$million, AGR (%))
Figure 160 Middle East & Africa Antibody Drug Conjugates Market Share Forecast by Target Antigen, 2022 & 2032 (%)
Figure 161 Middle East & Africa Antibody Drug Conjugates Market Forecast by Linker Type, 2022-2032 (US$million, AGR (%))
Figure 162 Middle East & Africa Antibody Drug Conjugates Market Share Forecast by Linker Type, 2022 & 2032 (%)
Figure 163 Middle East & Africa Antibody Drug Conjugates Market Forecast by Application, 2022-2032 (US$million, AGR (%))
Figure 164 Middle East & Africa Antibody Drug Conjugates Market Share Forecast by Application, 2022 & 2032 (%)
Figure 165 South Africa Antibody Drug Conjugates Market Forecast by Value, 2022-2032 (US$million, AGR (%))
Figure 166 Saudi Arabia Antibody Drug Conjugates Market Forecast by Value, 2022-2032 (US$million, AGR (%))
Figure 167 U.A.E. Antibody Drug Conjugates Market Forecast by Value, 2022-2032 (US$million, AGR (%))
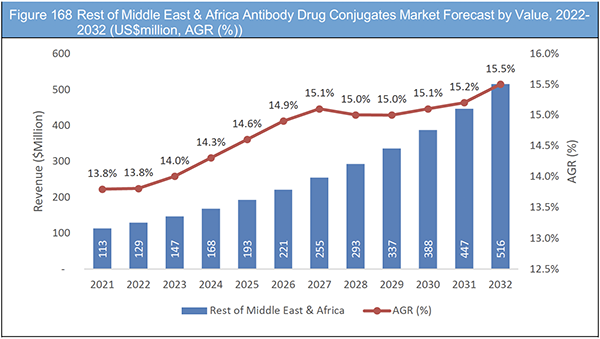
Figure 168 Rest Of Middle East & Africa Antibody Drug Conjugates Market Forecast by Value, 2022-2032 (US$million, AGR (%))
Figure 169 South America Antibody Drug Conjugates Market Attractiveness Index
Figure 170 South America Antibody Drug Conjugates Market Forecast by Value, 2022-2032 (US$million, AGR (%))
Figure 171 South America Antibody Drug Conjugates Market Forecast by Country, 2022-2032 (US$million, AGR (%))
Figure 172 South America Antibody Drug Conjugates Market Share Forecast by Country, 2022 & 2032 (%)
Figure 173 South America Antibody Drug Conjugates Market Forecast by Technology, 2022-2032 (US$million, AGR (%))
Figure 174 South America Antibody Drug Conjugates Market Share Forecast by Technology, 2022 & 2032 (%)
Figure 175 South America Antibody Drug Conjugates Market Forecast by Payload Type, 2022-2032 (US$million, AGR (%))
Figure 176 South America Antibody Drug Conjugates Market Share Forecast by Payload Type, 2022 & 2032 (%)
Figure 177 South America Antibody Drug Conjugates Market Forecast by Target Antigen, 2022-2032 (US$million, AGR (%))
Figure 178 South America Antibody Drug Conjugates Market Share Forecast by Target Antigen, 2022 & 2032 (%)
Figure 179 South America Antibody Drug Conjugates Market Forecast by Linker Type, 2022-2032 (US$million, AGR (%))
Figure 180 South America Antibody Drug Conjugates Market Share Forecast by Linker Type, 2022 & 2032 (%)
Figure 181 South America Antibody Drug Conjugates Market Forecast by Application, 2022-2032 (US$million, AGR (%))
Figure 182 South America Antibody Drug Conjugates Market Share Forecast by Application, 2022 & 2032 (%)
Figure 183 Brazil Antibody Drug Conjugates Market Forecast by Value, 2022-2032 (US$million, AGR (%))
Figure 184 Mexico Antibody Drug Conjugates Market Forecast by Value, 2022-2032 (US$million, AGR (%))
Figure 185 Rest Of South America Antibody Drug Conjugates Market Forecast by Value, 2022-2032 (US$million, AGR (%))
Figure 186 Global Antibody Drug Conjugates Market: Company Share Analysis, 2021
Figure 187 Abbvie Inc. Company: Net Revenue, 2017-2021 (US$ million, AGR(%))
Figure 188 Abbvie Inc. Company: Gross Profit, 2017-2021 (US$ million, AGR (%))
Figure 189 Abbvie Inc. Company: R&D, 2017-2021 (US$ million, AGR (%))
Figure 190 Abbvie Inc. Company: EBITDA, 2017-2021 (US$ million, AGR (%))
Figure 191 Astellas Pharma Inc.: Net Revenue, 2017-2021 (US$ million, AGR(%))
Figure 192 Astellas Pharma Inc.: Gross Profit, 2017-2021 (US$ million, AGR(%))
Figure 193 Astellas Pharma Inc.: R&D, 2017-2021 (US$ million, AGR (%))
Figure 194 Astellas Pharma Inc.: EBITDA, 2017-2021 (US$ million, AGR (%))
Figure 195 Bayer AG: Net Revenue, 2017-2021 (US$ million, AGR (%))
Figure 196 Bayer AG: Gross Profit, 2017-2021 (US$ million, AGR (%))
Figure 197 Bayer AG: R&D, 2017-2021 (US$ million, AGR (%))
Figure 198 Bayer AG: EBITDA, 2017-2021 (US$ million, AGR (%))
Figure 199 Celldex Therapeutics, Inc.: Net Revenue, 2017-2021 (US$ million, AGR(%))
Figure 200 Celldex Therapeutics, Inc.: Gross Profit, 2017-2021 (US$ million, AGR(%))
Figure 201 Celldex Therapeutics, Inc.: R&D, 2017-2021 (US$ million, AGR(%))
Figure 202 Celldex Therapeutics, Inc.: EBITDA, 2017-2021 (US$ million, AGR (%))
Figure 203 ImmunoGen, Inc.: Net Revenue, 2017-2021 (US$ million, AGR (%))
Figure 204 ImmunoGen, Inc.: Gross Profit, 2017-2021 (US$ million, AGR (%))
Figure 205 ImmunoGen, Inc.: R&D, 2017-2021 (US$ million, AGR (%))
Figure 206 ImmunoGen, Inc.: EBITDA, 2017-2021 (US$ million, AGR (%))
Figure 207 Gilead Sciences, Inc.: Net Revenue, 2017-2021 (US$ million, AGR (%))
Figure 208 Gilead Sciences, Inc.: Gross Profit, 2017-2021 (US$ million, AGR (%))
Figure 209 Gilead Sciences, Inc.: R&D, 2017-2021 (US$ million, AGR (%))
Figure 210 Gilead Sciences, Inc.: EBITDA, 2017-2021 (US$ million, AGR (%))
Figure 211 Lonza Group AG: Net Revenue, 2017-2021 (US$ million, AGR(%))
Figure 212 Lonza Group AG: Gross Profit, 2017-2021 (US$ million, AGR(%))
Figure 213 Lonza Group AG: R&D, 2017-2021 (US$ million, AGR(%))
Figure 214 Lonza Group AG: EBITDA, 2017-2021 (US$ million, AGR(%))
Figure 215 Mersana Therapeutics Inc.: Net Revenue, 2017-2021 (US$ million, AGR(%))
Figure 216 Mersana Therapeutics Inc.: Gross Profit, 2017-2021 (US$ million, AGR(%))
Figure 217 Mersana Therapeutics Inc.: R&D, 2017-2021 (US$ million, AGR (%))
Figure 218 Mersana Therapeutics Inc.: EBITDA, 2017-2021 (US$ million, AGR (%))
Figure 219 Takeda Pharmaceutical Company Limited: Net Revenue, 2017-2021 (US$ million, AGR (%))
Figure 220 Takeda Pharmaceutical Company Limited: Gross Profit, 2017-2021 (US$ million, AGR (%))
Figure 221 Takeda Pharmaceutical Company Limited: R&D, 2017-2021 (US$ million, AGR (%))
Figure 222 Takeda Pharmaceutical Company Limited: EBITDA, 2017-2021 (US$ million, AGR (%))
Figure 223 Pfizer Inc.: Net Revenue, 2017-2021 (US$ million, AGR(%))
Figure 224 Pfizer Inc.: Gross Profit, 2017-2021 (US$ million, AGR(%))
Figure 225 Pfizer Inc.: R&D, 2017-2021 (US$ million, AGR (%))
Figure 226 Pfizer Inc.: EBITDA, 2017-2021 (US$ million, AGR (%))
Figure 227 F. Hoffmann-La Roche Ltd: Net Revenue, 2017-2021 (US$ million, AGR(%))
Figure 228 F. Hoffmann-La Roche Ltd: Gross Profit, 2017-2021 (US$ million, AGR(%))
Figure 229 F. Hoffmann-La Roche Ltd: R&D, 2017-2021 (US$ million, AGR(%))
Figure 230 F. Hoffmann-La Roche Ltd: EBITDA, 2017-2021 (US$ million, AGR(%))
Figure 231 Lantheus Holdings, Inc.: Net Revenue, 2017-2021 (US$ million, AGR(%))
Figure 232 Lantheus Holdings, Inc.: Gross Profit, 2017-2021 (US$ million, AGR(%))
Figure 233 Lantheus Holdings, Inc.: R&D, 2017-2021 (US$ million, AGR(%))
Figure 234 Lantheus Holdings, Inc.: EBITDA, 2017-2021 (US$ million, AGR(%))
Figure 235 Seagen Inc.: Net Revenue, 2017-2021 (US$ million, AGR(%))
Figure 236 Seagen Inc.: Gross Profit, 2017-2021 (US$ million, AGR(%))
Figure 237 Seagen Inc.: R&D, 2017-2021 (US$ million, AGR(%))
Figure 238 Seagen Inc.: EBITDA, 2017-2021 (US$ million, AGR(%))
Figure 239 Merck KGaA: Net Revenue, 2017-2021 (US$ million, AGR(%))
Figure 240 Merck KGaA: Gross Profit, 2017-2021 (US$ million, AGR(%))
Figure 241 Merck KGaA: R&D, 2017-2021 (US$ million, AGR(%))
Figure 242 Merck KGaA: EBITDA, 2017-2021 (US$ million, AGR(%))
ページTOPに戻る
Summary
Report Details
The Antibody Drug Conjugates Market Report 2022-2032: This report will prove invaluable to leading firms striving for new revenue pockets if they wish to better understand the industry and its underlying dynamics. It will be useful for companies that would like to expand into different industries or to expand their existing operations in a new region.
Effective and Targeted Medicines are Gaining Traction
Effective and targeted medicines are urgently required in the worldwide health emergency brought on by the (COVID-19) pandemic. Since antibody therapies are relatively simple to develop in comparison to conventional small-molecular medications and are just as precise as vaccines in focusing on the SARS-CoV-2 coronavirus, they have received a lot of attention recently. Seven SARS-CoV-2 antibodies having 3D structures that have been stored in the Protein Data Bank are reviewed (PDB). The possibility of five 3D antibody structures linked to the SARS-CoV spike (S) protein to neutralize SARS-CoV-2 is also assessed. These antibodies’ interactions with the S protein receptor-binding domain (RBD) are contrasted with the interactions between complexes including ACE2 and the RBD.
Antibody-Drug Conjugates (ADCs) For Cancer Therapy for Drawing Attention from All over the World
Significant traction has been observed for this market owing to the abundance of newly developed antibody-drug conjugates (ADCs) for cancer therapy, drawing attention from all over the world. Even though finding an appropriate mix of an antibody, a linker, and a payload for an ADC can be quite difficult, as of September 2021, 11 ADCs had received FDA clearance, with eight of those being approved in 2017. In 2020, many mergers and partnerships were recorded in the ADC sector despite the COVID-19 pandemic, demonstrating that Big Pharma is highly interested in this therapeutic approach.
What Questions Should You Ask before Buying a Market Research Report?
• How is the antibody drug conjugates market evolving?
• What is driving and restraining the antibody drug conjugates market?
• How will each antibody drug conjugates submarket segment grow over the forecast period and how much revenue will these submarkets account for in 2032?
• How will the market shares for each antibody drug conjugates submarket develop from 2022 to 2032?
• What will be the main driver for the overall market from 2022 to 2032?
• Will leading antibody drug conjugates markets broadly follow the macroeconomic dynamics, or will individual national markets outperform others?
• How will the market shares of the national markets change by 2032 and which geographical region will lead the market in 2032?
• Who are the leading players and what are their prospects over the forecast period?
• What are the antibody drug conjugates projects for these leading companies?
• How will the industry evolve during the period between 2020 and 2032? What are the implications of antibody drug conjugates projects taking place now and over the next 10 years?
• Is there a greater need for product commercialisation to further scale the antibody drug conjugates market?
• Where is the antibody drug conjugates market heading and how can you ensure you are at the forefront of the market?
• What are the best investment options for new product and service lines?
• What are the key prospects for moving companies into a new growth path and C-suite?
You need to discover how this will impact the antibody drug conjugates market today, and over the next 10 years:
• Our 434-page report provides 184 tables and 242 charts /graphs exclusively to you.
• The report highlights key lucrative areas in the industry so you can target them – NOW.
• It contains in-depth analysis of global, regional and national sales and growth.
• It highlights for you the key successful trends, changes and revenue projections made by your competitors.
This report tells you TODAY how the antibody drug conjugates market will develop in the next 10 years, and in line with the variations in COVID-19 economic recession and bounce. This market is more critical now than at any point over the last 10 years.
Forecasts to 2032 and other analyses reveal commercial prospects
• In addition to revenue forecasting to 2032, our new study provides you with recent results, growth rates, and market shares.
• You will find original analyses, with business outlooks and developments.
• Discover qualitative analyses (including market dynamics, drivers, opportunities, restraints and challenges), cost structure, impact of rising antibody drug conjugates prices and recent developments.
This report includes data analysis and invaluable insight into how COVID-19 will affect the industry and your company. Four COVID-19 recovery patterns and their impact, namely, “V”, “L”, “W” and “U” are discussed in this report.
Segments Covered in the Report
Market Segment by Payload Type
• MMAE
• DM4
• Camptothecin
• DM1
• MMAF
• Other Payload Type
Market Segment by Technology
• Cleavable Linkers
• Non-Cleavable Linkers
• Other Technology
Market Segment by Linker Type
• VC
• Sulfo-SPDB
• SMCC
• Other Linker Type
• VA
• Hydrazone
Market Segment by Target Antigen
• CD30
• HER2
• CD22
• CD33
• Other Target Antigen
Market Segment by Application
• Blood Cancer
• Breast Cancer
• Ovarian Cancer
• Lung Cancer
• Brain Tumor
• Other Application
In addition to the revenue predictions for the overall world market and segments, you will also find revenue forecasts for four regional and 20 leading national markets:
North America
• U.S.
• Canada
Europe
• Germany
• Russia
• United Kingdom
• France
• Italy
• Rest of Europe
Asia Pacific
• China
• Japan
• India
• Australia
• South Korea
• Rest of Asia Pacific
South America
• Brazil
• Mexico
• Rest of South America
Middle East & Africa
• Saudi Arabia
• South Africa
• UAE
• Rest of Middle East & Africa
The report also includes profiles and for some of the leading companies in the Antibody Drug Conjugates Market, 2022 to 2032, with a focus on this segment of these companies’ operations.
Leading companies and the potential for market growth
• AbbVie Inc. Company
• Astellas Pharma Inc.
• Bayer AG
• Celldex Therapeutics, Inc.
• F. Hoffmann-La Roche Ltd.
• Genentech, Inc.
• Gilead Sciences, Inc.
• ImmunoGen, Inc.
• Lantheus Holdings, Inc.
• Lonza Group AG
• Merck KGaA
• Mersana Therapeutics Inc.
• Pfizer Inc.
• Seagen Inc.
• Takeda Pharmaceutical Company Limited
Overall world revenue for Antibody Drug Conjugates Market, 2022 to 2032 in terms of value the market will surpass US$4,182 million in 2022, our work calculates. We predict strong revenue growth through to 2032. Our work identifies which organizations hold the greatest potential. Discover their capabilities, progress, and commercial prospects, helping you stay ahead.
How will the Antibody Drug Conjugates Market, 2022 to 2032 report help you?
In summary, our 430+ page report provides you with the following knowledge:
• Revenue forecasts to 2032 for Antibody Drug Conjugates Market, 2022 to 2032 Market, with forecasts by payload type, technology, linker type, target antigen, application, and company size, each forecast at a global and regional level – discover the industry’s prospects, finding the most lucrative places for investments and revenues.
• Revenue forecasts to 2032 for four regional and 20 key national markets – See forecasts for the Antibody Drug Conjugates Market, 2022 to 2032 market in North America, Europe, Asia-Pacific, South America, and Middle East & Africa. Also forecasted is the market in the US, Canada, Mexico, Brazil, Germany, Russia, UK, Italy, China, India, Japan, and Australia among other prominent economies.
• Prospects for established firms and those seeking to enter the market – including company profiles for 15 of the major companies involved in the Antibody Drug Conjugates Market, 2022 to 2032.
Find quantitative and qualitative analyses with independent predictions. Receive information that only our report contains, staying informed with invaluable business intelligence.
Information found nowhere else
With our new report, you are less likely to fall behind in knowledge or miss out on opportunities. See how our work could benefit your research, analyses, and decisions. Visiongain’s study is for everybody needing commercial analyses for the Antibody Drug Conjugates Market, 2022 to 2032, market-leading companies. You will find data, trends and predictions.
ページTOPに戻る
Table of Contents
Table of Contents
1. Report Overview
1.1 Objectives of the Study
1.2 Introduction to Antibody Drug Conjugates Market
1.3 What This Report Delivers
1.4 Why You Should Read This Report
1.5 Key Questions Answered by This Analytical Report
1.6 Who is This Report for?
1.7 Methodology
1.7.1 Market Definitions
1.7.2 Market Evaluation & Forecasting Methodology
1.7.3 Data Validation
1.8 Frequently Asked Questions (FAQs)
1.9 Associated Visiongain Reports
1.10 About Visiongain
2 Executive Summary
2.1 Geographical Snapshot: Global Antibody Drug Conjugates Market
2.2 Technology Segment: Market Attractiveness Index
2.3 Payload Type Segment: Market Attractiveness Index
2.4 Target Antigen Segment: Market Attractiveness Index
2.5 Linker Type Segment: Market Attractiveness Index
2.6 Application Segment: Market Attractiveness Index
3 Market Overview
3.1 Key Findings
3.2 ADCs Market
3.2.1 FDA Approved Antibody Drug Conjugates
3.3 Supply Chain
3.4 Value Chain
3.5 Cold chain
3.6 Recent Trends/ Developments
3.7 Market Dynamics
3.7.1 Market Driving Factors
3.7.2 Market Restraining Factors
3.7.3 Market Opportunities
3.8 COVID-19 Impact Analysis
3.9 Porter’s Five Forces Analysis
3.9.1 Bargaining Power of Suppliers (High)
3.9.2 Bargaining Power of Buyers (Moderate)
3.9.3 Competitive Rivalry in the Market (High)
3.9.4 Threat from Substitutes (Low)
3.9.5 Threat of New Entrants (Low)
3.10 PESTLE Analysis
3.10.1 Political
3.10.2 Economical
3.10.3 Social
3.10.4 Technological
3.10.5 Legal
3.10.6 Environmental
4 Global Antibody Drug Conjugates Market Analysis
4.1 Key Findings
4.2 Global Market Outlook
4.3 Region Segment Growth Prospects
4.4 Global Antibody Drug Conjugates Market Share by Region, 2022 & 2032
4.5 Global Antibody Drug Conjugates Market Share Forecast
4.5.1 Pre-COVID-19 Market Scenario
4.5.2 Post-COVID-19 Market Scenarios (V, W, U, L-Shaped Recovery Analysis)
4.6 Global Pharma Contract Sales Market by Region Size Estimation and Forecast
4.6.1 Pre-COVID-19 Market Scenario
4.6.2 Post-COVID-19 Market Scenarios (V, W, U, L-Shaped Recovery Analysis)
5 Global Antibody Drug Conjugates Market Analysis by Technology
5.1 Key Findings
5.2 Global Technology Market Outlook
5.3 Global Antibody Drug Conjugates by Technology Market Attractiveness Index
5.4 Regional Market Size Estimation and Forecast
5.5 Cleavable Linkers
5.5.1 Global Cleavable Linkers Market Forecast
5.5.2 Global Cleavable Linkers Market Forecast by Region
5.6 Non-Cleavable Linkers
5.6.1 Global Non-Cleavable Linkers Market Forecast
5.6.2 Global Non-Cleavable Linkers Market Forecast by Region
5.7 Other Technology
5.7.1 Global Other Technology Market Forecast
5.7.2 Global Other Technology Market Forecast by Region
6 Global Antibody Drug Conjugates Market Analysis by Payload Type
6.1 Key Findings
6.2 Global Payload Type Market Outlook
6.3 Global Antibody Drug Conjugates by Payload Type Market Attractiveness Index
6.4 Global Antibody Drug Conjugates Market by Payload Type
6.5 MMAE
6.5.1 Global MMAE Market Forecast
6.5.2 Global MMAE Market Forecast by Region
6.6 DM4
6.6.1 Global DM4 Market Forecast
6.6.2 Global DM4 Market Forecast by Region
6.7 Camptothecin
6.7.1 Global Camptothecin Market Forecast
6.7.2 Global Camptothecin Market Forecast by Region
6.8 DM1
6.8.1 Global DM1 Market
6.8.2 Global DM1 Market Forecast by Region
6.9 MMAF
6.9.1 Global MMAF Market Forecast
6.9.2 Global MMAF Market Forecast by Region
6.10 Other Payload Type
6.10.1 Global Other Payload Type Market Forecast
6.10.2 Global Other Payload Type Market Forecast by Region
7 Global Antibody Drug Conjugates Market Analysis by Target Antigen
7.1 Key Findings
7.2 Global Target Antigen Market Outlook
7.3 Global Antibody Drug Conjugates by Target Antigen Market Attractiveness Index
7.4 Global Antibody Drug Conjugates Market by Target Antigen
7.5 CD30
7.5.1 Global CD30 Market Forecast
7.5.2 Global CD30 Market Forecast by Region
7.6 HER2
7.6.1 Global HER2 Market Forecast
7.6.2 Global HER2 Market Forecast by Region
7.7 CD22
7.7.1 Global CD22 Market Forecast
7.7.2 Global CD22 Market Forecast by Region
7.8 CD33
7.8.1 Global CD33 Market Forecast
7.8.2 Global CD33 Market Forecast by Region
7.9 Other Target Antigen
7.9.1 Global Other Target Antigen Market Forecast
7.9.2 Global Other Target Antigen Market Forecast by Region
8 Global Antibody Drug Conjugates Market Analysis by Linker Type
8.1 Key Findings
8.2 Global Linker Type Market Outlook
8.3 Global Antibody Drug Conjugates by Linker Type Market Attractiveness Index
8.4 Global Antibody Drug Conjugates Market by Linker Type
8.5 VC
8.5.1 Global VC Market Forecast
8.5.2 Global VC Market by Region
8.6 Sulfo-SPDB
8.6.1 Global Sulfo-SPDB Market Forecast
8.6.2 Global Sulfo-SPDB Market by Region
8.7 SMCC Market
8.7.1 Global SMCC Market Forecast
8.7.2 Global SMCC Market by Region
8.8 VA
8.8.1 Global VA Market Forecast
8.8.2 Global VA Market by Region
8.9 Hydrazone
8.9.1 Global Hydrazone Market Forecast
8.9.2 Global Hydrazone Market by Region
8.10 Other Linker Type
8.10.1 Global Other Linker Type Market Forecast
8.10.2 Global Other Linker Type Market by Region
9 Global Antibody Drug Conjugates Market Analysis by Application
9.1 Key Findings
9.2 Global Application Market Outlook
9.3 Global Antibody Drug Conjugates by Application Market Attractiveness Index
9.4 Global Antibody Drug Conjugates Market by Application
9.5 Blood Cancer
9.5.1 Global Blood Cancer Market Forecast
9.5.2 Global Blood Cancer Market by Region
9.6 Breast Cancer
9.6.1 Global Breast Cancer Market Forecast
9.6.2 Global Breast Cancer Market by Region
9.7 Ovarian Cancer
9.7.1 Global Ovarian Cancer Market Forecast
9.7.2 Global Ovarian Cancer Market by Region
9.8 Lung Cancer
9.8.1 Global Lung Cancer Market Forecast
9.8.2 Global Lung Cancer Market by Region
9.9 Brain Tumor
9.9.1 Global Brain Tumor Market Forecast
9.9.2 Global Brain Tumor Market by Region
9.10 Other Application
9.10.1 Global Other Application Market Forecast
9.10.2 Global Other Application Market by Region
10 North America Antibody Drug Conjugates Market Analysis
10.1 Key Findings
10.2 The Global Antibody Drug Market is predominated by North America
10.3 North America Antibody Drug Conjugates Market Attractiveness Index
10.4 North America Antibody Drug Conjugates Market Size Estimation and Forecast by Value
10.5 North America Antibody Drug Conjugates Market Size Estimation and Forecast by Country
10.6 North America Antibody Drug Conjugates Market Size Estimation and Forecast by Technology
10.7 North America Antibody Drug Conjugates Market Size Estimation and Forecast by Payload Type
10.8 North America Antibody Drug Conjugates Market Size Estimation and Forecast by Target Antigen
10.9 North America Antibody Drug Conjugates Market Size Estimation and Forecast by Linker Type
10.10 North America Antibody Drug Conjugates Market Size Estimation and Forecast by Application
10.11 U.S.
10.11.1 U.S. Antibody Drug Conjugates Market by Value
10.12 Canada
10.12.1 Canada Antibody Drug Conjugates Market by Value
11 Europe Antibody Drug Conjugates Market Analysis
11.1 Key Findings
11.2 Europe Antibody Drug Conjugates Market Attractiveness Index
11.3 Europe Antibody Drug Conjugates Market Size Estimation and Forecast by Value
11.4 Europe Antibody Drug Conjugates Market Size Estimation and Forecast by Country
11.5 Europe Antibody Drug Conjugates Market Size Estimation and Forecast by Technology
11.6 Europe Antibody Drug Conjugates Market Size Estimation and Forecast by Payload Type
11.7 Europe Antibody Drug Conjugates Market Size Estimation and Forecast by Target Antigen
11.8 Europe Antibody Drug Conjugates Market Size Estimation and Forecast by Linker Type
11.9 Europe Antibody Drug Conjugates Market Size Estimation and Forecast by Application
11.10 Germany
11.10.1 Germany Antibody Drug Conjugates Market by Value
11.11 U.K.
11.11.1 U.K. Antibody Drug Conjugates Market by Value
11.12 France
11.12.1 France Antibody Drug Conjugates Market by Value
11.13 Italy
11.13.1 Italy Antibody Drug Conjugates Market by Value
11.14 Russia
11.14.1 Russia Antibody Drug Conjugates Market by Value
11.15 Rest of Europe
11.15.1 Rest of Europe Antibody Drug Conjugates Market by Value
12 Asia-Pacific Antibody Drug Conjugates Market Analysis
12.1 Key Findings
12.2 Asia-Pacific Antibody Drug Conjugates Market Attractiveness Index
12.3 Asia-Pacific Antibody Drug Conjugates Market Size Estimation and Forecast by Value
12.4 Asia-Pacific Antibody Drug Conjugates Market Size Estimation and Forecast by Country
12.5 Asia-Pacific Antibody Drug Conjugates Market Size Estimation and Forecast by Technology
12.6 Asia-Pacific Antibody Drug Conjugates Market Size Estimation and Forecast by Payload Type
12.7 Asia-Pacific Antibody Drug Conjugates Market Size Estimation and Forecast by Target Antigen
12.8 Asia-Pacific Antibody Drug Conjugates Market Size Estimation and Forecast by Linker Type
12.9 Asia-Pacific Antibody Drug Conjugates Market Size Estimation and Forecast by Application
12.10 China
12.10.1 China Antibody Drug Conjugates Market by Value
12.11 India
12.11.1 India Antibody Drug Conjugates Market by Value
12.12 Japan
12.12.1 Japan Antibody Drug Conjugates Market by Value
12.13 South Korea
12.13.1 South Korea Antibody Drug Conjugates Market by Value
12.14 Australia
12.14.1 Australia Antibody Drug Conjugates Market by Value
12.15 Rest of Asia-Pacific
12.15.1 Rest of Asia-Pacific Antibody Drug Conjugates Market by Value
13 Middle East & Africa Antibody Drug Conjugates Market Analysis
13.1 Key Findings
13.2 Middle East & Africa Antibody Drug Conjugates Market Attractiveness Index
13.3 Middle East & Africa Antibody Drug Conjugates Market Size Estimation and Forecast by Value
13.4 Middle East & Africa Antibody Drug Conjugates Market Size Estimation and Forecast by Country
13.5 Middle East & Africa Antibody Drug Conjugates Market Size Estimation and Forecast by Technology
13.6 Middle East & Africa Antibody Drug Conjugates Market Size Estimation and Forecast by Payload Type
13.7 Middle East & Africa Antibody Drug Conjugates Market Size Estimation and Forecast by Target Antigen
13.8 Middle East & Africa Antibody Drug Conjugates Market Size Estimation and Forecast by Linker Type
13.9 Middle East & Africa Antibody Drug Conjugates Market Size Estimation and Forecast by Application
13.10 South Africa
13.10.1 South Africa Antibody Drug Conjugates Market by Value
13.11 Saudi Arabia
13.11.1 Saudi Arabia Antibody Drug Conjugates Market by Value
13.12 U.A.E.
13.12.1 U. A.E. Antibody Drug Conjugates Market by Value
13.13 Rest of Middle East & Africa
13.13.1 Rest of Middle East & Africa Antibody Drug Conjugates Market by Value
14 South America Antibody Drug Conjugates Market Analysis
14.1 Key Findings
14.2 South America Antibody Drug Conjugates Market Attractiveness Index
14.3 South America Antibody Drug Conjugates Market Size Estimation and Forecast by Value
14.4 South America Antibody Drug Conjugates Market Size Estimation and Forecast by Country
14.5 South America Antibody Drug Conjugates Market Size Estimation and Forecast by Technology
14.6 South America Antibody Drug Conjugates Market Size Estimation and Forecast by Payload Type
14.7 South America Antibody Drug Conjugates Market Size Estimation and Forecast by Target Antigen
14.8 South America Antibody Drug Conjugates Market Size Estimation and Forecast by Linker Type
14.9 South America Antibody Drug Conjugates Market Size Estimation and Forecast by Application
14.10 Brazil
14.10.1 Brazil Antibody Drug Conjugates Market by Value
14.11 Mexico
14.11.1 Mexico Antibody Drug Conjugates Market by Value
14.12 Rest of South America
14.12.1 Rest of South America Antibody Drug Conjugates Market by Value
15 Competitive Landscape
15.1 Company Share Analysis
15.2 Key Business Strategy Analysis- Acquisition
15.3 Key Business Strategy Analysis- Agreement
15.4 Key Business Strategy Analysis- Collaboration
15.5 Key Business Strategy Analysis- Development
15.6 Key Business Strategy Analysis- Expansion
15.7 Key Business Strategy Analysis- Investment
15.8 Key Business Strategy Analysis- Merger
15.9 Key Business Strategy Analysis- New Product Launch
15.10 Key Business Strategy Analysis- Partnership
16 Company Profiles
16.1 Abbvie Inc. Company
16.1.1 Company Snapshot
16.1.2 Company Overview
16.1.3 Financial Analysis
16.1.4 Product Benchmarking
16.1.5 Strategic Outlook
16.2 Astellas Pharma Inc.
16.2.1 Company Snapshot
16.2.2 Company Overview
16.2.3 Financial Analysis
16.2.4 Product Benchmarking
16.2.5 Strategic Outlook
16.3 Bayer AG
16.3.1 Company Snapshot
16.3.2 Company Overview
16.3.3 Financial Analysis
16.3.4 Product Benchmarking
16.3.5 Strategic Outlook
16.4 Celldex Therapeutics, Inc.
16.4.1 Company Snapshot
16.4.2 Company Overview
16.4.3 Financial Analysis
16.4.4 Product Benchmarking
16.4.5 Strategic Outlook
16.5 Genentech, Inc.
16.5.1 Company Snapshot
16.5.2 Company Overview
16.5.3 Product Benchmarking
16.5.4 Strategic Outlook
16.6 ImmunoGen, Inc.
16.6.1 Company Snapshot
16.6.2 Company Overview
16.6.3 Financial Analysis
16.6.4 Product Benchmarking
16.6.5 Strategic Outlook
16.7 Gilead Sciences, Inc.
16.7.1 Company Snapshot
16.7.2 Company Overview
16.7.3 Financial Analysis
16.7.4 Product Benchmarking
16.7.5 Strategic Outlook
16.8 Lonza Group AG
16.8.1 Company Snapshot
16.8.2 Company Overview
16.8.3 Financial Analysis
16.8.4 Product Benchmarking
16.8.5 Strategic Outlook
16.9 Mersana Therapeutics Inc.
16.9.1 Company Snapshot
16.9.2 Company Overview
16.9.3 Financial Analysis
16.9.4 Product Benchmarking
16.9.5 Strategic Outlook
16.10 Takeda Pharmaceutical Company Limited
16.10.1 Company Snapshot
16.10.2 Company Overview
16.10.3 Financial Analysis
16.10.4 Product Benchmarking
16.10.5 Strategic Outlook
16.11 Pfizer Inc.
16.11.1 Company Snapshot
16.11.2 Company Overview
16.11.3 Financial Analysis
16.11.4 Product Benchmarking
16.11.5 Strategic Outlook
16.12 F. Hoffmann-La Roche Ltd
16.12.1 Company Snapshot
16.12.2 Company Overview
16.12.3 Financial Analysis
16.12.4 Product Benchmarking
16.12.5 Strategic Outlook
16.13 Lantheus Holdings, Inc.
16.13.1 Company Snapshot
16.13.2 Company Overview
16.13.3 Financial Analysis
16.13.4 Product Benchmarking
16.13.5 Strategic Outlook
16.14 Seagen Inc.
16.14.1 Company Snapshot
16.14.2 Company Overview
16.14.3 Financial Analysis
16.14.4 Product Benchmarking
16.14.5 Strategic Outlook
16.15 Merck KGaA
16.15.1 Company Snapshot
16.15.2 Company Overview
16.15.3 Financial Analysis
16.15.4 Product Benchmarking
16.15.5 Strategic Outlook
17 Conclusion and Recommendations
17.1 Concluding Remarks from Visiongain
17.2 Recommendations for Market Players
List of Tables
Table 1 Global Antibody Drug Conjugates Market Snapshot, 2022 & 2032 (US$ million, CAGR %)
Table 2 Global Antibody Drug Conjugate Approved Drugs, 2022-2032 (US$ Mn, AGR (%), CAGR (%))
Table 3 Global Antibody Drug Conjugates Market by Region, 2022-2032 (US$ Mn, AGR (%), CAGR (%)) (V-Shaped Recovery Scenario)
Table 4 Global Antibody Drug Conjugates Market by Region, 2022-2032 (US$ Mn, AGR (%), CAGR (%)) (U-Shaped Recovery Scenario)
Table 5 Global Antibody Drug Conjugates Market by Region, 2022-2032 (US$ Mn, AGR (%), CAGR (%)) (W-Shaped Recovery Scenario)
Table 6 Global Antibody Drug Conjugates Market by Region, 2022-2032 (US$ Mn, AGR (%), CAGR (%)) (L-Shaped Recovery Scenario)
Table 7 Summary of Antibody–Drug Conjugates Approved For Market Worldwide For Clinical Use, 2021
Table 8 Global Antibody Drug Conjugates Market Forecast, 2022-2032 (US$ Mn, AGR (%), CAGR (%))
Table 9 Global Antibody Drug Conjugates Market Forecast, 2022-2032 (US$ Mn, AGR (%), CAGR (%)) (V-Shaped Recovery Scenario)
Table 10 Global Antibody Drug Conjugates Market Forecast, 2022-2032 (US$ Mn, AGR (%), CAGR (%)) (W-Shaped Recovery Scenario)
Table 11 Global Antibody Drug Conjugates Market Forecast, 2022-2032 (US$ Mn, AGR (%), CAGR (%)) (U-Shaped Recovery Scenario)
Table 12 Global Antibody Drug Conjugates Market Forecast, 2022-2032 (US$ Mn, AGR (%), CAGR (%)) (L-Shaped Recovery Scenario)
Table 13 Global Antibody Drug Conjugates Market by Region, 2022-2032 (US$ Mn, AGR (%), CAGR (%))
Table 14 Global Antibody Drug Conjugates Market by Region, 2022-2032 (US$ Mn, AGR (%), CAGR (%)) (V-Shaped Recovery Scenario)
Table 15 Global Antibody Drug Conjugates Market by Region, 2022-2032 (US$ Mn, AGR (%), CAGR (%)) (W-Shaped Recovery Scenario)
Table 16 Global Antibody Drug Conjugates Market by Region, 2022-2032 (US$ Mn, AGR (%), CAGR (%)) (U-Shaped Recovery Scenario)
Table 17 Global Antibody Drug Conjugates Market by Region, 2022-2032 (US$ Mn, AGR (%), CAGR (%)) (L-Shaped Recovery Scenario)
Table 18 Global Antibody Drug Conjugates Market by Technology, 2022-2032 (US$ Mn, AGR (%), CAGR (%))
Table 19 Global Cleavable Linkers Market Forecast, 2022-2032 (US$ Mn, AGR (%), CAGR (%))
Table 20 Global Cleavable Linkers Market by Region, 2022-2032 (US$ Mn, AGR (%), CAGR (%))
Table 21 Global Non-Cleavable Linkers Market Forecast, 2022-2032 (US$ Mn, AGR (%), CAGR (%))
Table 22 Global Non-Cleavable Linkers Market by Region, 2022-2032 (US$ Mn, AGR (%), CAGR (%))
Table 23 Global Other Technology Market Forecast, 2022-2032 (US$ Mn, AGR (%), CAGR (%))
Table 24 Global Other Technology Market by Region, 2022-2032 (US$ Mn, AGR (%), CAGR (%))
Table 25 Global Antibody Drug Conjugates Market by Payload Type, 2022-2032 (US$ Mn, AGR (%), CAGR (%))
Table 26 Global MMAE Market Forecast, 2022-2032 (US$ Mn, AGR (%), CAGR (%))
Table 27 Global MMAE Market by Region, 2022-2032 (US$ Mn, AGR (%), CAGR (%))
Table 28 Global DM4 Market Forecast, 2022-2032 (US$ Mn, AGR (%), CAGR (%))
Table 29 Global DM4 Market by Region, 2022-2032 (US$ Mn, AGR (%), CAGR (%))
Table 30 Global Camptothecin Market Forecast, 2022-2032 (US$ Mn, AGR (%), CAGR (%))
Table 31 Global Camptothecin Market by Region, 2022-2032 (US$ Mn, AGR (%), CAGR (%))
Table 32 Global DM1 Market Forecast, 2022-2032 (US$ Mn, AGR (%), CAGR (%))
Table 33 Global DM1 Market by Region, 2022-2032 (US$ Mn, AGR (%), CAGR (%))
Table 34 Global MMAF Market Forecast, 2022-2032 (US$ Mn, AGR (%), CAGR (%))
Table 35 Global MMAF Market by Region, 2022-2032 (US$ Mn, AGR (%), CAGR (%))
Table 36 Global Other Payload Type Market Forecast, 2022-2032 (US$ Mn, AGR (%), CAGR (%))
Table 37 Global Other Payload Type Market by Region, 2022-2032 (US$ Mn, AGR (%), CAGR (%))
Table 38 Global Antibody Drug Conjugates Market by Target Antigen, 2022-2032 (US$ Mn, AGR (%), CAGR (%))
Table 39 Global CD30 Market Forecast, 2022-2032 (US$ Mn, AGR (%), CAGR (%))
Table 40 Global CD30 Market by Region, 2022-2032 (US$ Mn, AGR (%), CAGR (%))
Table 41 Global HER2 Market Forecast, 2022-2032 (US$ Mn, AGR (%), CAGR (%))
Table 42 Global HER2 Market by Region, 2022-2032 (US$ Mn, AGR (%), CAGR (%))
Table 43 Global CD22 Market Forecast, 2022-2032 (US$ Mn, AGR (%), CAGR (%))
Table 44 Global CD22 Market by Region, 2022-2032 (US$ Mn, AGR (%), CAGR (%))
Table 45 Global CD33 Market Forecast, 2022-2032 (US$ Mn, AGR (%), CAGR (%))
Table 46 Global CD33 Market by Region, 2022-2032 (US$ Mn, AGR (%), CAGR (%))
Table 47 Global Other Target Antigen Market Forecast, 2022-2032 (US$ Mn, AGR (%), CAGR (%))
Table 48 Global Other Target Antigen Market by Region, 2022-2032 (US$ Mn, AGR (%), CAGR (%))
Table 49 Global Antibody Drug Conjugates Market by Linker Type, 2022-2032 (US$ Mn, AGR (%), CAGR (%))
Table 50 Global VC Market Forecast, 2022-2032 (US$ Mn, AGR (%), CAGR (%))
Table 51 Global VC Market by Region, 2022-2032 (US$ Mn, AGR (%), CAGR (%))
Table 52 Global Sulfo-SPDB Market Forecast, 2022-2032 (US$ Mn, AGR (%), CAGR (%))
Table 53 Global Sulfo-SPDB Market by Region, 2022-2032 (US$ Mn, AGR (%), CAGR (%))
Table 54 Global SMCC Market Forecast, 2022-2032 (US$ Mn, AGR (%), CAGR (%))
Table 55 Global SMCC Market by Region, 2022-2032 (US$ Mn, AGR (%), CAGR (%))
Table 56 Global VA Market Forecast, 2022-2032 (US$ Mn, AGR (%), CAGR (%))
Table 57 Global VA Market by Region, 2022-2032 (US$ Mn, AGR (%), CAGR (%))
Table 58 Global Hydrazone Market Forecast, 2022-2032 (US$ Mn, AGR (%), CAGR (%))
Table 59 Global Hydrazone Market by Region, 2022-2032 (US$ Mn, AGR (%), CAGR (%))
Table 60 Global Other Linker Type Market Forecast, 2022-2032 (US$ Mn, AGR (%), CAGR (%))
Table 61 Global Other Linker Type Market by Region, 2022-2032 (US$ Mn, AGR (%), CAGR (%))
Table 62 Global Antibody Drug Conjugates Market by Application, 2022-2032 (US$ Mn, AGR (%), CAGR (%))
Table 63 Global Blood Cancer Market Forecast, 2022-2032 (US$ Mn, AGR (%), CAGR (%))
Table 64 Global Blood Cancer Market by Region, 2022-2032 (US$ Mn, AGR (%), CAGR (%))
Table 65 Global Breast Cancer Market Forecast, 2022-2032 (US$ Mn, AGR (%), CAGR (%))
Table 66 Global Breast Cancer Market by Region, 2022-2032 (US$ Mn, AGR (%), CAGR (%))
Table 67 Global Ovarian Cancer Market Forecast, 2022-2032 (US$ Mn, AGR (%), CAGR (%))
Table 68 Global Ovarian Cancer Market by Region, 2022-2032 (US$ Mn, AGR (%), CAGR (%))
Table 69 Global Lung Cancer Market Forecast, 2022-2032 (US$ Mn, AGR (%), CAGR (%))
Table 70 Global Lung Cancer Market by Region, 2022-2032 (US$ Mn, AGR (%), CAGR (%))
Table 71 Global Brain Tumor Market Forecast, 2022-2032 (US$ Mn, AGR (%), CAGR (%))
Table 72 Global Brain Tumor Market by Region, 2022-2032 (US$ Mn, AGR (%), CAGR (%))
Table 73 Global Other Application Market Forecast, 2022-2032 (US$ Mn, AGR (%), CAGR (%))
Table 74 Global Other Application Market by Region, 2022-2032 (US$ Mn, AGR (%), CAGR (%))
Table 75 North America Antibody Drug Conjugates Market by Value, 2022-2032 (US$ Mn, AGR (%), CAGR (%))
Table 76 North America Antibody Drug Conjugates Market by Country, 2022-2032 (US$ Mn, AGR (%), CAGR (%))
Table 77 North America Antibody Drug Conjugates Market by Technology, 2022-2032 (US$ Mn, AGR (%), CAGR (%))
Table 78 North America Antibody Drug Conjugates Market by Payload Type, 2022-2032 (US$ Mn, AGR (%), CAGR (%))
Table 79 North America Antibody Drug Conjugates Market by Target Antigen, 2022-2032 (US$ Mn, AGR (%), CAGR (%))
Table 80 North America Antibody Drug Conjugates Market by Linker Type, 2022-2032 (US$ Mn, AGR (%), CAGR (%))
Table 81 North America Antibody Drug Conjugates Market by Application, 2022-2032 (US$ Mn, AGR (%), CAGR (%))
Table 82 US Antibody Drug Conjugates Market by Value, 2022-2032 (US$ Mn, AGR (%), CAGR (%))
Table 83 Canada Antibody Drug Conjugates Market by Value, 2022-2032 (US$ Mn, AGR (%), CAGR (%))
Table 84 Europe Antibody Drug Conjugates Market by Value, 2022-2032 (US$ Mn, AGR (%), CAGR (%))
Table 85 Europe Antibody Drug Conjugates Market by Country, 2022-2032 (US$ Mn, AGR (%), CAGR (%))
Table 86 Europe Antibody Drug Conjugates Market by Technology, 2022-2032 (US$ Mn, AGR (%), CAGR (%))
Table 87 Europe Antibody Drug Conjugates Market by Payload Type, 2022-2032 (US$ Mn, AGR (%), CAGR (%))
Table 88 Europe Antibody Drug Conjugates Market by Target Antigen, 2022-2032 (US$ Mn, AGR (%), CAGR (%))
Table 89 Europe Antibody Drug Conjugates Market by Linker Type, 2022-2032 (US$ Mn, AGR (%), CAGR (%))
Table 90 Europe Antibody Drug Conjugates Market by Application, 2022-2032 (US$ Mn, AGR (%), CAGR (%))
Table 91 Germany Antibody Drug Conjugates Market by Value, 2022-2032 (US$ Mn, AGR (%), CAGR (%))
Table 92 UK Antibody Drug Conjugates Market by Value, 2022-2032 (US$ Mn, AGR (%), CAGR (%))
Table 93 France Antibody Drug Conjugates Market by Value, 2022-2032 (US$ Mn, AGR (%), CAGR (%))
Table 94 Italy Antibody Drug Conjugates Market by Value, 2022-2032 (US$ Mn, AGR (%), CAGR (%))
Table 95 Russia Antibody Drug Conjugates Market by Value, 2022-2032 (US$ Mn, AGR (%), CAGR (%))
Table 96 Rest of Europe Antibody Drug Conjugates Market by Value, 2022-2032 (US$ Mn, AGR (%), CAGR (%))
Table 97 Asia-Pacific Antibody Drug Conjugates Market by Value, 2022-2032 (US$ Mn, AGR (%), CAGR (%))
Table 98 Asia-Pacific Antibody Drug Conjugates Market by Country, 2022-2032 (US$ Mn, AGR (%), CAGR (%))
Table 99 Asia-Pacific Antibody Drug Conjugates Market by Technology, 2022-2032 (US$ Mn, AGR (%), CAGR (%))
Table 100 Asia-Pacific Antibody Drug Conjugates Market by Payload Type, 2022-2032 (US$ Mn, AGR (%), CAGR (%))
Table 101 Asia-Pacific Antibody Drug Conjugates Market by Target Antigen, 2022-2032 (US$ Mn, AGR (%), CAGR (%))
Table 102 Asia-Pacific Antibody Drug Conjugates Market by Linker Type, 2022-2032 (US$ Mn, AGR (%), CAGR (%))
Table 103 Asia-Pacific Antibody Drug Conjugates Market by Application, 2022-2032 (US$ Mn, AGR (%), CAGR (%))
Table 104 China Antibody Drug Conjugates Market by Value, 2022-2032 (US$ Mn, AGR (%), CAGR (%))
Table 105 India Antibody Drug Conjugates Market by Value, 2022-2032 (US$ Mn, AGR (%), CAGR (%))
Table 106 Japan Antibody Drug Conjugates Market by Value, 2022-2032 (US$ Mn, AGR (%), CAGR (%))
Table 107 South Korea Antibody Drug Conjugates Market by Value, 2022-2032 (US$ Mn, AGR (%), CAGR (%))
Table 108 Australia Antibody Drug Conjugates Market by Value, 2022-2032 (US$ Mn, AGR (%), CAGR (%))
Table 109 Rest of Asia-Pacific Antibody Drug Conjugates Market by Value, 2022-2032 (US$ Mn, AGR (%), CAGR (%))
Table 110 Middle East & Africa Antibody Drug Conjugates Market by Value, 2022-2032 (US$ Mn, AGR (%), CAGR (%))
Table 111 Middle East & Africa Antibody Drug Conjugates Market by Country, 2022-2032 (US$ Mn, AGR (%), CAGR (%))
Table 112 Middle East & Africa Antibody Drug Conjugates Market by Technology, 2022-2032 (US$ Mn, AGR (%), CAGR (%))
Table 113 Middle East & Africa Antibody Drug Conjugates Market by Payload Type, 2022-2032 (US$ Mn, AGR (%), CAGR (%))
Table 114 Middle East & Africa Antibody Drug Conjugates Market by Target Antigen, 2022-2032 (US$ Mn, AGR (%), CAGR (%))
Table 115 Middle East & Africa Antibody Drug Conjugates Market by Linker Type, 2022-2032 (US$ Mn, AGR (%), CAGR (%))
Table 116 Middle East & Africa Antibody Drug Conjugates Market by Application, 2022-2032 (US$ Mn, AGR (%), CAGR (%))
Table 117 South Africa Antibody Drug Conjugates Market by Value, 2022-2032 (US$ Mn, AGR (%), CAGR (%))
Table 118 Saudi Arabia Antibody Drug Conjugates Market by Value, 2022-2032 (US$ Mn, AGR (%), CAGR (%))
Table 119 UAE Antibody Drug Conjugates Market by Value, 2022-2032 (US$ Mn, AGR (%), CAGR (%))
Table 120 Rest of Middle East & Africa Antibody Drug Conjugates Market by Value, 2022-2032 (US$ Mn, AGR (%), CAGR (%))
Table 121 South America Antibody Drug Conjugates Market by Value, 2022-2032 (US$ Mn, AGR (%), CAGR (%))
Table 122 South America Antibody Drug Conjugates Market by Country, 2022-2032 (US$ Mn, AGR (%), CAGR (%))
Table 123 South America Antibody Drug Conjugates Market by Technology, 2022-2032 (US$ Mn, AGR (%), CAGR (%))
Table 124 South America Antibody Drug Conjugates Market by Payload Type, 2022-2032 (US$ Mn, AGR (%), CAGR (%))
Table 125 South America Antibody Drug Conjugates Market by Target Antigen, 2022-2032 (US$ Mn, AGR (%), CAGR (%))
Table 126 South America Antibody Drug Conjugates Market by Linker Type, 2022-2032 (US$ Mn, AGR (%), CAGR (%))
Table 127 South America Antibody Drug Conjugates Market by Application, 2022-2032 (US$ Mn, AGR (%), CAGR (%))
Table 128 Brazil Antibody Drug Conjugates Market by Value, 2022-2032 (US$ Mn, AGR (%), CAGR (%))
Table 129 Mexico Antibody Drug Conjugates Market by Value, 2022-2032 (US$ Mn, AGR (%), CAGR (%))
Table 130 Rest of South America Antibody Drug Conjugates Market by Value, 2022-2032 (US$ Mn, AGR (%), CAGR (%))
Table 131 Key Business Strategies Adopted by Key Players in Global Antibody Drug Conjugates Market
Table 132 Key Business Strategies Adopted by Key Players in Global Antibody Drug Conjugates Market
Table 133 Key Business Strategies Adopted by Key Players in Global Antibody Drug Conjugates Market
Table 134 Key Business Strategies Adopted by Key Players in Global Antibody Drug Conjugates Market
Table 135 Key Business Strategies Adopted by Key Players in Global Antibody Drug Conjugates Market
Table 136 Key Business Strategies Adopted by Key Players in Global Antibody Drug Conjugates Market
Table 137 Key Business Strategies Adopted by Key Players in Global Antibody Drug Conjugates Market
Table 138 Key Business Strategies Adopted by Key Players in Global Antibody Drug Conjugates Market
Table 139 Key Business Strategies Adopted by Key Players in Global Antibody Drug Conjugates Market
Table 140 Abbvie Inc. Company: Key Details, (CEO, HQ, Revenue, Founded, No. of Employees, Company Type, Website, Business Segment)
Table 141 Abbvie Inc. Company: Product Benchmarking
Table 142 Abbvie Inc. Company: Strategic Outlook
Table 143 Astellas Pharma Inc.: Key Details, (CEO, HQ, Revenue, Founded, No. of Employees, Company Type, Website, Business Segment)
Table 144 Astellas Pharma Inc.: Product Benchmarking
Table 145 Astellas Pharma Inc.: Strategic Outlook
Table 146 Bayer AG: Key Details, (CEO, HQ, Revenue, Founded, No. of Employees, Company Type, Website, Business Segment)
Table 147 Bayer AG: Product Benchmarking
Table 148 Bayer AG: Strategic Outlook
Table 149 Celldex Therapeutics, Inc.: Key Details, (CEO, HQ, Revenue, Founded, No. of Employees, Company Type, Website, Business Segment)
Table 150 Celldex Therapeutics, Inc.: Product Benchmarking
Table 151 Celldex Therapeutics, Inc.: Strategic Outlook
Table 152 Genentech, Inc.: Key Details, (CEO, HQ, Revenue, Founded, No. of Employees, Company Type, Website, Business Segment)
Table 153 Genentech, Inc.: Product Benchmarking
Table 154 Genentech, Inc.: Strategic Outlook
Table 155 ImmunoGen, Inc.: Key Details, (CEO, HQ, Revenue, Founded, No. of Employees, Company Type, Website, Business Segment)
Table 156 ImmunoGen, Inc.: Product Benchmarking
Table 157 ImmunoGen, Inc.: Strategic Outlook
Table 158 Gilead Sciences, Inc.: Key Details, (CEO, HQ, Revenue, Founded, No. of Employees, Company Type, Website, Business Segment)
Table 159 Gilead Sciences, Inc.: Product Benchmarking
Table 160 Gilead Sciences, Inc.: Strategic Outlook
Table 161 Lonza Group AG: Key Details, (CEO, HQ, Revenue, Founded, No. of Employees, Company Type, Website, Business Segment)
Table 162 Lonza Group AG: Product Benchmarking
Table 163 Lonza Group AG: Strategic Outlook
Table 164 Mersana Therapeutics Inc.: Key Details, (CEO, HQ, Revenue, Founded, No. of Employees, Company Type, Website, Business Segment)
Table 165 Mersana Therapeutics Inc.: Product Benchmarking
Table 166 Mersana Therapeutics Inc.: Strategic Outlook
Table 167 Takeda Pharmaceutical Company Limited: Key Details, (CEO, HQ, Revenue, Founded, No. of Employees, Company Type, Website, Business Segment)
Table 168 Takeda Pharmaceutical Company Limited: Product Benchmarking
Table 169 Takeda Pharmaceutical Company Limited: Strategic Outlook
Table 170 Pfizer Inc.: Key Details, (CEO, HQ, Revenue, Founded, No. of Employees, Company Type, Website, Business Segment)
Table 171 Pfizer Inc.: Product Benchmarking
Table 172 Pfizer Inc.: Strategic Outlook
Table 173 F. Hoffmann-La Roche Ltd: Key Details, (CEO, HQ, Revenue, Founded, No. of Employees, Company Type, Website, Business Segment)
Table 174 F. Hoffmann-La Roche Ltd: Product Benchmarking
Table 175 F. Hoffmann-La Roche Ltd: Strategic Outlook
Table 176 Lantheus Holdings, Inc.: Key Details, (CEO, HQ, Revenue, Founded, No. of Employees, Company Type, Website, Business Segment)
Table 177 Lantheus Holdings, Inc.: Product Benchmarking
Table 178 Lantheus Holdings, Inc.: Strategic Outlook
Table 179 Seagen Inc.: Key Details, (CEO, HQ, Revenue, Founded, No. of Employees, Company Type, Website, Business Segment)
Table 180 Seagen Inc.: Product Benchmarking
Table 181 Seagen Inc.: Strategic Outlook
Table 182 Merck KGaA: Key Details, (CEO, HQ, Revenue, Founded, No. of Employees, Company Type, Website, Business Segment)
Table 183 Merck KGaA: Product Benchmarking
Table 184 Merck KGaA: Strategic Outlook
List of Figures
Figure 1 Global Antibody Drug Conjugates Market Segmentation
Figure 2 Global Antibody Drug Conjugates Market Forecast by Region: Market Attractiveness Index
Figure 3 Global Antibody Drug Conjugates Market by Technology: Market Attractiveness Index
Figure 4 Global Antibody Drug Conjugates Market by Payload Type: Market Attractiveness Index
Figure 5 Global Antibody Drug Conjugates Market by Target Antigen: Market Attractiveness Index
Figure 6 Global Antibody Drug Conjugates Market by Linker Type: Market Attractiveness Index
Figure 7 Global Antibody Drug Conjugates Market by Application: Market Attractiveness Index
Figure 8 Global Antibody Drug Conjugates Market: Market Dynamics
Figure 9 Global COVID Impact Analysis: Antibody Drug Conjugates Market Recovery Scenarios
Figure 10 Global Antibody Drug Conjugates Market by Region, 2022-2032 (US$ Mn ,AGR (%)) (V – Shaped Recovery)
Figure 11 Global Antibody Drug Conjugates Market by Region, 2022-2032 (US$ Mn ,AGR (%)) (U – Shaped Recovery)
Figure 12 Global Antibody Drug Conjugates Market by Region, 2022-2032 (US$ Mn, AGR (%)) (W – Shaped Recovery)
Figure 13 Global Antibody Drug Conjugates Market by Region, 2022-2032 (US$ Mn, AGR (%)) (L – Shaped Recovery)
Figure 14 Global Antibody Drug Conjugates Market: Porter’s Five Forces Analysis
Figure 15 Global Antibody Drug Conjugates Market: PESTLE Analysis
Figure 16 Global Antibody Drug Conjugates Market Forecast by Region 2022 to 2032 (Revenue, CAGR %)
Figure 17 Global Antibody Drug Conjugates Market Forecast by Region 2022, 2027, 2032 (Revenue, Market Share %)
Figure 18 Global Antibody Drug Conjugates Market by Value, 2022-2032 (US$ Mn, AGR (%))
Figure 19 Global Antibody Drug Conjugates Market by Value, 2022-2032 (US$ Mn, AGR (%)) (V – Shaped Recovery)
Figure 20 Global Antibody Drug Conjugates Market by Value, 2022-2032 (US$ Mn, AGR (%)) (W – Shaped Recovery)
Figure 21 Global Antibody Drug Conjugates Market by Value, 2022-2032 (US$ Mn, AGR (%)) (U – Shaped Recovery)
Figure 22 Global Antibody Drug Conjugates Market by Value, 2022-2032 (US$ Mn, AGR (%)) (L – Shaped Recovery)
Figure 23 Global Antibody Drug Conjugates Market by Region, 2022-2032 (US$ Mn, AGR (%))
Figure 24 Global Antibody Drug Conjugates KKK Market by Region, 2022-2032 (US$ Mn, AGR (%)) (V – Shaped Recovery)
Figure 25 Global Antibody Drug Conjugates Market by Region, 2022-2032 (US$ Mn, AGR (%)) (W – Shaped Recovery)
Figure 26 Global Antibody Drug Conjugates KKK Market by Region, 2022-2032 (US$ Mn, AGR (%)) (U – Shaped Recovery)
Figure 27 Global Antibody Drug Conjugates Market by Region, 2022-2032 (US$ Mn, AGR (%)) (L – Shaped Recovery)
Figure 28 Global Antibody Drug Conjugates by Technology Market Attractiveness Index
Figure 29 Global Antibody Drug Conjugates Market Forecast by Technology 2022, 2032 (Revenue, Market Share %)
Figure 30 Global Antibody Drug Conjugates Market by Technology, 2022-2032 (US$ Mn, AGR (%), CAGR (%))
Figure 31 Global Cleavable Linkers Market Forecast, 2022-2032, 2022-2032 (US$ Mn, AGR (%))
Figure 32 Global Cleavable Linkers Market by Region, 2022-2032 (US$ Mn)
Figure 33 Global Non-Cleavable Linkers Market Forecast, 2022-2032 (US$ Mn)
Figure 34 Global Non-Cleavable Linkers Market by Region,, 2022-2032, 2022-2032 (US$ Mn)
Figure 35 Global Other Technology Market by Region, 2022-2032, 2022-2032 (US$ Mn)
Figure 36 Global Other Technology Market by Region, 2022-2032, 2022-2032 (US$ Mn)
Figure 37 Global Antibody Drug Conjugates by Payload Type Market Attractiveness Index
Figure 38 Global Antibody Drug Conjugates Market Forecast by Payload Type 2022, 2032 (Revenue, Market Share (%))
Figure 39 Global Antibody Drug Conjugates Market by Payload Type, 2022-2032 (US$ Mn, AGR (%))
Figure 40 Global MMAE Market Forecast, 2022-2032, 2022-2032 (US$ Mn)
Figure 41 Global MMAE Market by Region, 2022-2032, 2022-2032 (US$ Mn)
Figure 42 Global DM4 Market Forecast, 2022-2032, 2022-2032 (US$ Mn)
Figure 43 Global DM4 Market by Region, 2022-2032, 2022-2032 (US$ Mn)
Figure 44 Global Camptothecin Market Forecast, 2022-2032, (US$ Mn)
Figure 45 Global Camptothecin Market by Region, 2022-2032, 2022-2032 (US$ Mn)
Figure 46 Global DM1 Market Forecast 2022-2032, 2022-2032 (US$ Mn)
Figure 47 Global DM1 Market Forecast 2022-2032, 2022-2032 (US$ Mn)
Figure 48 Global MMAF Market Forecast, 2022-2032, 2022-2032 (US$ Mn)
Figure 49 Global MMAF Market by Region 2022-2032, 2022-2032 (US$ Mn)
Figure 50 Global Other Payload Type Market Forecast 2022-2032, 2022-2032 (US$ Mn)
Figure 51 Global Other Payload Type Market by Region 2022-2032, 2022-2032 (US$ Mn)
Figure 52 Global Antibody Drug Conjugates by Target Antigen Market Attractiveness Index
Figure 53 Global Antibody Drug Conjugates Market Forecast by Target Antigen 2022, 2032 (Revenue, Market Share %)
Figure 54 Global Antibody Drug Conjugates Market by Target Antigen, 2022-2032 (US$ Mn, AGR (%))
Figure 55 Global CD30 Market Forecast 2022-2032, 2022-2032 (US$ Mn)
Figure 56 Global CD30 Market by Region 2022-2032, 2022-2032 (US$ Mn)
Figure 57 Global HER2 Market Forecast 2022-2032, 2022-2032 (US$ Mn)
Figure 58 Global HER2 Market by Region 2022-2032, 2022-2032 (US$ Mn)
Figure 59 Global CD22 Market Forecast 2022-2032, 2022-2032 (US$ Mn)
Figure 60 Global CD22 Market by Region 2022-2032, 2022-2032 (US$ Mn)
Figure 61 Global CD33 Market Forecast 2022-2032, 2022-2032 (US$ Mn)
Figure 62 Global CD33 Market by Region 2022-2032, 2022-2032 (US$ Mn)
Figure 63 Global Other Target Antigen Market Forecast 2022-2032, 2022-2032 (US$ Mn)
Figure 64 Global Other Target Antigen Market by Region 2022-2032, 2022-2032 (US$ Mn)
Figure 65 Global Antibody Drug Conjugates by Linker Type Market Attractiveness Index
Figure 66 Global Antibody Drug Conjugates Market Forecast by Linker Type 2022, 2032 (Revenue, Market Share %)
Figure 67 Global Antibody Drug Conjugates Market by Linker Type, 2022-2032 (US$ Mn)
Figure 68 Global VC Market Forecast 2022-2032, 2022-2032 (US$ Mn)
Figure 69 Global VC Market by Region 2022-2032, 2022-2032 (US$ Mn)
Figure 70 Global Sulfo-SPDB Market Forecast 2022-2032, 2022-2032 (US$ Mn)
Figure 71 Global Sulfo-SPDB Market by Region 2022-2032, 2022-2032 (US$ Mn)
Figure 72 Global SMCC Market Forecast 2022-2032, 2022-2032 (US$ Mn)
Figure 73 Global SMCC Market by Region, 2022-2032 (US$ Mn, AGR (%), CAGR (%))2022-2032, 2022-2032 (US$ Mn)
Figure 74 Global VA Market Forecast, 2022-2032 (US$ Mn)
Figure 75 Global VA Market by Region, 2022-2032 (US$ Mn)
Figure 76 Global VA Market by Region, 2022-2032 (US$ Mn)
Figure 77 Global Hydrazone Market by Region, 2022-2032 (US$ Mn)
Figure 78 Global Other Linker Type Market Forecast, 2022-2032 (US$ Mn)
Figure 79 Global Other Linker Type Market by Region, 2022-2032, 2022-2032 (US$ Mn)
Figure 80 Global Antibody Drug Conjugates by Application Market Attractiveness Index
Figure 81 Global Antibody Drug Conjugates Market Forecast by Application 2022, 2032 (Market Share %)
Figure 82 Global Antibody Drug Conjugates Market by Application, 2022-2032 (US$ Mn)
Figure 83 Global Blood Cancer Market Forecast, 2022-2032 (US$ Mn)
Figure 84 Global Blood Cancer Market by Region, 2022-2032 (US$ Mn)
Figure 85 Global Breast Cancer Market Forecast, 2022-2032 (US$ Mn)
Figure 86 Global Breast Cancer Market by Region, 2022-2032 (US$ Mn)
Figure 87 Global Ovarian Cancer Market Forecast, 2022-2032 (US$ Mn)
Figure 88 Global Ovarian Cancer Market by Region, 2022-2032 (US$ Mn)
Figure 89 Global Lung Cancer Market Forecast, 2022-2032 (US$ Mn)
Figure 90 Global Lung Cancer Market by Region, 2022-2032 (US$ Mn)
Figure 91 Global Brain Tumor Market Forecast, 2022-2032 (US$ Mn)
Figure 92 Global Brain Tumor Market by Region, 2022-2032 (US$ Mn)
Figure 93 Global Other Application Market Forecast, 2022-2032 (US$ Mn)
Figure 94 Global Other Application Market by Region, 2022-2032 (US$ Mn)
Figure 95 North America Antibody Drug Conjugates Market Attractiveness Index
Figure 96 North America Antibody Drug Conjugates Market Forecast by Value, 2022-2032 (US$ million, AGR (%))
Figure 97 North America Antibody Drug Conjugates Market Forecast by Country, 2022-2032 (US$ million, AGR (%))
Figure 98 North America Antibody Drug Conjugates Market Share Forecast by Country, 2022 & 2032 (%)
Figure 99 North America Antibody Drug Conjugates Market Forecast by Technology, 2022-2032 (US$ million, AGR (%))
Figure 100 North America Antibody Drug Conjugates Market Share Forecast by Technology, 2022 & 2032 (%)
Figure 101 North America Antibody Drug Conjugates Market Forecast by Payload Type, 2022-2032 (US$ million, AGR (%))
Figure 102 North America Antibody Drug Conjugates Market Share Forecast by Payload Type, 2022 & 2032 (%)
Figure 103 North America Antibody Drug Conjugates Market Forecast by Target Antigen, 2022-2032 (US$ million, AGR (%))
Figure 104 North America Antibody Drug Conjugates Market Share Forecast by Target Antigen, 2022 & 2032 (%)
Figure 105 North America Antibody Drug Conjugates Market Forecast by Linker Type, 2022-2032 (US$ million, AGR %)
Figure 106 North America Antibody Drug Conjugates Market Share Forecast by Linker Type, 2022 & 2032 (%)
Figure 107 North America Antibody Drug Conjugates Market Forecast by Application, 2022-2032 (US$ million, AGR (%))
Figure 108 North America Antibody Drug Conjugates Market Share Forecast by Application, 2022 & 2032 (%)
Figure 109 U.S. Antibody Drug Conjugates Market Forecast by Value, 2022-2032 (US$ million, AGR (%))
Figure 110 Canada Antibody Drug Conjugates Market Forecast by Value, 2022-2032 (US$ million, AGR (%))
Figure 111 Europe Antibody Drug Conjugates Market Attractiveness Index
Figure 112 Europe Antibody Drug Conjugates Market Forecast by Value, 2022-2032 (US$ million, AGR (%))
Figure 113 Europe Antibody Drug Conjugates Market Forecast by Country, 2022-2032 (US$ million, AGR (%))
Figure 114 Europe Antibody Drug Conjugates Market Share Forecast by Country, 2022 & 2032 (%)
Figure 115 Europe Antibody Drug Conjugates Market Forecast by Technology, 2022-2032 (US$ million, AGR (%))
Figure 116 Europe Antibody Drug Conjugates Market Share Forecast by Technology, 2022 & 2032 (%)
Figure 117 Europe Antibody Drug Conjugates Market Forecast by Payload Type, 2022-2032 (US$ million, AGR (%))
Figure 118 Europe Antibody Drug Conjugates Market Share Forecast by Payload Type, 2022 & 2032 (%)
Figure 119 Europe Antibody Drug Conjugates Market Forecast by Target Antigen, 2022-2032 (US$ million, AGR (%))
Figure 120 Europe Antibody Drug Conjugates Market Share Forecast by Target Antigen, 2022 & 2032 (%)
Figure 121 Europe Antibody Drug Conjugates Market Forecast by Linker Type, 2022-2032 (US$ million, AGR (%))
Figure 122 Europe Antibody Drug Conjugates Market Share Forecast by Linker Type, 2022 & 2032 (%)
Figure 123 Europe Antibody Drug Conjugates Market Forecast by Application, 2022-2032 (US$ million, AGR (%))
Figure 124 Europe Antibody Drug Conjugates Market Share Forecast by Application, 2022 & 2032 (%)
Figure 125 Germany Antibody Drug Conjugates Market Forecast by Value, 2022-2032 (US$ million, AGR (%))
Figure 126 U.K. Antibody Drug Conjugates Market Forecast by Value, 2022-2032 (US$ million, AGR (%))
Figure 127 France Antibody Drug Conjugates Market Forecast by Value, 2022-2032 (US$ million, AGR (%))
Figure 128 Italy Antibody Drug Conjugates Market Forecast by Value, 2022-2032 (US$ million, AGR (%))
Figure 129 Russia Antibody Drug Conjugates Market Forecast by Value, 2022-2032 (US$ million, AGR (%))
Figure 130 Rest Of Europe Antibody Drug Conjugates Market Forecast by Value, 2022-2032 (US$ million, AGR (%))
Figure 131 Asia-Pacific Antibody Drug Conjugates Market Attractiveness Index
Figure 132 Asia-Pacific Antibody Drug Conjugates Market Forecast by Value, 2022-2032 (US$ million, AGR (%))
Figure 133 Asia-Pacific Antibody Drug Conjugates Market Forecast by Country, 2022-2032 (US$ million, AGR (%))
Figure 134 Asia-Pacific Antibody Drug Conjugates Market Share Forecast by Country, 2022 & 2032 (%)
Figure 135 Asia-Pacific Antibody Drug Conjugates Market Forecast by Technology, 2022-2032 (US$ million, AGR (%))
Figure 136 Asia-Pacific Antibody Drug Conjugates Market Share Forecast by Technology, 2022 & 2032 (%)
Figure 137 Asia-Pacific Antibody Drug Conjugates Market Forecast by Payload Type, 2022-2032 (US$ million, AGR (%))
Figure 138 Asia-Pacific Antibody Drug Conjugates Market Share Forecast by Payload Type, 2022 & 2032 (%)
Figure 139 Asia-Pacific Antibody Drug Conjugates Market Forecast by Target Antigen, 2022-2032 (US$million, AGR (%))
Figure 140 Asia-Pacific Antibody Drug Conjugates Market Share Forecast by Target Antigen, 2022 & 2032 (%)
Figure 141 Asia-Pacific Antibody Drug Conjugates Market Forecast by Linker Type, 2022-2032 (US$million, AGR (%))
Figure 142 Asia-Pacific Antibody Drug Conjugates Market Share Forecast by Linker Type, 2022 & 2032 (%)
Figure 143 Asia-Pacific Antibody Drug Conjugates Market Forecast by Application, 2022-2032 (US$million, AGR (%))
Figure 144 Asia-Pacific Antibody Drug Conjugates Market Share Forecast by Application, 2022 & 2032 (%)
Figure 145 China Antibody Drug Conjugates Market Forecast by Value, 2022-2032 (US$million, AGR (%))
Figure 146 India Antibody Drug Conjugates Market Forecast by Value, 2022-2032 (US$million, AGR (%))
Figure 147 Japan Antibody Drug Conjugates Market Forecast by Value, 2022-2032 (US$million, AGR (%))
Figure 148 South Korea Antibody Drug Conjugates Market Forecast by Value, 2022-2032 (US$million, AGR (%))
Figure 149 Australia Antibody Drug Conjugates Market Forecast by Value, 2022-2032 (US$million, AGR (%))
Figure 150 Rest of Asia-Pacific Antibody Drug Conjugates Market Forecast by Value, 2022-2032 (US$million, AGR (%))
Figure 151 Middle East & Africa Antibody Drug Conjugates Market Attractiveness Index
Figure 152 Middle East & Africa Antibody Drug Conjugates Market Forecast by Value, 2022-2032 (US$million, AGR (%))
Figure 153 Middle East & Africa Antibody Drug Conjugates Market Forecast by Country, 2022-2032 (US$million, AGR (%))
Figure 154 Middle East & Africa Antibody Drug Conjugates Market Share Forecast by Country, 2022 & 2032 (%)
Figure 155 Middle East & Africa Antibody Drug Conjugates Market Forecast by Technology, 2022-2032 (US$million, AGR (%))
Figure 156 Middle East & Africa Antibody Drug Conjugates Market Share Forecast by Technology, 2022 & 2032 (%)
Figure 157 Middle East & Africa Antibody Drug Conjugates Market Forecast by Payload Type, 2022-2032 (US$million, AGR (%))
Figure 158 Middle East & Africa Antibody Drug Conjugates Market Share Forecast by Payload Type, 2022 & 2032 (%)
Figure 159 Middle East & Africa Antibody Drug Conjugates Market Forecast by Target Antigen, 2022-2032 (US$million, AGR (%))
Figure 160 Middle East & Africa Antibody Drug Conjugates Market Share Forecast by Target Antigen, 2022 & 2032 (%)
Figure 161 Middle East & Africa Antibody Drug Conjugates Market Forecast by Linker Type, 2022-2032 (US$million, AGR (%))
Figure 162 Middle East & Africa Antibody Drug Conjugates Market Share Forecast by Linker Type, 2022 & 2032 (%)
Figure 163 Middle East & Africa Antibody Drug Conjugates Market Forecast by Application, 2022-2032 (US$million, AGR (%))
Figure 164 Middle East & Africa Antibody Drug Conjugates Market Share Forecast by Application, 2022 & 2032 (%)
Figure 165 South Africa Antibody Drug Conjugates Market Forecast by Value, 2022-2032 (US$million, AGR (%))
Figure 166 Saudi Arabia Antibody Drug Conjugates Market Forecast by Value, 2022-2032 (US$million, AGR (%))
Figure 167 U.A.E. Antibody Drug Conjugates Market Forecast by Value, 2022-2032 (US$million, AGR (%))
Figure 168 Rest Of Middle East & Africa Antibody Drug Conjugates Market Forecast by Value, 2022-2032 (US$million, AGR (%))
Figure 169 South America Antibody Drug Conjugates Market Attractiveness Index
Figure 170 South America Antibody Drug Conjugates Market Forecast by Value, 2022-2032 (US$million, AGR (%))
Figure 171 South America Antibody Drug Conjugates Market Forecast by Country, 2022-2032 (US$million, AGR (%))
Figure 172 South America Antibody Drug Conjugates Market Share Forecast by Country, 2022 & 2032 (%)
Figure 173 South America Antibody Drug Conjugates Market Forecast by Technology, 2022-2032 (US$million, AGR (%))
Figure 174 South America Antibody Drug Conjugates Market Share Forecast by Technology, 2022 & 2032 (%)
Figure 175 South America Antibody Drug Conjugates Market Forecast by Payload Type, 2022-2032 (US$million, AGR (%))
Figure 176 South America Antibody Drug Conjugates Market Share Forecast by Payload Type, 2022 & 2032 (%)
Figure 177 South America Antibody Drug Conjugates Market Forecast by Target Antigen, 2022-2032 (US$million, AGR (%))
Figure 178 South America Antibody Drug Conjugates Market Share Forecast by Target Antigen, 2022 & 2032 (%)
Figure 179 South America Antibody Drug Conjugates Market Forecast by Linker Type, 2022-2032 (US$million, AGR (%))
Figure 180 South America Antibody Drug Conjugates Market Share Forecast by Linker Type, 2022 & 2032 (%)
Figure 181 South America Antibody Drug Conjugates Market Forecast by Application, 2022-2032 (US$million, AGR (%))
Figure 182 South America Antibody Drug Conjugates Market Share Forecast by Application, 2022 & 2032 (%)
Figure 183 Brazil Antibody Drug Conjugates Market Forecast by Value, 2022-2032 (US$million, AGR (%))
Figure 184 Mexico Antibody Drug Conjugates Market Forecast by Value, 2022-2032 (US$million, AGR (%))
Figure 185 Rest Of South America Antibody Drug Conjugates Market Forecast by Value, 2022-2032 (US$million, AGR (%))
Figure 186 Global Antibody Drug Conjugates Market: Company Share Analysis, 2021
Figure 187 Abbvie Inc. Company: Net Revenue, 2017-2021 (US$ million, AGR(%))
Figure 188 Abbvie Inc. Company: Gross Profit, 2017-2021 (US$ million, AGR (%))
Figure 189 Abbvie Inc. Company: R&D, 2017-2021 (US$ million, AGR (%))
Figure 190 Abbvie Inc. Company: EBITDA, 2017-2021 (US$ million, AGR (%))
Figure 191 Astellas Pharma Inc.: Net Revenue, 2017-2021 (US$ million, AGR(%))
Figure 192 Astellas Pharma Inc.: Gross Profit, 2017-2021 (US$ million, AGR(%))
Figure 193 Astellas Pharma Inc.: R&D, 2017-2021 (US$ million, AGR (%))
Figure 194 Astellas Pharma Inc.: EBITDA, 2017-2021 (US$ million, AGR (%))
Figure 195 Bayer AG: Net Revenue, 2017-2021 (US$ million, AGR (%))
Figure 196 Bayer AG: Gross Profit, 2017-2021 (US$ million, AGR (%))
Figure 197 Bayer AG: R&D, 2017-2021 (US$ million, AGR (%))
Figure 198 Bayer AG: EBITDA, 2017-2021 (US$ million, AGR (%))
Figure 199 Celldex Therapeutics, Inc.: Net Revenue, 2017-2021 (US$ million, AGR(%))
Figure 200 Celldex Therapeutics, Inc.: Gross Profit, 2017-2021 (US$ million, AGR(%))
Figure 201 Celldex Therapeutics, Inc.: R&D, 2017-2021 (US$ million, AGR(%))
Figure 202 Celldex Therapeutics, Inc.: EBITDA, 2017-2021 (US$ million, AGR (%))
Figure 203 ImmunoGen, Inc.: Net Revenue, 2017-2021 (US$ million, AGR (%))
Figure 204 ImmunoGen, Inc.: Gross Profit, 2017-2021 (US$ million, AGR (%))
Figure 205 ImmunoGen, Inc.: R&D, 2017-2021 (US$ million, AGR (%))
Figure 206 ImmunoGen, Inc.: EBITDA, 2017-2021 (US$ million, AGR (%))
Figure 207 Gilead Sciences, Inc.: Net Revenue, 2017-2021 (US$ million, AGR (%))
Figure 208 Gilead Sciences, Inc.: Gross Profit, 2017-2021 (US$ million, AGR (%))
Figure 209 Gilead Sciences, Inc.: R&D, 2017-2021 (US$ million, AGR (%))
Figure 210 Gilead Sciences, Inc.: EBITDA, 2017-2021 (US$ million, AGR (%))
Figure 211 Lonza Group AG: Net Revenue, 2017-2021 (US$ million, AGR(%))
Figure 212 Lonza Group AG: Gross Profit, 2017-2021 (US$ million, AGR(%))
Figure 213 Lonza Group AG: R&D, 2017-2021 (US$ million, AGR(%))
Figure 214 Lonza Group AG: EBITDA, 2017-2021 (US$ million, AGR(%))
Figure 215 Mersana Therapeutics Inc.: Net Revenue, 2017-2021 (US$ million, AGR(%))
Figure 216 Mersana Therapeutics Inc.: Gross Profit, 2017-2021 (US$ million, AGR(%))
Figure 217 Mersana Therapeutics Inc.: R&D, 2017-2021 (US$ million, AGR (%))
Figure 218 Mersana Therapeutics Inc.: EBITDA, 2017-2021 (US$ million, AGR (%))
Figure 219 Takeda Pharmaceutical Company Limited: Net Revenue, 2017-2021 (US$ million, AGR (%))
Figure 220 Takeda Pharmaceutical Company Limited: Gross Profit, 2017-2021 (US$ million, AGR (%))
Figure 221 Takeda Pharmaceutical Company Limited: R&D, 2017-2021 (US$ million, AGR (%))
Figure 222 Takeda Pharmaceutical Company Limited: EBITDA, 2017-2021 (US$ million, AGR (%))
Figure 223 Pfizer Inc.: Net Revenue, 2017-2021 (US$ million, AGR(%))
Figure 224 Pfizer Inc.: Gross Profit, 2017-2021 (US$ million, AGR(%))
Figure 225 Pfizer Inc.: R&D, 2017-2021 (US$ million, AGR (%))
Figure 226 Pfizer Inc.: EBITDA, 2017-2021 (US$ million, AGR (%))
Figure 227 F. Hoffmann-La Roche Ltd: Net Revenue, 2017-2021 (US$ million, AGR(%))
Figure 228 F. Hoffmann-La Roche Ltd: Gross Profit, 2017-2021 (US$ million, AGR(%))
Figure 229 F. Hoffmann-La Roche Ltd: R&D, 2017-2021 (US$ million, AGR(%))
Figure 230 F. Hoffmann-La Roche Ltd: EBITDA, 2017-2021 (US$ million, AGR(%))
Figure 231 Lantheus Holdings, Inc.: Net Revenue, 2017-2021 (US$ million, AGR(%))
Figure 232 Lantheus Holdings, Inc.: Gross Profit, 2017-2021 (US$ million, AGR(%))
Figure 233 Lantheus Holdings, Inc.: R&D, 2017-2021 (US$ million, AGR(%))
Figure 234 Lantheus Holdings, Inc.: EBITDA, 2017-2021 (US$ million, AGR(%))
Figure 235 Seagen Inc.: Net Revenue, 2017-2021 (US$ million, AGR(%))
Figure 236 Seagen Inc.: Gross Profit, 2017-2021 (US$ million, AGR(%))
Figure 237 Seagen Inc.: R&D, 2017-2021 (US$ million, AGR(%))
Figure 238 Seagen Inc.: EBITDA, 2017-2021 (US$ million, AGR(%))
Figure 239 Merck KGaA: Net Revenue, 2017-2021 (US$ million, AGR(%))
Figure 240 Merck KGaA: Gross Profit, 2017-2021 (US$ million, AGR(%))
Figure 241 Merck KGaA: R&D, 2017-2021 (US$ million, AGR(%))
Figure 242 Merck KGaA: EBITDA, 2017-2021 (US$ million, AGR(%))
ページTOPに戻る
- 本レポートと同じKEY WORDの最新刊レポートはありません。
よくあるご質問
Visiongain社はどのような調査会社ですか?
英国の調査会社ヴィジョンゲイン社(Visiongain)は、通信とエネルギーのほか、自動車や化学・医薬品、金属など、広範な市場を対象に調査を行っています。自動車市場については、市場全般に関する調査のほ... もっと見る
調査レポートの納品までの日数はどの程度ですか?
在庫のあるものは速納となりますが、平均的には 3-4日と見て下さい。
但し、一部の調査レポートでは、発注を受けた段階で内容更新をして納品をする場合もあります。
発注をする前のお問合せをお願いします。
注文の手続きはどのようになっていますか?
1)お客様からの御問い合わせをいただきます。
2)見積書やサンプルの提示をいたします。
3)お客様指定、もしくは弊社の発注書をメール添付にて発送してください。
4)データリソース社からレポート発行元の調査会社へ納品手配します。
5) 調査会社からお客様へ納品されます。最近は、pdfにてのメール納品が大半です。
お支払方法の方法はどのようになっていますか?
納品と同時にデータリソース社よりお客様へ請求書(必要に応じて納品書も)を発送いたします。
お客様よりデータリソース社へ(通常は円払い)の御振り込みをお願いします。
請求書は、納品日の日付で発行しますので、翌月最終営業日までの当社指定口座への振込みをお願いします。振込み手数料は御社負担にてお願いします。
お客様の御支払い条件が60日以上の場合は御相談ください。
尚、初めてのお取引先や個人の場合、前払いをお願いすることもあります。ご了承のほど、お願いします。
データリソース社はどのような会社ですか?
当社は、世界各国の主要調査会社・レポート出版社と提携し、世界各国の市場調査レポートや技術動向レポートなどを日本国内の企業・公官庁及び教育研究機関に提供しております。
世界各国の「市場・技術・法規制などの」実情を調査・収集される時には、データリソース社にご相談ください。
お客様の御要望にあったデータや情報を抽出する為のレポート紹介や調査のアドバイスも致します。
|
|


