Direct-to-Patient(患者への直接配送)市場レポート:2022-2032
Direct-to-Patient Market Report 2022-2032
レポート詳細
Direct-to-Patient市場レポート 2022-2032年 :本レポートは、新たな収益の柱を目指すリーディングカンパニーが、業界とその背景にあるダイナミクスをより深く理解する上で、非常に有益... もっと見る
※上記価格は部署ライセンス(Departmental licence)価格です。
その他の価格についてはデータリソースまでお問合せください。
日本語のページは自動翻訳を利用し作成しています。
実際のレポートは英文のみでご納品いたします。
サマリー
レポート詳細
Direct-to-Patient市場レポート 2022-2032年:本レポートは、新たな収益の柱を目指すリーディングカンパニーが、業界とその背景にあるダイナミクスをより深く理解する上で、非常に有益なものとなるでしょう。また、異業種への進出や新地域での既存事業の拡大を目指す企業にとっても有用なレポートです。
患者中心主義への業界の注目が市場成長の原動力
Direct to Patient and Home trial support(DtP/HTS)戦略は、承認された市販療法を受ける患者、臨床試験に参加する患者を問わず、患者に貴重な支援を提供することが可能です。DtP戦略は過去10年間に発展し、患者中心主義に対する業界の注目がより高まっていることに後押しされ、ここ3年間で世界的に採用が劇的に拡大しました。この戦略は、患者さんが自宅に居ながらにして、個別のケアや最先端の治療法、確立された治療法を受けることができるため、患者さんだけでなく、他のすべての関係者にも大きな利益をもたらします。テクノロジーは私たちの日常生活のあらゆる部分を変化させ、世界はかつてないほど小さくなったと感じています。
医療、ヘルスケア、製薬業界の企業は、様々な理由からソーシャルメディアの導入を控えてきました。企業は歓迎したが、薬剤師は過剰な法的リスクをもたらすと考え、敬遠していた。しかし、DTPの分野では、いくつかの先駆者が他者に道を開いてきた。彼らは、急速に進化する今日の医療環境において、それが可能であるばかりでなく、重要であることを実証しています。医療現場では、毎日何万というブランディング・エクササイズが患者さんに送られています。
マーケットリサーチレポートを購入する前に、どのような質問をすべきでしょうか?
- Direct-to-patient (DTP)市場はどのように進化しているのか?
- DTP市場の推進要因と抑制要因は何か?
- 予測期間中、各Direct-to-patient (DTP)サブマーケットセグメントはどのように成長し、2032年にはどの程度の売上を占めるようになるのか?
- 2022年から2032年にかけて、各DTPサブマーケットの市場シェアはどのように推移するのでしょうか?
- 2022年から2032年にかけて、市場全体の主な牽引役となるのは何か?
- 主要なDTP市場はマクロ経済ダイナミクスに概ね追随するのか、それとも個々の国内市場が他を凌駕するのか?
- 2032年までに各国市場のシェアはどのように変化し、どの地域が2032年の市場をリードするのでしょうか?
- 主要プレイヤーは誰か、また予測期間中の見通しは?
- これらの主要企業のDTPプロジェクトはどのようなものでしょうか?
- 2022年から2032年にかけて、業界はどのように進化していくのでしょうか?現在および今後10年間に行われるDTPプロジェクトにはどのような意味があるのか?
- DTP市場をさらに拡大するために、製品の商業化の必要性は高いか?
- DTP市場はどこへ向かい、どのようにすれば市場の最前線に立つことができるのか?
- 新製品・新サービスへの最適な投資方法とは?
- 企業を新たな成長軌道に乗せ、C-suiteに移行させるための重要な展望とは?
このことが、現在、そして今後10年間のDTP市場にどのような影響を与えるかを見極める必要があります。
- 344ページにわたる本レポートでは、155の表と165のグラフを独占的に提供します。
- このレポートでは、業界における主要な収益性の高い分野に焦点を当て、お客様が今すぐターゲットとできるような情報を提供しています。
- 世界、地域、国別の売上高と成長率を詳細に分析しています。
- 競合他社が成功した主なトレンド、変化、収益予測をハイライトしています。
本レポートは、direct-to-patient(DTP)市場が今後10年間にどのように発展するか、またCOVID-19の景気後退と回復の変動に伴ってどのように発展するかを教えてくれます。この市場は、過去10年間のどの時点よりも、今がより重要なのです。
2032年までの予測やその他の分析により、商業的な展望が見えてくる
・ In addition to revenue forecasting to 2032, our new study provides you with recent results, growth rates, and market shares.
・ You will find original analyses, with business outlooks and developments.
・ Discover qualitative analyses (including market dynamics, drivers, opportunities, restraints and challenges), cost structure, impact of rising direct-to-patient (DTP) prices and recent developments.
本レポートでは、COVID-19が業界と貴社にどのような影響を与えるかについて、データ分析と貴重な洞察を掲載しています。本レポートでは、COVID-19の4つの回収パターンとその影響、すなわち「V」、「L」、「W」、「U」について論じています。
報告書の対象セグメント
タイプ
- DTPマーケティング
- DTPヘルスサービス
- DTP臨床試験
- DTP物流
DTPマーケティング
- DTC医薬品広告
- 疾患啓発キャンペーン
- ブランドプロモーション
- 医療サービスプロモーション
- 臨床検査薬プロモーション
- その他の患者向けマーケティング
DTPヘルスサービス
- 遠隔相談
- 医薬品処方
- メディカルコールセンター
- テレサンプリング
- オンラインサービス
DTP臨床試験
- 遠隔健康診断
- 治験薬(IMP)
- 患者支援システム
- その他の臨床試験サービス
DTP物流
- 処方箋による医薬品配送
- プレクリニカルサプライ
- 治験薬供給
- 在宅治験支援
- 検体採取
- CSOサービス一覧
治療薬
- 循環器領域
- 呼吸器領域
- がん領域
- 感染症領域
- 皮膚科学
- その他の治療薬
モデル
・ Depot-to-Patient
・ Site-to-Patient
・ Hybrid Model
・ Direct-From-Patient (DfP)
・ Other DtP モデル
世界市場全体とセグメントの収益予測に加え、5つの地域と20の主要国市場の収益予測も掲載しています。
北米
- 米国
- カナダ
欧州
- ドイツ
- 英国
- フランス
- イタリア
- スペイン
- その他の欧州
アジア太平洋
- 中国
- 日本
- インド
- オーストラリア
- 韓国
- その他のアジア太平洋地域
MEA
- トルコ
- サウジアラビア
- 南アフリカ
- UAE
- その他のMEA地域
ラテンアメリカ
- ブラジル
- メキシコ
- その他のラテンアメリカ地域
Direct-to-Patient市場レポート2022-2032の主要企業のプロファイルと、これらの企業のこのセグメントに焦点を当てたいくつかの企業について掲載しています。
主要企業と市場成長の可能性
・ Access TeleCare
・ Agnity Inc.
・ AMD Global Telemedicine
・ American Well
・ Avel eCare
・ Axs Health
・ Babylon Health
・ Citius Tech
・ Dictum Health Inc.
・ Doctor Anywhere
・ Doctor on Demand
・ Health Partners
・ Health Tap
・ HIMS
・ Marken
・ 20/20 NOW
・ NURX
・ Practo Technologies Pvt. Ltd.
・ Specialists on call, Inc.
・ Teladoc Health Inc.
・ True pill
・ Up Script Health
Direct-to-Patient (DTP)市場の世界全体の収益、2022年から2032年まで金額ベースで2022年に407億4600万米ドルを超えると、我々の仕事は計算しています。また、2032年までの間に売上が大きく伸びると予測しています。本調査では、最も大きな可能性を秘めた企業を特定しました。彼らの能力、進歩、商業的展望を発見することで、一歩先を行くことができます。
Direct-to-Patient 市場レポート 2022-2032」レポートはどのように役立つのでしょうか?
340ページを超えるレポートでは、要約すると以下のような知識を得ることができます。
- Direct-to-Patient(DTP)市場の2032年までの収益予測、タイプ、患者直販マーケティング、患者直販医療サービス、臨床試験、患者直販物流、治療薬、モデルごとに世界と地域レベルで予測 - 投資と収益に最も有利な場所を見つけ、業界の展望を発見してください。
- 5つの地域と20の主要国市場の2032年までの収益予測 - 北米、欧州、アジア太平洋、LAMEAのDirect to Patient(DTP)市場、2022年から2032年の市場予測をご覧いただけます。また、米国、カナダ、メキシコ、ブラジル、ドイツ、フランス、英国、イタリア、中国、インド、日本、オーストラリアなどの主要経済圏の市場も予測されています。
- 既存企業と市場参入を目指す企業の展望 - Direct-to-Patient (DTP) Marketに関わる主要企業22社の企業プロファイルを含む、2022年から2032年までの展望。
定量的・定性的な分析と独自の予測をご覧いただけます。私たちのレポートだけが持つ情報を入手し、貴重なビジネスインテリジェンスを得ることができます。
他にはない情報
私たちの新しいレポートがあれば、知識の遅れを取り戻し、チャンスを逃す可能性が低くなります。私たちの研究が貴社の調査、分析、意思決定にどのように役立つかをご覧ください。Visiongainの調査は、Direct-to-Patient(DTP)市場の2022年から2032年、市場をリードする企業のための商業分析を必要とするすべての人のためのものです。データ、トレンド、予測をご覧いただけます。
ページTOPに戻る
目次
目次
1.レポートの概要
1.1 調査の目的
1.2 患者直販市場の紹介
1.3 本レポートが提供するもの
1.4 本レポートを読むべき理由
1.5 本分析レポートが回答する主要な質問
1.6 本レポートは誰のためのものなのか?
1.7 方法論
1.7.1 市場の定義
1.7.2 市場評価・予測手法
1.7.3 データの検証
1.7.3.1 一次調査
1.7.3.2 セカンダリーリサーチ
1.8 よくある質問(FAQ)
1.9 関連するVisiongainのレポート
1.10 Visiongainについて
2 エグゼクティブサマリー
3 市場の概要
3.1 主要な調査結果
3.2 マーケットダイナミクス
3.2.1 市場の推進要因
3.2.1.1 ソーシャルメディアの重要性の増加
3.2.1.2 地方分権が推進する患者直接対話型マーケティング
3.2.1.3 Direct-to-Patientの価値に対する認識
3.2.2 市場の抑制要因
3.2.2.1 法的規制がDTP市場の拡大を阻害している
3.2.2.2 デジタル技術の発展が業界の成長を促進すると予測
3.2.2.3 ブームとなっているテレヘルスが市場成長を促進する
3.2.3 市場機会
3.2.3.1 DTPサービスは薬の配達だけではない
3.2.3.2 DTPは患者サポートのための主要なコンタクトポイントになる
3.2.3.3 DTPの医療大学、診療所、病院への統合
3.3 サプライチェーン
3.4 COVID-19インパクト分析
3.4.1 COVIDインパクト市場分析(V字回復シナリオ)
3.4.2 COVIDインパクト市場分析(W字型回復シナリオ)
3.4.3 COVIDインパクト市場分析(U字型回復シナリオ)
3.4.4 COVIDインパクトの市場分析(L字回復シナリオ)
3.5 ポーターのファイブフォース分析
3.5.1 サプライヤーパワー
3.5.2 バイヤーパワー
3.5.3 競合他社の競争力
3.5.4 代替品による脅威
3.5.5 新規参入者の脅威
3.6 PEST分析
3.6.1 政治的要因
3.6.2 経済的要因
3.6.3 社会的要因
3.6.4 技術的要因
4 Direct-to-Patient市場分析:タイプ別
4.1 主な調査結果
4.2 タイプ別セグメント市場魅力度指数
4.3 Direct-to-Patientマーケティング
4.4 Direct-to-Patientヘルスサービス
4.5 Direct-to-Patient臨床試験
4.6 Direct-to-Patient物流
4.7 Direct-to-Patient市場:タイプ別
5 Direct-to-Patient市場分析:マーケティング別
5.1 主な調査結果
5.2 マーケティング・セグメント市場魅力度指数
5.3 DTC処方薬広告
5.4 疾患啓発キャンペーン
5.5 ブランドプロモーション
5.6 ヘルスケアサービスプロモーション
5.7 ラボラトリーテストプロモーション
5.8 その他のDirect-to-Patientマーケティング
5.9 Direct-to-Patient市場:マーケティング別
6 Direct-to-Patient市場分析:Direct-to-Patientヘルスサービス別
6.1 主な調査結果
6.2 Direct-to-Patientヘルスサービスセグメント。市場魅力度指数
6.3 遠隔コンサルティング
6.4 医薬品処方
6.5 医療コールセンター
6.6 テレサンプリング
6.7 オンラインサービス
6.8 Direct-to-Patient市場ヘルスサービス別
7 Direct-to-Patient市場分析:臨床試験
7.1 主要な調査結果
7.2 臨床試験セグメント市場魅力度指数
7.3 遠隔健康診断
7.4 治験薬(IMP)
7.5 患者支援システム
7.6 その他の臨床試験サービス
7.7 Direct-to-Patient市場:臨床試験
8 Direct-to-Patient市場分析:Direct-to-Patient物流
8.1 主な調査結果
8.2 Direct-to-Patient物流セグメント。市場魅力度指数
8.3 処方箋薬配送
8.4 プレクリニカルサプライ
8.5 治験用医薬品
8.6 在宅試験支援
8.7 検体採取
8.8 Direct-to-Patient市場:物流
9 Direct-to-Patient市場分析:治療薬別
9.1 主要な調査結果
9.2 治療薬セグメント市場魅力度指数
9.3 循環器系疾患
9.4 呼吸器系疾患
9.5 腫瘍学
9.6 感染症
9.7 皮膚科学
9.8 その他の治療薬
9.9 治療薬別患者への直接投与市場
10 モデル別DTP市場分析
10.1 主な調査結果
10.2 モデルセグメント市場魅力度指数
10.3 サイト・トゥ・ペイシェント
10.4 ハイブリッドモデル
10.5 Direct-From-Patient(DfP)
10.6 その他のDtPモデル
10.7 Direct-to-Patient市場:モデル別
11 Direct-to-Patient市場分析:地域別
11.1 主な調査結果
11.2 Direct-to-Patient市場の地域別魅力度指数
11.3 Direct-to-Patient市場予測
11.4 Direct-to-Patient市場地域別
12 北米のDirect-to-Patient市場分析
12.1 主な調査結果
12.2 在宅ケアへの要望の高まり
12.3 北米の多国籍DtP企業のプレゼンス
12.4 北米Direct-to-Patient市場の地域別魅力度指数
12.5 北米Direct-to-Patient市場:金額別
12.6 北米Direct-to-Patient市場:マーケティング別
12.7 北米Direct-to-Patient市場:医療サービス別
12.8 北米Direct-to-Patient市場:臨床試験別
12.9 北米Direct-to-Patient市場:物流別
12.10 北米Direct-to-Patient市場:治療薬別
12.11 北米Direct-to-Patient市場:モデル別
12.12 北米Direct-to-Patient市場:国別
12.13 米国のDirect-to-Patient分析
12.13.1 医療費の高騰が遠隔医療の普及を加速させると予想される
12.13.2 DTP事業者に対する米国の法律
12.14 カナダのDirect-to-Patient市場分析
12.14.1 遠隔・在宅モニタリングの選好の高まり
13 欧州のDirect-to-Patient市場分析
13.1 主要な調査結果
13.2 臨床研究インフラへの大規模な投資
13.3 DtPはどのように臨床試験のイノベーションを支援するのか?
13.4 欧州Direct-to-Patient市場の地域別魅力度指数
13.5 欧州Direct-to-Patient市場:金額別
13.6 欧州Direct-to-Patient市場:タイプ別
13.7 欧州Direct-to-Patient市場:マーケティング別
13.8 欧州Direct-to-Patient市場:医療サービス別
13.9 欧州Direct-to-Patient市場:臨床試験別
13.10 欧州Direct-to-Patient市場:物流別
13.11 欧州Direct-to-Patient市場:治療薬別
13.12 欧州Direct-to-Patient市場:モデル別
13.13 欧州Direct-to-Patient市場:国別
13.14 ドイツのDirect-to-Patient市場の分析
13.14.1 ドイツのDTP市場は優れた医療保険償還政策により成長中
13.14.2 多数の遠隔医療システムが利用されるようになった
13.15 イギリスのDirect-to-Patient市場の分析
13.15.1 病院でのケアから在宅ケアへ移行する傾向
13.15.2 高齢化がDTPにもたらす機会
13.16 フランスのDirect-to-Patient市場の分析
13.16.1 患者向け直接サービス市場の大幅な細分化
13.17 イタリアのDirect-to-Patient市場分析
13.17.1 イタリアの医療制度の質と有効性は時に批判されることがある
13.17.2 DTPサービスの提供に関する法律
13.18 スペインDirect-to-Patient市場の分析
13.18.1 スペインの医療制度は世界で最も優れている
13.19 その他の欧州地域のDTP市場の分析
14 アジア太平洋地域のDirect-to-Patient市場市場分析
14.1 主な調査結果
14.2 健康に対する消費者意識の高まり
14.3 ステークホルダーの信頼感の変化
14.4 アジア太平洋地域のDirect-to-Patient市場の地域別魅力度指数
14.5 アジア太平洋地域のDirect-to-Patient市場:金額別
14.6 アジア太平洋地域のDirect-to-Patient市場:タイプ別
14.7 アジア太平洋地域のDirect-to-Patient市場:マーケティング別
14.8 アジア太平洋地域のDirect-to-Patient市場:医療サービス別
14.9 アジア太平洋地域のDirect-to-Patient市場:臨床試験別
14.10 アジア太平洋地域のDirect-to-Patient市場:物流別
14.11 アジア太平洋地域のDirect-to-Patient市場治療薬別
14.12 アジア太平洋地域のDirect-to-Patient市場:モデル別
14.13 アジア太平洋地域のDirect-to-Patient市場:国別
14.14 中国のDirect-to-Patient市場の分析
14.14.1 政府による治験薬の「患者への直接投与」出荷の義務化
14.15 インドのDirect-to-Patient市場の分析
14.15.1 インドの医療制度はDtPモデルへ移行しつつある
14.15.2 インドにおける遠隔医療
14.16 日本のDirect-to-Patient市場分析
14.16.1 日本で普及が進むDtPサービス
14.16.2 日本の製薬会社にとって患者との密接な関わりは主要な新興分野である
14.17 オーストラリアのDirect-to-Patient市場分析
14.17.1 オーストラリア政府は在宅ケアパッケージ(HCP)向けのパッケージを提供
14.17.2 オーストラリアの患者直販市場の目覚ましい成長
14.18 韓国のDirect-to-Patient市場分析
14.19 その他のアジア太平洋地域のDirect-to-Patient市場の分析
15 ラテンアメリカのDirect-to-Patient市場分析
15.1 主な調査結果
15.2 ラテンアメリカのDirect-to-Patient市場の地域別魅力度指数
15.3 ラテンアメリカのDirect-to-Patient市場:金額別
15.4 ラテンアメリカのDirect-to-Patient市場:タイプ別
15.5 ラテンアメリカのDirect-to-Patient市場:マーケティング別
15.6 ラテンアメリカのDirect-to-Patient市場:医療サービス別
15.7 ラテンアメリカのDirect-to-Patient市場:臨床試験別
15.8 ラテンアメリカのDirect-to-Patient市場:物流別
15.9 ラテンアメリカのDirect-to-Patient市場:治療薬別
15.10 ラテンアメリカのDirect-to-Patient市場:モデル別
15.11 ラテンアメリカのDirect-to-Patient市場:国別
15.12 ブラジルのDirect-to-Patient市場分析
15.12.1 DTP産業に対する政府の政策
15.13 メキシコのDirect-to-Patient市場分析
15.14 その他のラテンアメリカのDTP市場分析
16 MEAのDirect-To-Patient市場分析
16.1 主な調査結果
16.2 MEAのDirect-to-Patient市場の地域別魅力度指数
16.3 MEAのDirect-to-Patient市場:金額別
16.4 MEAのDirect-to-Patient市場:タイプ別
16.5 MEAのDirect-to-Patient市場:マーケティング別
16.6 MEAのDirect-to-Patient市場:医療サービス別
16.7 MEAのDirect-to-Patient市場:臨床試験別
16.8 MEAのDirect-to-Patient市場:物流別
16.9 MEAのDirect-to-Patient市場:治療薬別
16.10 MEAのDirect-to-Patient市場:モデル別
16.11 MEAのDirect-to-Patient市場:国別
16.12 サウジアラビアのDirect-to-Patient市場分析
16.12.1 サウジアラビア政府は変革計画を通じて医療サービスの開発・改善を進めている
16.13 トルコDirect-to-Patient市場分析
16.13.1 Direct-to-Patientはトルコの全地域に及ぶ大規模な流通網を有している
16.13.2 トルコの家庭医療改革は、近い将来DtPサービスの需要を高めるだろう
16.14 UAEのDirect-to-Patient市場分析
16.14.1 アラブ首長国連邦における医療需要の高まり
16.14.2 UAEはDtPとテレヘルスのモデルに向かっている
16.15 南アフリカのDirect-to-Patient市場の分析
16.15.1 DtPサービスプロバイダには専門的なトレーニングが必要
16.15.2 自宅での患者の文化的・家族的背景には、専門的なDTPが必要
16.16 その他のMEA地域のDTP市場分析
16.16.1 国内のスタートアップがDTP市場を不安定にする可能性
17 競合他社の状況
17.1 主要事業戦略分析-契約
17.2 主要事業戦略分析-契約
17.3 主要事業戦略分析-拡大
17.4 主要事業戦略分析-パートナーシップ
17.5 主要事業戦略分析-上市
18 主要企業のプロフィール
18.1 アクセステレケア
18.1.1 企業スナップショット
18.1.2 会社概要
18.1.3 製品ベンチマーク
18.1.4 戦略的展望
18.2 株式会社アグニティ
18.2.1 企業スナップショット
18.2.2 会社概要
18.2.3 ベンチマーキング
18.2.4 戦略的展望
18.3 AMD グローバルテレメディシン
18.3.1 企業スナップショット
18.3.2 会社概要
18.3.3 製品ベンチマーク
18.3.4 戦略的展望
18.4 アメリカンウェル
18.4.1 企業スナップショット
18.4.2 会社概要
18.4.3 財務分析
18.4.3.1 純収益、2018-2021年
18.4.3.2 営業利益、2018年-2021年
18.4.3.3 研究開発費、2018年~2021年
18.4.4 製品ベンチマーク
18.4.5 戦略的な展望
18.5 アヴェル・イーケア
18.5.1 企業スナップショット
18.5.2 会社概要
18.5.3 ベンチマーキング
18.5.4 戦略的展望
18.6 アクシーズヘルス
18.6.1 企業スナップショット
18.6.2 会社概要
18.6.3 製品ベンチマーク
18.6.4 戦略的展望
18.7 バビロンヘルス
18.7.1 企業スナップショット
18.7.2 会社概要
18.7.2.1 純収益、2019-2021年
18.7.2.2 営業利益、2019年-2021年
18.7.2.3 R&D費用、2019年-2021年
18.7.3 製品ベンチマーク
18.7.4 戦略的な展望
18.8 シティウス・テック
18.8.1 企業スナップショット
18.8.2 会社概要
18.8.3 ベンチマーキング
18.8.4 戦略的展望
18.9 ディクタムヘルス社
18.9.1 企業スナップショット
18.9.2 会社概要
18.9.3 ベンチマーキング
18.9.4 戦略的展望
18.10 ドクターエニウェア
18.10.1 企業スナップショット
18.10.2 会社概要
18.10.3 ベンチマーキング
18.10.4 戦略的展望
18.11 ドクターオンデマンド
18.11.1 企業スナップショット
18.11.2 会社概要
18.11.3 製品ベンチマーク
18.11.4 戦略的展望
18.12 ヘルスパートナー
18.12.1 企業スナップショット
18.12.2 会社概要
18.12.3 財務分析
18.12.3.1 純収益、2018年-2020年
18.12.3.2 営業利益、2018年-2020年
18.12.4 製品ベンチマーク
18.12.5 戦略的な展望
18.13 ヘルスタップ
18.13.1 企業スナップショット
18.13.2 会社概要
18.13.3 製品ベンチマーク
18.13.4 戦略的展望
18.14 HIMS
18.14.1 企業スナップショット
18.14.2 会社概要
18.14.3 財務分析
18.14.3.1 純収益、2019年-2021年
18.14.3.2 営業利益、2019年-2021年
18.14.4 製品ベンチマーク
18.14.5 戦略的な展望
18.15 マルケン
18.15.1 企業スナップショット
18.15.2 会社概要
18.15.3 ベンチマーキング
18.15.4 戦略的展望
18.16 20/20 NOW
18.16.1 企業スナップショット
18.16.2 会社概要
18.16.3 製品ベンチマーク
18.16.4 戦略的展望
18.17 NURX
18.17.1 企業スナップショット
18.17.2 会社概要
18.17.3 ベンチマーキング
18.17.4 戦略的展望
18.18 プラクティス・テクノロジーズ・プライベート・リミテッド
18.18.1 企業スナップショット
18.18.2 会社概要
18.18.3 製品ベンチマーク
18.18.4 戦略的展望
18.19 スペシャリスト・オン・コール・インク
18.19.1 企業スナップショット
18.19.2 会社概要
18.19.3 財務分析
18.19.3.1 純収益、2019年-2021年
18.19.3.2 研究開発費、2019年-2021年
18.19.4 製品ベンチマーク
18.19.5 戦略的な展望
18.20 テラドック・ヘルス・インク
18.20.1 企業スナップショット
18.20.2 会社概要
18.20.3 財務分析
18.20.3.1 純収益、2017年-2021年
18.20.3.2 営業利益、2017年-2021年
18.20.3.3 研究開発費、2017年-2021年
18.20.4 製品ベンチマーク
18.20.5 戦略的展望
18.21 トゥルーピル
18.21.1 企業スナップショット
18.21.2 会社概要
18.21.3 ベンチマーキング
18.21.4 戦略的展望
18.22 アップスクリプトヘルス
18.22.1 企業スナップショット
18.22.2 会社概要
18.22.3 製品ベンチマーク
18.22.4 戦略的展望
19 結論と提言
19.1 ヴィジョンゲインからの結論
19.2 市場関係者への提言
表の一覧
Table 1 Direct-to-Patient Market Snapshot, 2022 & 2032 (US$ million, CAGR %)
Table 2 Direct-to-Patient Market Forecast, 2022-2032 (US$ Mn, AGR (%), CAGR (%)) (V-Shaped Recovery Scenario)
Table 3 Direct-to-Patient Market by Region, 2022-2032 (US$ Mn, AGR (%), CAGR (%)) (V-Shaped Recovery Scenario)
Table 4 Direct-to-Patient Market Forecast, 2022-2032 (US$ Mn, AGR (%), CAGR (%)) (W-Shaped Recovery Scenario)
Table 5 Direct-to-Patient Market by Region, 2022-2032 (US$ Mn, AGR (%), CAGR (%)) (W-Shaped Recovery Scenario)
Table 6 Direct-to-Patient Market Forecast, 2022-2032 (US$ Mn, AGR (%), CAGR (%)) (U-Shaped Recovery Scenario)
Table 7 Direct-to-Patient Market by Region, 2022-2032 (US$ Mn, AGR (%), CAGR (%)) (U-Shaped Recovery Scenario)
Table 8 Direct-to-Patient Market Forecast, 2022-2032 (US$ Mn, AGR (%), CAGR (%)) (L-Shaped Recovery Scenario)
Table 9 Direct-to-Patient Market by Region, 2022-2032 (US$ Mn, AGR (%), CAGR (%)) (L-Shaped Recovery Scenario)
Table 10 Direct-to-Patient Market by Type, 2022-2032 (US$ Mn, AGR (%), CAGR (%))
Table 11 Direct-to-Patient Market by Marketing, 2022-2032 (US$ Mn, AGR (%), CAGR (%))
Table 12 Direct-to-Patient Market by Health Services, 2022-2032 (US$ Mn, AGR (%), CAGR (%))
Table 13 Direct-to-Patient Market by Clinical Trials, 2022-2032 (US$ Mn, AGR (%), CAGR (%))
Table 14 Direct-to-Patient Market Logistics, 2022-2032 (US$ Mn, AGR (%), CAGR (%))
Table 15 Direct-to-Patient Market by Therapeutics, 2022-2032 (US$ Mn, AGR (%), CAGR (%))
Table 16 Direct-to-Patient Market by Model, 2022-2032 (US$ Mn, AGR (%), CAGR (%))
Table 17 Direct-to-Patient Market Forecast, 2022-2032 (US$ Mn, AGR (%), CAGR (%))
Table 18 Direct-to-Patient Market by Region, 2022-2032 (US$ Mn, AGR (%), CAGR (%))
Table 19 North America Direct-to-Patient Market by Value, 2022-2032 (US$ Mn, AGR (%), CAGR (%))
Table 20 North America Direct-to-Patient Market by Marketing, 2022-2032 (US$ Mn, AGR (%), CAGR (%))
Table 21 North America Direct-to-Patient Market by Health Services, 2022-2032 (US$ Mn, AGR (%), CAGR (%))
Table 22 North America Direct-to-Patient Market by Clinical Trials, 2022-2032 (US$ Mn, AGR (%), CAGR (%))
Table 23 North America Direct-to-Patient Market Logistics, 2022-2032 (US$ Mn, AGR (%), CAGR (%))
Table 24 North America Direct-to-Patient Market by Therapeutics, 2022-2032 (US$ Mn, AGR (%), CAGR (%))
Table 25 North America Direct-to-Patient Market by Model, 2022-2032 (US$ Mn, AGR (%), CAGR (%))
Table 26 North America Direct-to-Patient Market by Country, 2022-2032 (US$ Mn, AGR (%), CAGR (%))
Table 27 U.S. Direct-to-Patient Market by Value, 2022-2032 (US$ Mn, AGR (%), CAGR (%))
Table 28 Canada Direct-to-Patient Market by Value, 2022-2032 (US$ Mn, AGR (%), CAGR (%))
Table 29 Europe Direct-to-Patient Market by Value, 2022-2032 (US$ Mn, AGR (%), CAGR (%))
Table 30 Europe Direct-to-Patient Market by Type, 2022-2032 (US$ Mn, AGR (%), CAGR (%))
Table 31 Europe Direct-to-Patient Market by Marketing, 2022-2032 (US$ Mn, AGR (%), CAGR (%))
Table 32 Europe Direct-to-Patient Market by Health Services, 2022-2032 (US$ Mn, AGR (%), CAGR (%))
Table 33 Europe Direct-to-Patient Market by Clinical Trials, 2022-2032 (US$ Mn, AGR (%), CAGR (%))
Table 34 Europe Direct-to-Patient Market Logistics, 2022-2032 (US$ Mn, AGR (%), CAGR (%))
Table 35 Europe Direct-to-Patient Market by Therapeutics, 2022-2032 (US$ Mn, AGR (%), CAGR (%))
Table 36 Europe Direct-to-Patient Market by Model, 2022-2032 (US$ Mn, AGR (%), CAGR (%))
Table 37 Europe Direct-to-Patient Market by Country, 2022-2032 (US$ Mn, AGR (%), CAGR (%))
Table 38 Germany Direct-to-Patient Market by Value, 2022-2032 (US$ Mn, AGR (%), CAGR (%))
Table 39 UK Direct-to-Patient Market by Value, 2022-2032 (US$ Mn, AGR (%), CAGR (%))
Table 40 France Direct-to-Patient Market by Value, 2022-2032 (US$ Mn, AGR (%), CAGR (%))
Table 41 Italy Direct-to-Patient Market by Value, 2022-2032 (US$ Mn, AGR (%), CAGR (%))
Table 42 Spain Direct-to-Patient Market by Value, 2022-2032 (US$ Mn, AGR (%), CAGR (%))
Table 43 Rest of Europe Direct-to-Patient Market by Value, 2022-2032 (US$ Mn, AGR (%), CAGR (%))
Table 44 Asia-Pacific Direct-to-Patient Market by Value, 2022-2032 (US$ Mn, AGR (%), CAGR (%))
Table 45 Asia-Pacific Direct-to-Patient Market by Type, 2022-2032 (US$ Mn, AGR (%), CAGR (%))
Table 46 Asia-Pacific Direct-to-Patient Market by Marketing, 2022-2032 (US$ Mn, AGR (%), CAGR (%))
Table 47 Asia-Pacific Direct-to-Patient Market by Health Services, 2022-2032 (US$ Mn, AGR (%), CAGR (%))
Table 48 Asia-Pacific Direct-to-Patient Market by Clinical Trials, 2022-2032 (US$ Mn, AGR (%), CAGR (%))
Table 49 Asia-Pacific Direct-to-Patient Market Logistics, 2022-2032 (US$ Mn, AGR (%), CAGR (%))
Table 50 Asia-Pacific Direct-to-Patient Market by Therapeutics, 2022-2032 (US$ Mn, AGR (%), CAGR (%))
Table 51 Asia-Pacific Direct-to-Patient Market by Model, 2022-2032 (US$ Mn, AGR (%), CAGR (%))
Table 52 Asia-Pacific Direct-to-Patient Market by Country, 2022-2032 (US$ Mn, AGR (%), CAGR (%))
Table 53 China Direct-to-Patient Market by Value, 2022-2032 (US$ Mn, AGR (%), CAGR (%))
Table 54 India Direct-to-Patient Market by Value, 2022-2032 (US$ Mn, AGR (%), CAGR (%))
Table 55 Japan Direct-to-Patient Market by Value, 2022-2032 (US$ Mn, AGR (%), CAGR (%))
Table 56 Australia Direct-to-Patient Market by Value, 2022-2032 (US$ Mn, AGR (%), CAGR (%))
Table 57 South Korea Direct-to-Patient Market by Value, 2022-2032 (US$ Mn, AGR (%), CAGR (%))
Table 58 Rest of Asia-Pacific Direct-to-Patient Market by Value, 2022-2032 (US$ Mn, AGR (%), CAGR (%))
Table 59 Latin America Direct-to-Patient Market by Value, 2022-2032 (US$ Mn, AGR (%), CAGR (%))
Table 60 Latin America Direct-to-Patient Market by Type, 2022-2032 (US$ Mn, AGR (%), CAGR (%))
Table 61 Latin America Direct-to-Patient Market by Marketing, 2022-2032 (US$ Mn, AGR (%), CAGR (%))
Table 62 Latin America Direct-to-Patient Market by Health Services, 2022-2032 (US$ Mn, AGR (%), CAGR (%))
Table 63 Latin America Direct-to-Patient Market by Clinical Trials, 2022-2032 (US$ Mn, AGR (%), CAGR (%))
Table 64 Latin America Direct-to-Patient Market Logistics, 2022-2032 (US$ Mn, AGR (%), CAGR (%))
Table 65 Latin America Direct-to-Patient Market by Therapeutics, 2022-2032 (US$ Mn, AGR (%), CAGR (%))
Table 66 Latin America Direct-to-Patient Market by Model, 2022-2032 (US$ Mn, AGR (%), CAGR (%))
Table 67 Latin America Direct-to-Patient Market by Country, 2022-2032 (US$ Mn, AGR (%), CAGR (%))
Table 68 Brazil Direct-to-Patient Market by Value, 2022-2032 (US$ Mn, AGR (%), CAGR (%))
Table 69 Mexico Direct-to-Patient Market by Value, 2022-2032 (US$ Mn, AGR (%), CAGR (%))
Table 70 Rest of Latin America Direct-to-Patient Market by Value, 2022-2032 (US$ Mn, AGR (%), CAGR(%))
Table 71 MEA Direct-to-Patient Market by Value, 2022-2032 (US$ Mn, AGR (%), CAGR (%))
Table 72 MEA Direct-to-Patient Market by Type, 2022-2032 (US$ Mn, AGR (%), CAGR (%))
Table 73 MEA Direct-to-Patient Market by Marketing, 2022-2032 (US$ Mn, AGR (%), CAGR (%))
Table 74 MEA Direct-to-Patient Market by Health Services, 2022-2032 (US$ Mn, AGR (%), CAGR (%))
Table 75 MEA Direct-to-Patient Market by Clinical Trials, 2022-2032 (US$ Mn, AGR (%), CAGR (%))
Table 76 MEA Direct-to-Patient Market Logistics, 2022-2032 (US$ Mn, AGR (%), CAGR (%))
Table 77 MEA Direct-to-Patient Market by Therapeutics, 2022-2032 (US$ Mn, AGR (%), CAGR (%))
Table 78 MEA Direct-to-Patient Market by Model, 2022-2032 (US$ Mn, AGR (%), CAGR (%))
Table 79 MEA Direct-to-Patient Market by Country, 2022-2032 (US$ Mn, AGR (%), CAGR (%))
Table 80 Saudi Arabia Direct-to-Patient Market by Value, 2022-2032 (US$ Mn, AGR (%), CAGR (%))
Table 81 Turkey Direct-to-Patient Market by Value, 2022-2032 (US$ Mn, AGR (%), CAGR (%))
Table 82 UAE Direct-to-Patient Market by Value, 2022-2032 (US$ Mn, AGR (%), CAGR (%))
Table 83 South Africa Direct-to-Patient Market by Value, 2022-2032 (US$ Mn, AGR (%), CAGR (%))
Table 84 Rest of MEA Direct-to-Patient Market by Value, 2022-2032 (US$ Mn, AGR (%), CAGR (%))
Table 85 Agreement As Key Business Strategies Adopted by Key Players in Direct-to-Patient Market
Table 86 Contract As Key Business Strategies Adopted by Key Players in Direct-to-Patient Market
Table 87 Expansion As Key Business Strategies Adopted by Key Players in Direct-to-Patient Market
Table 88 Partnership As Key Business Strategies Adopted by Key Players in Direct-to-Patient Market
Table 89 Launch As Key Business Strategies Adopted by Key Players in Direct-to-Patient Market
Table 90 Access TeleCare: Key Details, (CEO, HQ, Revenue, Founded, No. of Employees, Company Type, Website, Business Segment)
Table 91 Access Telecare, .: Product Benchmarking
Table 92 Access TeleCare, .: Strategic Outlook
Table 93 AGNITY INC.: Key Details, (CEO, HQ, Revenue, Founded, No. of Employees, Company Type, Website, Business Segment)
Table 94 AGNITY INC.: Product Benchmarking
Table 95 AGNITY INC.: Strategic Outlook
Table 96 AMD Global Telemedicine: Key Details, (CEO, HQ, Revenue, Founded, No. of Employees, Company Type, Website, Business Segment)
Table 97 AMD Global Telemedicine: Product Benchmarking
Table 98 AMD Global Telemedicine: Strategic Outlook
Table 99 American Well: Key Details, (CEO, HQ, Revenue, Founded, No. of Employees, Company Type, Website, Business Segment)
Table 100 American Well: Product Benchmarking
Table 101 American Well: Strategic Outlook
Table 102 Avel eCare: Key Details, (CEO, HQ, Revenue, Founded, No. of Employees, Company Type, Website, Business Segment)
Table 103 Avera e Care: Product Benchmarking
Table 104 Avera e Care: Strategic Outlook
Table 105 Axs Health: Key Details, (CEO, HQ, Revenue, Founded, No. of Employees, Company Type, Website, Business Segment)
Table 106 Axs Health: Product Benchmarking
Table 107 Axs Healthcare: Strategic Outlook
Table 108 Babylon Health: Key Details, (CEO, HQ, Revenue, Founded, No. of Employees, Company Type, Website, Business Segment)
Table 109 Babylon Health: Product Benchmarking
Table 110 Babylon Health: Strategic Outlook
Table 111 Citius Tech: Key Details, (CEO, HQ, Revenue, Founded, No. of Employees, Company Type, Website, Business Segment)
Table 112 Citius Tech: Product Benchmarking
Table 113 Citius Tech: Strategic Outlook
Table 114 Dictum Health Inc: Key Details, (CEO, HQ, Revenue, Founded, No. of Employees, Company Type, Website, Business Segment)
Table 115 Dictum Health Inc: Product Benchmarking
Table 116 Dictum Health Inc: Strategic Outlook
Table 117 Doctor Anywhere: Key Details, (CEO, HQ, Revenue, Founded, No. of Employees, Company Type, Website, Business Segment)
Table 118 Doctor Anywhere: Product Benchmarking
Table 119 Doctor Anywhere: Strategic Outlook
Table 120 Doctor on demand: Key Details, (CEO, HQ, Revenue, Founded, No. of Employees, Company Type, Website, Business Segment)
Table 121 Doctor on demand: Product Benchmarking
Table 122 Doctor on demand: Strategic Outlook
Table 123 Health Partners: Key Details, (CEO, HQ, Revenue, Founded, No. of Employees, Company Type, Website, Business Segment)
Table 124 Health Partners: Product Benchmarking
Table 125 Health Partners: Strategic Outlook
Table 126 Health Tap: Key Details, (CEO, HQ, Revenue, Founded, No. of Employees, Company Type, Website, Business Segment)
Table 127 Health Tap: Product Benchmarking
Table 128 Health Tap: Strategic Outlook
Table 129 HIMS: Key Details, (CEO, HQ, Revenue, Founded, No. of Employees, Company Type, Website, Business Segment)
Table 130 HIMS: Product Benchmarking
Table 131 HIMS: Strategic Outlook
Table 132 Marken: Key Details, (CEO, HQ, Revenue, Founded, No. of Employees, Company Type, Website, Business Segment)
Table 133 Marken: Product Benchmarking
Table 134 Marken: Strategic Outlook
Table 135 20/20 NOW: Key Details, (CEO, HQ, Revenue, Founded, No. of Employees, Company Type, Website, Business Segment)
Table 136 20/20 NOW: Product Benchmarking
Table 137 20/20 NOW: Strategic Outlook
Table 138 NURX: Key Details, (CEO, HQ, Revenue, Founded, No. of Employees, Company Type, Website, Business Segment)
Table 139 NURX: Product Benchmarking
Table 140 NURX: Strategic Outlook
Table 141 Practo Technologies Pvt. Ltd: Key Details, (CEO, HQ, Revenue, Founded, No. of Employees, Company Type, Website, Business Segment)
Table 142 Practo Technologies Pvt Ltd: Product Benchmarking
Table 143 Practo Technologies Pvt Ltd: Strategic Outlook
Table 144 Specialists on call, Inc: Key Details, (CEO, HQ, Revenue, Founded, No. of Employees, Company Type, Website, Business Segment)
Table 145 Specialists on call, Inc: Product Benchmarking
Table 146 Specialists on call, Inc: Strategic Outlook
Table 147 Teladoc Health Inc: Key Details, (CEO, HQ, Revenue, Founded, No. of Employees, Company Type, Website, Business Segment)
Table 148 Teladoc Health Inc: Product Benchmarking
Table 149 Teladoc Health Inc: Strategic Outlook
Table 150 True pill: Key Details, (CEO, HQ, Revenue, Founded, No. of Employees, Company Type, Website, Business Segment)
Table 151 True pill: Product Benchmarking
Table 152 True pill: Strategic Outlook
Table 153 Up Script Health: Key Details, (CEO, HQ, Revenue, Founded, No. of Employees, Company Type, Website, Business Segment)
Table 154 Up Script Health: Product Benchmarking
Table 155 Up Script Health: Strategic Outlook
図の一覧
Figure 1 Schematics showing benefits of Direct-To-Patient Model
Figure 2 Direct-to-Patient Market Segmentation
Figure 3 Direct-to-Patient Market Forecast by Region: Market Attractiveness Index
Figure 4 Direct-to-Patient Market by Type: Market Attractiveness Index
Figure 5 Direct-to-Patient Market by Marketing: Market Attractiveness Index
Figure 6 Direct-to-Patient Market by Health Services: Market Attractiveness Index
Figure 7 Direct-to-Patient Market by Clinical Trials: Market Attractiveness Index
Figure 8 Direct-to-Patient Market by Logistics: Market Attractiveness Index
Figure 9 Direct-to-Patient Market by Therapeutics: Market Attractiveness Index
Figure 10 Direct-to-Patient Market by Model: Market Attractiveness Index
Figure 11 Direct-to-Patient Market: Market Dynamics
Figure 12 Direct-to-Patient Market Forecast, 2022-2032 (US$ Mn, AGR (%), CAGR (%)) (V-Shaped Recovery Scenario)
Figure 13 Direct-to-Patient Market Forecast by Region, 2022-2032 (US$ Mn, AGR (%), CAGR (%)) (V-Shaped Recovery Scenario)
Figure 14 Direct-to-Patient Market Forecast, 2022-2032 (US$ Mn, AGR (%), CAGR (%)) (W-Shaped Recovery Scenario)
Figure 15 Direct-to-Patient Market Forecast by Region, 2022-2032 (US$ Mn, AGR (%), CAGR (%)) (W-Shaped Recovery Scenario)
Figure 16 Direct-to-Patient Market Forecast, 2022-2032 (US$ Mn, AGR (%), CAGR (%)) (U-Shaped Recovery Scenario)
Figure 17 Direct-to-Patient Market Forecast by Region, 2022-2032 (US$ Mn, AGR (%), CAGR (%)) (U-Shaped Recovery Scenario)
Figure 18 Direct-to-Patient Market Forecast, 2022-2032 (US$ Mn, AGR (%), CAGR (%)) (L-Shaped Recovery Scenario)
Figure 19 Direct-to-Patient Market Forecast by Region, 2022-2032 (US$ Mn, AGR (%), CAGR (%)) (L-Shaped Recovery Scenario)
Figure 20 Direct-to-Patient Market: Porter’s Five Forces Analysis
Figure 21 Direct-to-Patient Market: PEST Analysis
Figure 22 Direct-To-Patient Market by Type: Market Attractiveness Index
Figure 23 Direct-to-Patient Market by Type, 2022-2032 (US$ Mn, AGR (%)
Figure 24 Direct-To-Patient Market by Marketing: Market Attractiveness Index
Figure 25 Direct-to-Patient Market by Marketing, 2022-2032 (US$ Mn, AGR (%))
Figure 26 Direct-to-Patient Market Forecast by Direct-to-Patient Health Services: Market Attractiveness Index
Figure 27 Direct-to-Patient Market by Health Services, 2022-2032 (US$ Mn, AGR (%))
Figure 28 Direct-to-Patient Market Forecast by Clinical Trials: Market Attractiveness Index
Figure 29 Direct-to-Patient Market by Clinical Trials, 2022-2032 (US$ Mn, AGR (%))
Figure 30 Direct-To-Patient Market Forecast by Direct-to-Patient Logistics: Market Attractiveness Index
Figure 31 Direct-to-Patient Market Logistics, 2022-2032 (US$ Mn, AGR (%))
Figure 32 Direct-to-Patient Market Forecast by Therapeutics: Market Attractiveness Index
Figure 33 Direct-to-Patient Market by Therapeutics, 2022-2032 (US$ Mn, AGR (%)
Figure 34 Direct-to-Patient Market Forecast by Model: Market Attractiveness Index
Figure 35 Direct-to-Patient Market by Model, 2022-2032 (US$ Mn, AGR (%)
Figure 36 Direct-to-Patient Market Attractiveness Index by Region: Market Attractiveness Index
Figure 37 Direct-to-Patient Market Forecast, 2022-2032 (US$ Mn, AGR (%))
Figure 38 Direct-to-Patient Market by Region, 2022-2032 (US$ Mn, AGR (%))
Figure 39 Direct-to-Patient Market Attractiveness Index by Region 2022, 2032 (Revenue, CAGR%)
Figure 40 North America Direct-to-Patient Market by Value, 2022-2032 (US$ Mn, AGR (%))
Figure 41 North America Direct-to-Patient Market Share Forecast by Type 2022-2033 (%)
Figure 42 North America Direct-to-Patient Market by Marketing, 2022-2032 (US$ Mn, AGR %)
Figure 43 North America Direct-to-Patient Market Share Forecast by Marketing 2022-2032 (%)
Figure 44 North America Direct-to-Patient Market by Health Services, 2022-2032 (US$ Mn, AGR (%))
Figure 45 North America Direct-to-Patient Market Share Forecast by Health Services 2022-2032 (%)
Figure 46 North America Direct-to-Patient Market by Clinical Trials, 2022-2032 (US$ Mn, AGR (%))
Figure 47 North America Direct-to-Patient Market Share Forecast by Clinical Trial 2023-2033 (%)
Figure 48 North America Direct-to-Patient Market Logistics, 2022-2032 (US$ Mn, AGR (%))
Figure 49 North America Direct-to-Patient Market Share Forecast by Logistics 2022-2032 (%)
Figure 50 North America Direct-to-Patient Market by Therapeutics, 2022-2032 (US$ Mn, AGR %)
Figure 51 North America Direct-to-Patient Market Share Forecast by Therapeutics 2022-2032 (%)
Figure 52 North America Direct-to-Patient Market by Model, 2022-2032 (US$ Mn, AGR (%))
Figure 53 North America Direct-to-Patient Market Share Forecast by Model 2023-2033 (%)
Figure 54 North America Direct-to-Patient Market by Country, 2022-2032 (US$ Mn, AGR (%))
Figure 55 North America Direct-to-Patient Market Share Forecast by Country 2023-2033 (%)
Figure 56 U.S. Direct-to-Patient Market by Value, 2022-2032 (US$ Mn, AGR (%))
Figure 57 Canada Direct-to-Patient Market by Value, 2022-2032 (US$ Mn, AGR (%))
Figure 58 Europe Direct-to-Patient Market Attractiveness Index by Region
Figure 59 Europe Direct-to-Patient Market by Value, 2022-2032 (US$ Mn, AGR (%))
Figure 60 Europe Direct-to-Patient Market by Type, 2022-2032 (US$ Mn, AGR (%))
Figure 61 Europe Direct-to-Patient Market Share Forecast by Type 2022-2032 (%)
Figure 62 Europe Direct-to-Patient Market by Marketing, 2022-2032 (US$ Mn, AGR (%))
Figure 63 Europe Direct-to-Patient Market Share Forecast by Marketing 2022-2032 (%)
Figure 64 Europe Direct-to-Patient Market by Health Services, 2022-2032 (US$ Mn, AGR (%))
Figure 65 Europe Direct-to-Patient Market Share Forecast by Health Services 2022-2032 (%)
Figure 66 Europe Direct-to-Patient Market by Clinical Trials, 2022-2032 (US$ Mn, AGR (%))
Figure 67 Europe Direct-to-Patient Market Share Forecast by Clinical Trials 2022-2032 (%)
Figure 68 Europe Direct-to-Patient Market Logistics, 2022-2032 (US$ Mn, AGR (%))
Figure 69 Europe Direct-to-Patient Market Share Forecast by Logistics 2022-2032 (%)
Figure 70 Europe Direct-to-Patient Market by Therapeutics, 2022-2032 (US$ Mn, AGR (%))
Figure 71 Europe Direct-to-Patient Market Share Forecast by Therapeutics 2022-2032 (%)
Figure 72 Europe Direct-to-Patient Market by Model, 2022-2032 (US$ Mn, AGR (%))
Figure 73 Europe Direct-to-Patient Market Share Forecast by Model 2022-2032 (%)
Figure 74 Europe Direct-to-Patient Market by Country, 2022-2032 (US$ Mn, AGR (%))
Figure 75 Europe Direct-to-Patient Market Share Forecast by Country 2022-2032 (%)
Figure 76 Germany Direct-to-Patient Market by Value, 2022-2032 (US$ Mn, AGR (%))
Figure 77 UK Direct-to-Patient Market by Value, 2022-2032 (US$ Mn, AGR (%))
Figure 78 France Direct-to-Patient Market by Value, 2022-2032 (US$ Mn, AGR (%))
Figure 79 Italy Direct-to-Patient Market by Value, 2022-2032 (US$ Mn, AGR (%))
Figure 80 Spain Direct-to-Patient Market by Value, 2022-2032 (US$ Mn, AGR (%))
Figure 81 Rest of Europe Direct-to-Patient Market by Value, 2022-2032 (US$ Mn, AGR (%))
Figure 82 Asia Pacific Direct-to-Patient Market Attractiveness Index by Region
Figure 83 Asia-Pacific Direct-to-Patient Market by Value, 2022-2032 (US$ Mn, AGR (%))
Figure 84 Asia-Pacific Direct-to-Patient Market by Country, 2022-2032 (US$ Mn, AGR %))
Figure 85 Asia Pacific Direct-to-Patient Market Share Forecast by Type 2022-2032 (%)
Figure 86 Asia-Pacific Direct-to-Patient Market by Marketing, 2022-2032 (US$ Mn, AGR (%))
Figure 87 Asia Pacific Direct-to-Patient Market Share Forecast by Marketing 2022-2032 (%)
Figure 88 Asia-Pacific Direct-to-Patient Market by Health Services, 2022-2032 (US$ Mn, AGR (%))
Figure 89 Asia Pacific Direct-to-Patient Market Share Forecast by Health Services 2022-2032 (%)
Figure 90 Asia-Pacific Direct-to-Patient Market by Clinical Trials, 2022-2032 (US$ Mn, AGR (%))
Figure 91 Asia Pacific Direct-to-Patient Market Share Forecast by Clinical Trials 2022-2032 (%)
Figure 92 Asia-Pacific Direct-to-Patient Market Logistics, 2022-2032 (US$ Mn, AGR (%))
Figure 93 Asia Pacific Direct-to-Patient Market Share Forecast by Logistics 2022-2032 (%)
Figure 94 Asia-Pacific Direct-to-Patient Market by Therapeutics, 2022-2032 (US$ Mn, AGR (%))
Figure 95 Asia Pacific Direct-to-Patient Market Share Forecast by Therapeutics 2022-2032 (%)
Figure 96 Asia-Pacific Direct-to-Patient Market by Model, 2022-2032 (US$ Mn, AGR (%))
Figure 97 Asia Pacific Direct-to-Patient Market Share Forecast by Models 2022-2032 (%)
Figure 98 Asia-Pacific Direct-to-Patient Market by Country, 2022-2032 (US$ Mn, AGR %))
Figure 99 Asia Pacific Direct-to-Patient Market Share Forecast by Country 2023-2033 (%)
Figure 100 China Direct-to-Patient Market by Value, 2022-2032 (US$ Mn, AGR (%))
Figure 101 India Direct-to-Patient Market by Value, 2022-2032 (US$ Mn, AGR (%))
Figure 102 Japan Direct-to-Patient Market by Value, 2022-2032 (US$ Mn, AGR (%))
Figure 103 Australia Direct-to-Patient Market by Value, 2022-2032 (US$ Mn, AGR (%))
Figure 104 South Korea Direct-to-Patient Market by Value, 2022-2032 (US$ Mn, AGR (%))
Figure 105 Rest of Asia-Pacific Direct-to-Patient Market by Value, 2022-2032 (US$ Mn, AGR (%))
Figure 106 Latin America Direct-to-Patient Market Attractiveness Index by Region
Figure 107 Latin America Direct-to-Patient Market by Value, 2022-2032 (US$ Mn, AGR (%))
Figure 108 Latin America Direct-to-Patient Market by Type, 2022-2032 (US$ Mn, AGR (%))
Figure 109 Latin America Direct-to-Patient Market Share Forecast by Type 2022-2032 (%)
Figure 110 Latin America Direct-to-Patient Market by Marketing, 2022-2032 (US$ Mn, AGR (%))
Figure 111 Latin America Direct-to-Patient Market Share Forecast by Marketing 2022-2032 (%)
Figure 112 Latin America Direct-to-Patient Market by Health Services, 2022-2032 (US$ Mn, AGR (%))
Figure 113 Latin America Direct-to-Patient Market Share Forecast by Health Services 2022-2032 (%)
Figure 114 Latin America Direct-to-Patient Market by Clinical Trials, 2022-2032 (US$ Mn, AGR (%))
Figure 115 Latin America Direct-to-Patient Market Share Forecast by Clinical Trials 2022-2032 (%)
Figure 116 Latin America Direct-to-Patient Market Logistics, 2022-2032 (US$ Mn, AGR (%))
Figure 117 Latin America Direct-to-Patient Market Share Forecast by Logistics 2022-2032 (%)
Figure 118 Latin America Direct-to-Patient Market by Therapeutics, 2022-2032 (US$ Mn, AGR (%))
Figure 119 Latin America Direct-to-Patient Market Share Forecast by Therapeutics 2022-2032 (%)
Figure 120 Latin America Direct-to-Patient Market by Model, 2022-2032 (US$ Mn, AGR (%))
Figure 121 Latin America Direct-to-Patient Market Share Forecast by Model 2023-2033 (%)
Figure 122 Latin America Direct-to-Patient Market by Country, 2022-2032 (US$ Mn, AGR (%))
Figure 123 Latin America Direct-to-Patient Market Share Forecast by country 2023-2033 (%)
Figure 124 Brazil Direct-to-Patient Market by Value, 2022-2032 (US$ Mn, AGR (%))
Figure 125 Mexico Direct-to-Patient Market by Value, 2022-2032 (US$ Mn, AGR (%))
Figure 126 Rest of Latin America Direct-to-Patient Market by Value, 2022-2032 (US$ Mn, AGR (%))
Figure 127 MEA Direct-to-Patient Market Attractiveness Index by Region
Figure 128 MEA Direct-to-Patient Market by Value, 2022-2032 (US$ Mn, AGR (%))
Figure 129 MEA Direct-to-Patient Market by Type, 2022-2032 (US$ Mn, AGR (%))
Figure 130 MEA Direct-to-Patient Market Share Forecast by Type 2022-2032 (%)
Figure 131 MEA Direct-to-Patient Market by Marketing, 2022-2032 (US$ Mn, AGR (%))
Figure 132 MEA Direct-to-Patient Market Share Forecast by Marketing 2022-2032 (%)
Figure 133 MEA Direct-to-Patient Market by Health Services, 2022-2032 (US$ Mn, AGR (%))
Figure 134 MEA Direct-to-Patient Market Share Forecast by Health Services 2022-2032 (%)
Figure 135 MEA Direct-to-Patient Market by Clinical Trials, 2022-2032 (US$ Mn, AGR (%))
Figure 136 MEA Direct-to-Patient Market Share Forecast by Clinical Trial 2022-2032 (%)
Figure 137 MEA Direct-to-Patient Market Logistics, 2022-2032 (US$ Mn, AGR (%))
Figure 138 MEA Direct-to-Patient Market Share Forecast by Logistics 2022-2032 (%)
Figure 139 MEA Direct-to-Patient Market by Therapeutics, 2022-2032 (US$ Mn, AGR (%))
Figure 140 MEA Direct-to-Patient Market Share Forecast by Therapeutics 2022-2032 (%)
Figure 141 MEA Direct-to-Patient Market by Model, 2022-2032 (US$ Mn, AGR (%))
Figure 142 MEA Direct-to-Patient Market Share Forecast by Model 2022-2032 (%)
Figure 143 MEA Direct-to-Patient Market by Country, 2022-2032 (US$ Mn, AGR (%))
Figure 144 MEA Direct-to-Patient Market Share Forecast by Country 2022-2032 (%)
Figure 145 Saudi Arabia Direct-to-Patient Market by Value, 2022-2032 (US$ Mn, AGR (%))
Figure 146 Turkey Direct-to-Patient Market by Value, 2022-2032 (US$ Mn, AGR (%))
Figure 147 UAE Direct-to-Patient Market by Value, 2022-2032 (US$ Mn, AGR (%))
Figure 148 South Africa Direct-to-Patient Market by Value, 2022-2032 (US$ Mn, AGR (%))
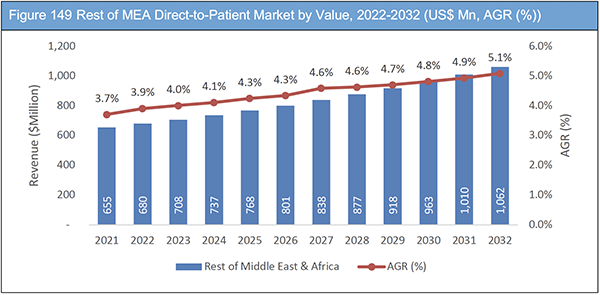
Figure 149 Rest of MEA Direct-to-Patient Market by Value, 2022-2032 (US$ Mn, AGR (%))
Figure 150 American Well: Net Revenue, 2018-2021 (US$ million, AGR (%))
Figure 151 American Well: Operating Income 2018-2021 (US$ million, AGR (%))
Figure 152 American Well: Research & Development Expenses 2018-2021 (US$ million, AGR (%))
Figure 153 Babylon Health: Net Revenue, 2019-2021 (US$ million, AGR%)
Figure 154 Babylon Health: Operating Income, 2019-2021 (US$ million, AGR%)
Figure 155 Babylon Health: R&D Expenses 2019-2021 (US$ million, AGR%)
Figure 156 Health Partners: Net Revenue, 2018-2020 (US$ million, AGR (%))
Figure 157 Health Partners: Operating Income, 2018-2020 (US$ million, AGR (%))
Figure 158 HIMS: Net Revenue, 2019-2021 (US$ million, AGR (%))
Figure 159 HIMS: R&D Expenses, 2019-2021 (US$ million, AGR (%))
Figure 160 Specialists on call, Inc: Revenue, 2019-2021 (US$ million, AGR (%))
Figure 161 Specialists on call, Inc: R&D Expense 2019-2021 (US$ million, AGR%)
Figure 162 Teladoc, Health Inc: Revenue, 2017-2021 (US$ million, AGR (%))
Figure 163 Teladoc, Health Inc: Operating Income, 2017-2021 (US$ million, AGR(%))
Figure 164 Teladoc, Health Inc Research & Development Expenses 2017-2021 (US$ million, AGR (%))
ページTOPに戻る
Summary
Report Details
The Direct-to-Patient Market Report 2022-2032: This report will prove invaluable to leading firms striving for new revenue pockets if they wish to better understand the industry and its underlying dynamics. It will be useful for companies that would like to expand into different industries or to expand their existing operations in a new region.
Industry Focus on Patient-Centricity Is Driving the Market Growth
The direct-to-patient and home trial support (DtP/HTS) strategy can provide priceless assistance to patients, regardless of whether they are getting a commercial therapy that has been approved or are taking part in a clinical trial. The DtP strategy has developed over the past ten years, with global adoption expanding dramatically in the last three years, fuelled by an industry focus on patient-centricity that is becoming more intense. This strategy provides considerable benefits for the patient as well as all other parties by enabling patients to obtain individualised care, cutting-edge or well-established therapies without leaving the comfort of their own homes. Technology has changed every part of our everyday life, which makes the world feel smaller than it has ever been.
Businesses in the medical, healthcare, and pharmaceutical industries have refrained from embracing social media for a variety of reasons. Corporations welcomed it, but pharmacists baulked because they thought it would present an excessive amount of legal risk. Even so, a few forerunners in the direct-to-patient sector have prepared the way for others. They have demonstrated that, in the quickly evolving healthcare environment of today, it is not only doable but also crucial. Tens of thousands of branding exercises are sent to patients in the medical field each day.
What Questions Should You Ask before Buying a Market Research Report?
• How is the direct-to-patient (DTP) market evolving?
• What is driving and restraining the direct-to-patient (DTP) market?
• How will each direct-to-patient (DTP) submarket segment grow over the forecast period and how much revenue will these submarkets account for in 2032?
• How will the market shares for each direct-to-patient (DTP) submarket develop from 2022 to 2032?
• What will be the main driver for the overall market from 2022 to 2032?
• Will leading direct-to-patient (DTP) markets broadly follow the macroeconomic dynamics, or will individual national markets outperform others?
• How will the market shares of the national markets change by 2032 and which geographical region will lead the market in 2032?
• Who are the leading players and what are their prospects over the forecast period?
• What are the direct-to-patient (DTP) projects for these leading companies?
• How will the industry evolve during the period between 2022 and 2032? What are the implications of direct-to-patient (DTP) projects taking place now and over the next 10 years?
• Is there a greater need for product commercialisation to further scale the direct-to-patient (DTP) market?
• Where is the direct-to-patient (DTP) market heading and how can you ensure you are at the forefront of the market?
• What are the best investment options for new product and service lines?
• What are the key prospects for moving companies into a new growth path and C-suite?
You need to discover how this will impact the direct-to-patient (DTP) market today, and over the next 10 years:
• Our 344-page report provides 155 tables and 165 charts/graphs exclusively to you.
• The report highlights key lucrative areas in the industry so you can target them – NOW.
• It contains in-depth analysis of global, regional and national sales and growth.
• It highlights for you the key successful trends, changes and revenue projections made by your competitors.
This report tells you TODAY how the direct-to-patient (DTP) market will develop in the next 10 years, and in line with the variations in COVID-19 economic recession and bounce. This market is more critical now than at any point over the last 10 years.
Forecasts to 2032 and other analyses reveal commercial prospects
• In addition to revenue forecasting to 2032, our new study provides you with recent results, growth rates, and market shares.
• You will find original analyses, with business outlooks and developments.
• Discover qualitative analyses (including market dynamics, drivers, opportunities, restraints and challenges), cost structure, impact of rising direct-to-patient (DTP) prices and recent developments.
This report includes data analysis and invaluable insight into how COVID-19 will affect the industry and your company. Four COVID-19 recovery patterns and their impact, namely, “V”, “L”, “W” and “U” are discussed in this report.
Segments Covered in the Report
Type
• Direct-to-Patient Marketing
• Direct-to-Patient Health Services
• Direct-to-Patient Clinical Trials
• Direct-to-Patient Logistics
Direct-to-Patient Marketing
• DTC Prescribed Drug Advertising
• Disease Awareness Campaigns
• Brand Promotion
• Healthcare Services Promotion
• Laboratory Testing Promotion
• Other Direct-to-Patient Marketing
Direct-to-Patient Health Services
• Tele Consultation
• Drug Prescription
• Medical Call Centers
• Telesampling
• Online Services
Direct-to-Patient Clinical Trials
• Tele Health Screening
• Investigational Medicinal Product (IMP)
• Patient Support Systems
• Other Clinical Trial Services
Direct-to-Patient Logistics
• Prescribed Medicine Delivery
• Pre-Clinical Supplies
• Clinical Trial Supplies
• Home Trial Support
• Test Samples Collection
• Rest All CSO Services
Therapeutics
• Cardiovascular Disease
• Respiratory Diseases
• Oncology
• Infectious Diseases
• Dermatology
• Other Therapeutics
Model
• Depot-to-Patient
• Site-to-Patient
• Hybrid Model
• Direct-From-Patient (DfP)
• Other DtP Models
In addition to the revenue predictions for the overall world market and segments, you will also find revenue forecasts for five regional and 20 leading national markets:
North America
• U.S.
• Canada
Europe
• Germany
• UK
• France
• Italy
• Spain
• Rest of Europe
Asia Pacific
• China
• Japan
• India
• Australia
• South Korea
• Rest of Asia Pacific
MEA
• Turkey
• Saudi Arabia
• South Africa
• UAE
• Rest of MEA
Latin America
• Brazil
• Mexico
• Rest of Latin America
The report also includes profiles and for some of the leading companies in the Direct-to-Patient Market Report 2022-2032, with a focus on this segment of these companies’ operations.
Leading companies and the potential for market growth
• Access TeleCare
• Agnity Inc.
• AMD Global Telemedicine
• American Well
• Avel eCare
• Axs Health
• Babylon Health
• Citius Tech
• Dictum Health Inc.
• Doctor Anywhere
• Doctor on Demand
• Health Partners
• Health Tap
• HIMS
• Marken
• 20/20 NOW
• NURX
• Practo Technologies Pvt. Ltd.
• Specialists on call, Inc.
• Teladoc Health Inc.
• True pill
• Up Script Health
Overall world revenue for Direct-to-Patient (DTP) Market, 2022 to 2032 in terms of value the market will surpass US$40,746 million in 2022, our work calculates. We predict strong revenue growth through to 2032. Our work identifies which organizations hold the greatest potential. Discover their capabilities, progress, and commercial prospects, helping you stay ahead.
How will the Direct-to-Patient Market Report 2022-2032 report help you?
In summary, our 340+ page report provides you with the following knowledge:
• Revenue forecasts to 2032 for Direct-to-Patient (DTP) Market, 2022 to 2032 Market, with forecasts for type, direct-to-patient marketing, direct-to-patient health services, clinical trials, direct-to-patient logistics, therapeutics, and model, each forecast at a global and regional level – discover the industry’s prospects, finding the most lucrative places for investments and revenues.
• Revenue forecasts to 2032 for five regional and 20 key national markets – See forecasts for the Direct-to-Patient (DTP) Market, 2022 to 2032 market in North America, Europe, Asia-Pacific and LAMEA. Also forecasted is the market in the US, Canada, Mexico, Brazil, Germany, France, UK, Italy, China, India, Japan, and Australia among other prominent economies.
• Prospects for established firms and those seeking to enter the market – including company profiles for 22 of the major companies involved in the Direct-to-Patient (DTP) Market, 2022 to 2032.
Find quantitative and qualitative analyses with independent predictions. Receive information that only our report contains, staying informed with invaluable business intelligence.
Information found nowhere else
With our new report, you are less likely to fall behind in knowledge or miss out on opportunities. See how our work could benefit your research, analyses, and decisions. Visiongain’s study is for everybody needing commercial analyses for the Direct-to-Patient (DTP) Market, 2022 to 2032, market-leading companies. You will find data, trends and predictions.
ページTOPに戻る
Table of Contents
Table of Contents
1. Report Overview
1.1 Objectives of the Study
1.2 Introduction to Direct-To-Patient Market
1.3 What This Report Delivers
1.4 Why You Should Read This Report
1.5 Key Questions Answered by This Analytical Report
1.6 Who is This Report for?
1.7 Methodology
1.7.1 Market Definitions
1.7.2 Market Evaluation & Forecasting Methodology
1.7.3 Data Validation
1.7.3.1 Primary Research
1.7.3.2 Secondary Research
1.8 Frequently Asked Questions (FAQs)
1.9 Associated Visiongain Reports
1.10 About Visiongain
2 Executive Summary
3 Market Overview
3.1 Key Findings
3.2 Market Dynamics
3.2.1 Market Driving Factors
3.2.1.1 Increase in Social Media's Relevance
3.2.1.2 Direct-to-Patient Marketing Driven by Decentralization
3.2.1.3 Recognizing the Value of Direct-to-Patient
3.2.2 Market Restraining Factors
3.2.2.1 Legal restrictions Are Impeding the Expansion of the DTP Market
3.2.2.2 Development of Digital Technology Projected to Boost Industry Growth
3.2.2.3 Booming Telehealth to Fuel Market Growth
3.2.3 Market Opportunities
3.2.3.1 DTP Services Are not Just for Delivering Medications
3.2.3.2 DTP Would be the Primary Point of Contact for Patient Support
3.2.3.3 DTP's Integration into Medical Universities, Clinics, and Hospitals
3.3 Supply Chain
3.4 COVID-19 Impact Analysis
3.4.1 COVID Impact Market Analysis (V-Shaped Recovery Scenario)
3.4.2 COVID Impact Market Analysis (W-Shaped Recovery Scenario)
3.4.3 COVID Impact Market Analysis (U-Shaped Recovery Scenario)
3.4.4 COVID Impact Market Analysis (L-Shaped Recovery Scenario)
3.5 Porter’s Five Forces Analysis
3.5.1 Supplier Power
3.5.2 Buyer Power
3.5.3 Competitive Rivalry
3.5.4 Threat from Substitutes
3.5.5 Threat of New Entrants
3.6 PEST Analysis
3.6.1 Political Factors
3.6.2 Economic Factors
3.6.3 Social Factors
3.6.4 Technological Factors
4 Direct-to-Patient Market Analysis by Type
4.1 Key Findings
4.2 Type Segment: Market Attractiveness Index
4.3 Direct-to-Patient Marketing
4.4 Direct-to-Patient Health Services
4.5 Direct-to-Patient Clinical Trials
4.6 Direct-to-Patient Logistics
4.7 Direct-To-Patient Market by Type
5 Direct-To-Patient Market Analysis by Marketing
5.1 Key Findings
5.2 Marketing Segment: Market Attractiveness Index
5.3 DTC Prescribed Drug Advertising
5.4 Disease Awareness Campaigns
5.5 Brand Promotion
5.6 Healthcare Services Promotion
5.7 Laboratory Testing Promotion
5.8 Other Direct-to-Patient Marketing
5.9 Direct-to-Patient Market by Marketing
6 Direct-to-Patient Market Analysis by Direct-to-Patient Health Services
6.1 Key Findings
6.2 Direct-to-Patient Health Services Segment: Market Attractiveness Index
6.3 Tele Consultation
6.4 Drug Prescription
6.5 Medical Call Centers
6.6 Telesampling
6.7 Online Services
6.8 Direct-to-Patient Market by Health Service
7 Direct-to-Patient Market Analysis by Clinical Trials
7.1 Key Findings
7.2 Clinical Trials Segment: Market Attractiveness Index
7.3 Tele Health Screening
7.4 Investigational Medicinal Product (IMP)
7.5 Patient Support Systems
7.6 Other Clinical Trial Services
7.7 Direct-to-Patient Market by Clinical Trials
8 Direct-to-Patient Market Analysis by Direct-to-Patient Logistics
8.1 Key Findings
8.2 Direct-to-Patient Logistics Segment: Market Attractiveness Index
8.3 Prescribed Medicine Delivery
8.4 Pre-Clinical Supplies
8.5 Clinical Trial Supplies
8.6 Home Trial Support
8.7 Test Samples Collection
8.8 Direct-to-Patient Market by Logistics
9 Direct-to-Patient Market Analysis by Therapeutics
9.1 Key Findings
9.2 Therapeutics Segment: Market Attractiveness Index
9.3 Cardiovascular Diseases
9.4 Respiratory Diseases
9.5 Oncology
9.6 Infectious Diseases
9.7 Dermatology
9.8 Other Therapeutics
9.9 Direct-to-Patient Market by Therapeutics
10 Direct-to-Patient Market Analysis by Model
10.1 Key Findings
10.2 Model Segment: Market Attractiveness Index
10.3 Site-to-Patient
10.4 Hybrid Model
10.5 Direct-From-Patient (DfP)
10.6 Other DtP Models
10.7 Direct-to-Patient Market by Model
11 Direct-to-Patient Market Analysis by Region
11.1 Key Findings
11.2 Direct-to-Patient Market Attractiveness Index by Region
11.3 Direct-to-Patient Market Forecast
11.4 Direct-to-Patient Market by Region
12 North America Direct-To-Patient Market Analysis
12.1 Key Findings
12.2 Growing Desire for In-Home Care
12.3 Multinational DtP Company Presence in the Region
12.4 North America Direct-To-Patient Market Attractiveness Index by Region
12.5 Direct-to-Patient Market by Value
12.6 North America Direct-to-Patient Market by Marketing
12.7 North America Direct-to-Patient Market by Health Services
12.8 North America Direct-to-Patient Market by Clinical Trials
12.9 North America Direct-to-Patient Market by Logistics
12.10 North America Direct-to-Patient Market by Therapeutics
12.11 North America Direct-to-Patient Market by Model
12.12 North America Direct-to-Patient Market by Country
12.13 U.S. Direct-to-Patient Market Analysis
12.13.1 Rising Healthcare Costs Are Anticipated to Accelerate the Uptake of Telehealth
12.13.2 U.S. Laws for DTP Businesses
12.14 Canada Direct-to-Patient Market Analysis
12.14.1 Increasing Preference for Remote and Home Monitoring
13 Europe Direct-To-Patient Market Analysis
13.1 Key Findings
13.2 Significant Investment in Clinical Research Infrastructure
13.3 How DtP Supports Clinical Trial Innovation?
13.4 Europe Direct-to-Patient Market Attractiveness Index by Region
13.5 Europe Direct-to-Patient Market by Value
13.6 Europe Direct-to-Patient Market by Type
13.7 Europe Direct-to-Patient Market by Marketing
13.8 Europe Direct-to-Patient Market by Health Services
13.9 Europe Direct-to-Patient Market by Clinical Trials
13.10 Europe Direct-to-Patient Market by Logistics
13.11 Europe Direct-to-Patient Market by Therapeutics
13.12 Europe Direct-to-Patient Market by Model
13.13 Europe Direct-to-Patient Market by Country
13.14 Germany Direct-To-Patient Market Analysis
13.14.1 Germany's DTP Market Growing Due to Good Health Reimbursement Policies
13.14.2 Numerous Telemedicine Systems Are Now in Use
13.15 U.K. Direct-To-Patient Market Analysis
13.15.1 Hospital-based Care Trend Shifting to Home Care
13.15.2 Ageing Population Will Bring Opportunities for DTP
13.16 France Direct-To-Patient Market Analysis
13.16.1 Significant Fragmentation in the Direct-to-Patient Services Market
13.17 Italy Direct-to-Patient Market Analysis
13.17.1 Quality and Effectiveness of the Italian Healthcare System Can Occasionally Be Criticised
13.17.2 Laws Concerning the Delivery of DTP Services
13.18 Spain Direct-To-Patient Market Analysis
13.18.1 The Healthcare System in Spain is Among the Best in the World
13.19 Rest of Europe Direct-To-Patient Market Analysis
14 Asia-Pacific Direct-To-Patient Market Analysis
14.1 Key Findings
14.2 Growing Health Consumerism
14.3 A Shift in Stakeholder Confidence
14.4 Asia Pacific Direct-to-Patient Market Attractiveness Index by Region
14.5 Asia Pacific Direct-to-Patient Market by Value
14.6 Asia Pacific Direct-to-Patient Market by Type
14.7 Asia Pacific Direct-to-Patient Market by Marketing
14.8 Asia Pacific Direct-to-Patient Market by Health Services
14.9 Asia Pacific Direct-to-Patient Market by Clinical Trials
14.10 Asia Pacific Direct-to-Patient Market by Logistics
14.11 Asia Pacific Direct-to-Patient Market by Therapeutics
14.12 Asia Pacific Direct-to-Patient Market by Model
14.13 Asia Pacific Direct-to-Patient Market by Country
14.14 China Direct-to-Patient Market Analysis
14.14.1 Government Made "Direct-To-Patients" Shipment of Investigational Drugs Mandatory
14.15 India Direct-to-Patient Market Analysis
14.15.1 Country's Healthcare System is Transitioning to the DtP Model
14.15.2 Telemedicine in India
14.16 Japan Direct-to-Patient Market Analysis
14.16.1 DtP Services Are Becoming More Popular in Japan
14.16.2 Close Patient Engagement is a Majorly Emerging Sector for Japanese Pharma
14.17 Australia Direct-to-Patient Market Analysis
14.17.1 Australian Government Offers Packages for Home Care Package (HCP)
14.17.2 Remarkable Growth of Australia's Market for Direct-To-Patient
14.18 South Korea Direct-to-Patient Market Analysis
14.19 Rest of Asia-Pacific Direct-to-Patient Market Analysis
15 Latin America Direct-To-Patient Market Analysis
15.1 Key Findings
15.2 Latin America Direct-to-Patient Market Attractiveness Index by Region
15.3 Latin America Direct-To-Patient Market by Value
15.4 Latin America Direct-To-Patient Market by Type
15.5 Latin America Direct-To-Patient Market by Marketing
15.6 Latin America Direct-To-Patient Market by Health Services
15.7 Latin America Direct-To-Patient Market by Clinical Trials
15.8 Latin America Direct-To-Patient Market by Logistics
15.9 Latin America Direct-To-Patient Market by Therapeutics
15.10 Latin America Direct-To-Patient Market by Model
15.11 Latin America Direct-To-Patient Market by Country
15.12 Brazil Direct-to-Patient Market Analysis
15.12.1 Government Policies for the DTP Industry
15.13 Mexico Direct-to-Patient Market Analysis
15.14 Rest of Latin America Direct-to-Patient Market Analysis
16 MEA Direct-To-Patient Market Analysis
16.1 Key Findings
16.2 MEA Direct-to-Patient Market Attractiveness Index by Region
16.3 MEA Direct-To-Patient Market by Value
16.4 MEA Direct-To-Patient Market by Type
16.5 MEA Direct-To-Patient Market by Marketing
16.6 MEA Direct-To-Patient Market by Health Services
16.7 MEA Direct-To-Patient Market by Clinical Trials
16.8 MEA Direct-To-Patient Market by Logistics
16.9 MEA Direct-To-Patient Market by Therapeutics
16.10 MEA Direct-To-Patient Market by Model
16.11 MEA Direct-To-Patient Market by Country
16.12 Saudi Arabia Direct-to-Patient Market Analysis
16.12.1 Saudi Arabia Government is Developing and Improving Healthcare Services Through a Transformation Plan
16.13 Turkey Direct-to-Patient Market Analysis
16.13.1 Direct To Patient Has a Large Distribution Network that Reaches All Regions of Turkey
16.13.2 Turkey’s Family Medicine Reform Will Boost Demand for DtP Services in Nearing Future
16.14 UAE Direct-to-Patient Market Analysis
16.14.1 Rise in Healthcare Demand in the United Arab Emirates
16.14.2 UAE is Moving Toward DtP and Telehealth Models
16.15 South Africa Direct-to-Patient Market Analysis
16.15.1 Professional Training is Required for DtP Service Providers
16.15.2 Patient's Cultural and Family Context at Home Must Include Professional DTP
16.16 Rest of MEA Direct-to-Patient Market Analysis
16.16.1 Start-Ups in the Nation Could Destabilise the DTP Market
17 Competitive Landscape
17.1 Key Business Strategy Analysis- Agreement
17.2 Key Business Strategy Analysis- Contract
17.3 Key Business Strategy Analysis- Expansion
17.4 Key Business Strategy Analysis- Partnership
17.5 Key Business Strategy Analysis- Launch
18 Company Profiles
18.1 Access TeleCare
18.1.1 Company Snapshot
18.1.2 Company Overview
18.1.3 Product Benchmarking
18.1.4 Strategic Outlook
18.2 Agnity Inc.
18.2.1 Company Snapshot
18.2.2 Company Overview
18.2.3 Product Benchmarking
18.2.4 Strategic Outlook
18.3 AMD Global Telemedicine
18.3.1 Company Snapshot
18.3.2 Company Overview
18.3.3 Product Benchmarking
18.3.4 Strategic Outlook
18.4 American Well
18.4.1 Company Snapshot
18.4.2 Company Overview
18.4.3 Financial Analysis
18.4.3.1 Net Revenue, 2018-2021
18.4.3.2 Operating Income, 2018-2021
18.4.3.3 Research & Development Expenses, 2018-2021
18.4.4 Product Benchmarking
18.4.5 Strategic Outlook
18.5 Avel eCare
18.5.1 Company Snapshot
18.5.2 Company Overview
18.5.3 Product Benchmarking
18.5.4 Strategic Outlook
18.6 Axs Health
18.6.1 Company Snapshot
18.6.2 Company Overview
18.6.3 Product Benchmarking
18.6.4 Strategic Outlook
18.7 Babylon Health
18.7.1 Company Snapshot
18.7.2 Company Overview
18.7.2.1 Net Revenue, 2019-2021
18.7.2.2 Operating Income, 2019-2021
18.7.2.3 R&D Expenses, 2019-2021
18.7.3 Product Benchmarking
18.7.4 Strategic Outlook
18.8 Citius Tech
18.8.1 Company Snapshot
18.8.2 Company Overview
18.8.3 Product Benchmarking
18.8.4 Strategic Outlook
18.9 Dictum Health Inc.
18.9.1 Company Snapshot
18.9.2 Company Overview
18.9.3 Product Benchmarking
18.9.4 Strategic Outlook
18.10 Doctor Anywhere
18.10.1 Company Snapshot
18.10.2 Company Overview
18.10.3 Product Benchmarking
18.10.4 Strategic Outlook
18.11 Doctor on Demand
18.11.1 Company Snapshot
18.11.2 Company Overview
18.11.3 Product Benchmarking
18.11.4 Strategic Outlook
18.12 Health Partners
18.12.1 Company Snapshot
18.12.2 Company Overview
18.12.3 Financial Analysis
18.12.3.1 Net Revenue, 2018-2020
18.12.3.2 Operating Income, 2018-2020
18.12.4 Product Benchmarking
18.12.5 Strategic Outlook
18.13 Health Tap
18.13.1 Company Snapshot
18.13.2 Company Overview
18.13.3 Product Benchmarking
18.13.4 Strategic Outlook
18.14 HIMS
18.14.1 Company Snapshot
18.14.2 Company Overview
18.14.3 Financial Analysis
18.14.3.1 Net Revenue, 2019-2021
18.14.3.2 Operating Income, 2019-2021
18.14.4 Product Benchmarking
18.14.5 Strategic Outlook
18.15 Marken
18.15.1 Company Snapshot
18.15.2 Company Overview
18.15.3 Product Benchmarking
18.15.4 Strategic Outlook
18.16 20/20 NOW
18.16.1 Company Snapshot
18.16.2 Company Overview
18.16.3 Product Benchmarking
18.16.4 Strategic Outlook
18.17 NURX
18.17.1 Company Snapshot
18.17.2 Company Overview
18.17.3 Product Benchmarking
18.17.4 Strategic Outlook
18.18 Practo Technologies Pvt. Ltd
18.18.1 Company Snapshot
18.18.2 Company Overview
18.18.3 Product Benchmarking
18.18.4 Strategic Outlook
18.19 Specialists on call, Inc
18.19.1 Company Snapshot
18.19.2 Company Overview
18.19.3 Financial Analysis
18.19.3.1 Net Revenue, 2019-2021
18.19.3.2 Research & Development Expense, 2019-2021
18.19.4 Product Benchmarking
18.19.5 Strategic Outlook
18.20 Teladoc Health Inc
18.20.1 Company Snapshot
18.20.2 Company Overview
18.20.3 Financial Analysis
18.20.3.1 Net Revenue, 2017-2021
18.20.3.2 Operating Income, 2017-2021
18.20.3.3 Research & Development Expenses, 2017-2021
18.20.4 Product Benchmarking
18.20.5 Strategic Outlook
18.21 True pill
18.21.1 Company Snapshot
18.21.2 Company Overview
18.21.3 Product Benchmarking
18.21.4 Strategic Outlook
18.22 Up Script Health
18.22.1 Company Snapshot
18.22.2 Company Overview
18.22.3 Product Benchmarking
18.22.4 Strategic Outlook
19 Conclusion and Recommendations
19.1 Concluding Remarks from Visiongain
19.2 Recommendations for Market Players
List of Tables
Table 1 Direct-to-Patient Market Snapshot, 2022 & 2032 (US$ million, CAGR %)
Table 2 Direct-to-Patient Market Forecast, 2022-2032 (US$ Mn, AGR (%), CAGR (%)) (V-Shaped Recovery Scenario)
Table 3 Direct-to-Patient Market by Region, 2022-2032 (US$ Mn, AGR (%), CAGR (%)) (V-Shaped Recovery Scenario)
Table 4 Direct-to-Patient Market Forecast, 2022-2032 (US$ Mn, AGR (%), CAGR (%)) (W-Shaped Recovery Scenario)
Table 5 Direct-to-Patient Market by Region, 2022-2032 (US$ Mn, AGR (%), CAGR (%)) (W-Shaped Recovery Scenario)
Table 6 Direct-to-Patient Market Forecast, 2022-2032 (US$ Mn, AGR (%), CAGR (%)) (U-Shaped Recovery Scenario)
Table 7 Direct-to-Patient Market by Region, 2022-2032 (US$ Mn, AGR (%), CAGR (%)) (U-Shaped Recovery Scenario)
Table 8 Direct-to-Patient Market Forecast, 2022-2032 (US$ Mn, AGR (%), CAGR (%)) (L-Shaped Recovery Scenario)
Table 9 Direct-to-Patient Market by Region, 2022-2032 (US$ Mn, AGR (%), CAGR (%)) (L-Shaped Recovery Scenario)
Table 10 Direct-to-Patient Market by Type, 2022-2032 (US$ Mn, AGR (%), CAGR (%))
Table 11 Direct-to-Patient Market by Marketing, 2022-2032 (US$ Mn, AGR (%), CAGR (%))
Table 12 Direct-to-Patient Market by Health Services, 2022-2032 (US$ Mn, AGR (%), CAGR (%))
Table 13 Direct-to-Patient Market by Clinical Trials, 2022-2032 (US$ Mn, AGR (%), CAGR (%))
Table 14 Direct-to-Patient Market Logistics, 2022-2032 (US$ Mn, AGR (%), CAGR (%))
Table 15 Direct-to-Patient Market by Therapeutics, 2022-2032 (US$ Mn, AGR (%), CAGR (%))
Table 16 Direct-to-Patient Market by Model, 2022-2032 (US$ Mn, AGR (%), CAGR (%))
Table 17 Direct-to-Patient Market Forecast, 2022-2032 (US$ Mn, AGR (%), CAGR (%))
Table 18 Direct-to-Patient Market by Region, 2022-2032 (US$ Mn, AGR (%), CAGR (%))
Table 19 North America Direct-to-Patient Market by Value, 2022-2032 (US$ Mn, AGR (%), CAGR (%))
Table 20 North America Direct-to-Patient Market by Marketing, 2022-2032 (US$ Mn, AGR (%), CAGR (%))
Table 21 North America Direct-to-Patient Market by Health Services, 2022-2032 (US$ Mn, AGR (%), CAGR (%))
Table 22 North America Direct-to-Patient Market by Clinical Trials, 2022-2032 (US$ Mn, AGR (%), CAGR (%))
Table 23 North America Direct-to-Patient Market Logistics, 2022-2032 (US$ Mn, AGR (%), CAGR (%))
Table 24 North America Direct-to-Patient Market by Therapeutics, 2022-2032 (US$ Mn, AGR (%), CAGR (%))
Table 25 North America Direct-to-Patient Market by Model, 2022-2032 (US$ Mn, AGR (%), CAGR (%))
Table 26 North America Direct-to-Patient Market by Country, 2022-2032 (US$ Mn, AGR (%), CAGR (%))
Table 27 U.S. Direct-to-Patient Market by Value, 2022-2032 (US$ Mn, AGR (%), CAGR (%))
Table 28 Canada Direct-to-Patient Market by Value, 2022-2032 (US$ Mn, AGR (%), CAGR (%))
Table 29 Europe Direct-to-Patient Market by Value, 2022-2032 (US$ Mn, AGR (%), CAGR (%))
Table 30 Europe Direct-to-Patient Market by Type, 2022-2032 (US$ Mn, AGR (%), CAGR (%))
Table 31 Europe Direct-to-Patient Market by Marketing, 2022-2032 (US$ Mn, AGR (%), CAGR (%))
Table 32 Europe Direct-to-Patient Market by Health Services, 2022-2032 (US$ Mn, AGR (%), CAGR (%))
Table 33 Europe Direct-to-Patient Market by Clinical Trials, 2022-2032 (US$ Mn, AGR (%), CAGR (%))
Table 34 Europe Direct-to-Patient Market Logistics, 2022-2032 (US$ Mn, AGR (%), CAGR (%))
Table 35 Europe Direct-to-Patient Market by Therapeutics, 2022-2032 (US$ Mn, AGR (%), CAGR (%))
Table 36 Europe Direct-to-Patient Market by Model, 2022-2032 (US$ Mn, AGR (%), CAGR (%))
Table 37 Europe Direct-to-Patient Market by Country, 2022-2032 (US$ Mn, AGR (%), CAGR (%))
Table 38 Germany Direct-to-Patient Market by Value, 2022-2032 (US$ Mn, AGR (%), CAGR (%))
Table 39 UK Direct-to-Patient Market by Value, 2022-2032 (US$ Mn, AGR (%), CAGR (%))
Table 40 France Direct-to-Patient Market by Value, 2022-2032 (US$ Mn, AGR (%), CAGR (%))
Table 41 Italy Direct-to-Patient Market by Value, 2022-2032 (US$ Mn, AGR (%), CAGR (%))
Table 42 Spain Direct-to-Patient Market by Value, 2022-2032 (US$ Mn, AGR (%), CAGR (%))
Table 43 Rest of Europe Direct-to-Patient Market by Value, 2022-2032 (US$ Mn, AGR (%), CAGR (%))
Table 44 Asia-Pacific Direct-to-Patient Market by Value, 2022-2032 (US$ Mn, AGR (%), CAGR (%))
Table 45 Asia-Pacific Direct-to-Patient Market by Type, 2022-2032 (US$ Mn, AGR (%), CAGR (%))
Table 46 Asia-Pacific Direct-to-Patient Market by Marketing, 2022-2032 (US$ Mn, AGR (%), CAGR (%))
Table 47 Asia-Pacific Direct-to-Patient Market by Health Services, 2022-2032 (US$ Mn, AGR (%), CAGR (%))
Table 48 Asia-Pacific Direct-to-Patient Market by Clinical Trials, 2022-2032 (US$ Mn, AGR (%), CAGR (%))
Table 49 Asia-Pacific Direct-to-Patient Market Logistics, 2022-2032 (US$ Mn, AGR (%), CAGR (%))
Table 50 Asia-Pacific Direct-to-Patient Market by Therapeutics, 2022-2032 (US$ Mn, AGR (%), CAGR (%))
Table 51 Asia-Pacific Direct-to-Patient Market by Model, 2022-2032 (US$ Mn, AGR (%), CAGR (%))
Table 52 Asia-Pacific Direct-to-Patient Market by Country, 2022-2032 (US$ Mn, AGR (%), CAGR (%))
Table 53 China Direct-to-Patient Market by Value, 2022-2032 (US$ Mn, AGR (%), CAGR (%))
Table 54 India Direct-to-Patient Market by Value, 2022-2032 (US$ Mn, AGR (%), CAGR (%))
Table 55 Japan Direct-to-Patient Market by Value, 2022-2032 (US$ Mn, AGR (%), CAGR (%))
Table 56 Australia Direct-to-Patient Market by Value, 2022-2032 (US$ Mn, AGR (%), CAGR (%))
Table 57 South Korea Direct-to-Patient Market by Value, 2022-2032 (US$ Mn, AGR (%), CAGR (%))
Table 58 Rest of Asia-Pacific Direct-to-Patient Market by Value, 2022-2032 (US$ Mn, AGR (%), CAGR (%))
Table 59 Latin America Direct-to-Patient Market by Value, 2022-2032 (US$ Mn, AGR (%), CAGR (%))
Table 60 Latin America Direct-to-Patient Market by Type, 2022-2032 (US$ Mn, AGR (%), CAGR (%))
Table 61 Latin America Direct-to-Patient Market by Marketing, 2022-2032 (US$ Mn, AGR (%), CAGR (%))
Table 62 Latin America Direct-to-Patient Market by Health Services, 2022-2032 (US$ Mn, AGR (%), CAGR (%))
Table 63 Latin America Direct-to-Patient Market by Clinical Trials, 2022-2032 (US$ Mn, AGR (%), CAGR (%))
Table 64 Latin America Direct-to-Patient Market Logistics, 2022-2032 (US$ Mn, AGR (%), CAGR (%))
Table 65 Latin America Direct-to-Patient Market by Therapeutics, 2022-2032 (US$ Mn, AGR (%), CAGR (%))
Table 66 Latin America Direct-to-Patient Market by Model, 2022-2032 (US$ Mn, AGR (%), CAGR (%))
Table 67 Latin America Direct-to-Patient Market by Country, 2022-2032 (US$ Mn, AGR (%), CAGR (%))
Table 68 Brazil Direct-to-Patient Market by Value, 2022-2032 (US$ Mn, AGR (%), CAGR (%))
Table 69 Mexico Direct-to-Patient Market by Value, 2022-2032 (US$ Mn, AGR (%), CAGR (%))
Table 70 Rest of Latin America Direct-to-Patient Market by Value, 2022-2032 (US$ Mn, AGR (%), CAGR(%))
Table 71 MEA Direct-to-Patient Market by Value, 2022-2032 (US$ Mn, AGR (%), CAGR (%))
Table 72 MEA Direct-to-Patient Market by Type, 2022-2032 (US$ Mn, AGR (%), CAGR (%))
Table 73 MEA Direct-to-Patient Market by Marketing, 2022-2032 (US$ Mn, AGR (%), CAGR (%))
Table 74 MEA Direct-to-Patient Market by Health Services, 2022-2032 (US$ Mn, AGR (%), CAGR (%))
Table 75 MEA Direct-to-Patient Market by Clinical Trials, 2022-2032 (US$ Mn, AGR (%), CAGR (%))
Table 76 MEA Direct-to-Patient Market Logistics, 2022-2032 (US$ Mn, AGR (%), CAGR (%))
Table 77 MEA Direct-to-Patient Market by Therapeutics, 2022-2032 (US$ Mn, AGR (%), CAGR (%))
Table 78 MEA Direct-to-Patient Market by Model, 2022-2032 (US$ Mn, AGR (%), CAGR (%))
Table 79 MEA Direct-to-Patient Market by Country, 2022-2032 (US$ Mn, AGR (%), CAGR (%))
Table 80 Saudi Arabia Direct-to-Patient Market by Value, 2022-2032 (US$ Mn, AGR (%), CAGR (%))
Table 81 Turkey Direct-to-Patient Market by Value, 2022-2032 (US$ Mn, AGR (%), CAGR (%))
Table 82 UAE Direct-to-Patient Market by Value, 2022-2032 (US$ Mn, AGR (%), CAGR (%))
Table 83 South Africa Direct-to-Patient Market by Value, 2022-2032 (US$ Mn, AGR (%), CAGR (%))
Table 84 Rest of MEA Direct-to-Patient Market by Value, 2022-2032 (US$ Mn, AGR (%), CAGR (%))
Table 85 Agreement As Key Business Strategies Adopted by Key Players in Direct-to-Patient Market
Table 86 Contract As Key Business Strategies Adopted by Key Players in Direct-to-Patient Market
Table 87 Expansion As Key Business Strategies Adopted by Key Players in Direct-to-Patient Market
Table 88 Partnership As Key Business Strategies Adopted by Key Players in Direct-to-Patient Market
Table 89 Launch As Key Business Strategies Adopted by Key Players in Direct-to-Patient Market
Table 90 Access TeleCare: Key Details, (CEO, HQ, Revenue, Founded, No. of Employees, Company Type, Website, Business Segment)
Table 91 Access Telecare, .: Product Benchmarking
Table 92 Access TeleCare, .: Strategic Outlook
Table 93 AGNITY INC.: Key Details, (CEO, HQ, Revenue, Founded, No. of Employees, Company Type, Website, Business Segment)
Table 94 AGNITY INC.: Product Benchmarking
Table 95 AGNITY INC.: Strategic Outlook
Table 96 AMD Global Telemedicine: Key Details, (CEO, HQ, Revenue, Founded, No. of Employees, Company Type, Website, Business Segment)
Table 97 AMD Global Telemedicine: Product Benchmarking
Table 98 AMD Global Telemedicine: Strategic Outlook
Table 99 American Well: Key Details, (CEO, HQ, Revenue, Founded, No. of Employees, Company Type, Website, Business Segment)
Table 100 American Well: Product Benchmarking
Table 101 American Well: Strategic Outlook
Table 102 Avel eCare: Key Details, (CEO, HQ, Revenue, Founded, No. of Employees, Company Type, Website, Business Segment)
Table 103 Avera e Care: Product Benchmarking
Table 104 Avera e Care: Strategic Outlook
Table 105 Axs Health: Key Details, (CEO, HQ, Revenue, Founded, No. of Employees, Company Type, Website, Business Segment)
Table 106 Axs Health: Product Benchmarking
Table 107 Axs Healthcare: Strategic Outlook
Table 108 Babylon Health: Key Details, (CEO, HQ, Revenue, Founded, No. of Employees, Company Type, Website, Business Segment)
Table 109 Babylon Health: Product Benchmarking
Table 110 Babylon Health: Strategic Outlook
Table 111 Citius Tech: Key Details, (CEO, HQ, Revenue, Founded, No. of Employees, Company Type, Website, Business Segment)
Table 112 Citius Tech: Product Benchmarking
Table 113 Citius Tech: Strategic Outlook
Table 114 Dictum Health Inc: Key Details, (CEO, HQ, Revenue, Founded, No. of Employees, Company Type, Website, Business Segment)
Table 115 Dictum Health Inc: Product Benchmarking
Table 116 Dictum Health Inc: Strategic Outlook
Table 117 Doctor Anywhere: Key Details, (CEO, HQ, Revenue, Founded, No. of Employees, Company Type, Website, Business Segment)
Table 118 Doctor Anywhere: Product Benchmarking
Table 119 Doctor Anywhere: Strategic Outlook
Table 120 Doctor on demand: Key Details, (CEO, HQ, Revenue, Founded, No. of Employees, Company Type, Website, Business Segment)
Table 121 Doctor on demand: Product Benchmarking
Table 122 Doctor on demand: Strategic Outlook
Table 123 Health Partners: Key Details, (CEO, HQ, Revenue, Founded, No. of Employees, Company Type, Website, Business Segment)
Table 124 Health Partners: Product Benchmarking
Table 125 Health Partners: Strategic Outlook
Table 126 Health Tap: Key Details, (CEO, HQ, Revenue, Founded, No. of Employees, Company Type, Website, Business Segment)
Table 127 Health Tap: Product Benchmarking
Table 128 Health Tap: Strategic Outlook
Table 129 HIMS: Key Details, (CEO, HQ, Revenue, Founded, No. of Employees, Company Type, Website, Business Segment)
Table 130 HIMS: Product Benchmarking
Table 131 HIMS: Strategic Outlook
Table 132 Marken: Key Details, (CEO, HQ, Revenue, Founded, No. of Employees, Company Type, Website, Business Segment)
Table 133 Marken: Product Benchmarking
Table 134 Marken: Strategic Outlook
Table 135 20/20 NOW: Key Details, (CEO, HQ, Revenue, Founded, No. of Employees, Company Type, Website, Business Segment)
Table 136 20/20 NOW: Product Benchmarking
Table 137 20/20 NOW: Strategic Outlook
Table 138 NURX: Key Details, (CEO, HQ, Revenue, Founded, No. of Employees, Company Type, Website, Business Segment)
Table 139 NURX: Product Benchmarking
Table 140 NURX: Strategic Outlook
Table 141 Practo Technologies Pvt. Ltd: Key Details, (CEO, HQ, Revenue, Founded, No. of Employees, Company Type, Website, Business Segment)
Table 142 Practo Technologies Pvt Ltd: Product Benchmarking
Table 143 Practo Technologies Pvt Ltd: Strategic Outlook
Table 144 Specialists on call, Inc: Key Details, (CEO, HQ, Revenue, Founded, No. of Employees, Company Type, Website, Business Segment)
Table 145 Specialists on call, Inc: Product Benchmarking
Table 146 Specialists on call, Inc: Strategic Outlook
Table 147 Teladoc Health Inc: Key Details, (CEO, HQ, Revenue, Founded, No. of Employees, Company Type, Website, Business Segment)
Table 148 Teladoc Health Inc: Product Benchmarking
Table 149 Teladoc Health Inc: Strategic Outlook
Table 150 True pill: Key Details, (CEO, HQ, Revenue, Founded, No. of Employees, Company Type, Website, Business Segment)
Table 151 True pill: Product Benchmarking
Table 152 True pill: Strategic Outlook
Table 153 Up Script Health: Key Details, (CEO, HQ, Revenue, Founded, No. of Employees, Company Type, Website, Business Segment)
Table 154 Up Script Health: Product Benchmarking
Table 155 Up Script Health: Strategic Outlook
List of Figures
Figure 1 Schematics showing benefits of Direct-To-Patient Model
Figure 2 Direct-to-Patient Market Segmentation
Figure 3 Direct-to-Patient Market Forecast by Region: Market Attractiveness Index
Figure 4 Direct-to-Patient Market by Type: Market Attractiveness Index
Figure 5 Direct-to-Patient Market by Marketing: Market Attractiveness Index
Figure 6 Direct-to-Patient Market by Health Services: Market Attractiveness Index
Figure 7 Direct-to-Patient Market by Clinical Trials: Market Attractiveness Index
Figure 8 Direct-to-Patient Market by Logistics: Market Attractiveness Index
Figure 9 Direct-to-Patient Market by Therapeutics: Market Attractiveness Index
Figure 10 Direct-to-Patient Market by Model: Market Attractiveness Index
Figure 11 Direct-to-Patient Market: Market Dynamics
Figure 12 Direct-to-Patient Market Forecast, 2022-2032 (US$ Mn, AGR (%), CAGR (%)) (V-Shaped Recovery Scenario)
Figure 13 Direct-to-Patient Market Forecast by Region, 2022-2032 (US$ Mn, AGR (%), CAGR (%)) (V-Shaped Recovery Scenario)
Figure 14 Direct-to-Patient Market Forecast, 2022-2032 (US$ Mn, AGR (%), CAGR (%)) (W-Shaped Recovery Scenario)
Figure 15 Direct-to-Patient Market Forecast by Region, 2022-2032 (US$ Mn, AGR (%), CAGR (%)) (W-Shaped Recovery Scenario)
Figure 16 Direct-to-Patient Market Forecast, 2022-2032 (US$ Mn, AGR (%), CAGR (%)) (U-Shaped Recovery Scenario)
Figure 17 Direct-to-Patient Market Forecast by Region, 2022-2032 (US$ Mn, AGR (%), CAGR (%)) (U-Shaped Recovery Scenario)
Figure 18 Direct-to-Patient Market Forecast, 2022-2032 (US$ Mn, AGR (%), CAGR (%)) (L-Shaped Recovery Scenario)
Figure 19 Direct-to-Patient Market Forecast by Region, 2022-2032 (US$ Mn, AGR (%), CAGR (%)) (L-Shaped Recovery Scenario)
Figure 20 Direct-to-Patient Market: Porter’s Five Forces Analysis
Figure 21 Direct-to-Patient Market: PEST Analysis
Figure 22 Direct-To-Patient Market by Type: Market Attractiveness Index
Figure 23 Direct-to-Patient Market by Type, 2022-2032 (US$ Mn, AGR (%)
Figure 24 Direct-To-Patient Market by Marketing: Market Attractiveness Index
Figure 25 Direct-to-Patient Market by Marketing, 2022-2032 (US$ Mn, AGR (%))
Figure 26 Direct-to-Patient Market Forecast by Direct-to-Patient Health Services: Market Attractiveness Index
Figure 27 Direct-to-Patient Market by Health Services, 2022-2032 (US$ Mn, AGR (%))
Figure 28 Direct-to-Patient Market Forecast by Clinical Trials: Market Attractiveness Index
Figure 29 Direct-to-Patient Market by Clinical Trials, 2022-2032 (US$ Mn, AGR (%))
Figure 30 Direct-To-Patient Market Forecast by Direct-to-Patient Logistics: Market Attractiveness Index
Figure 31 Direct-to-Patient Market Logistics, 2022-2032 (US$ Mn, AGR (%))
Figure 32 Direct-to-Patient Market Forecast by Therapeutics: Market Attractiveness Index
Figure 33 Direct-to-Patient Market by Therapeutics, 2022-2032 (US$ Mn, AGR (%)
Figure 34 Direct-to-Patient Market Forecast by Model: Market Attractiveness Index
Figure 35 Direct-to-Patient Market by Model, 2022-2032 (US$ Mn, AGR (%)
Figure 36 Direct-to-Patient Market Attractiveness Index by Region: Market Attractiveness Index
Figure 37 Direct-to-Patient Market Forecast, 2022-2032 (US$ Mn, AGR (%))
Figure 38 Direct-to-Patient Market by Region, 2022-2032 (US$ Mn, AGR (%))
Figure 39 Direct-to-Patient Market Attractiveness Index by Region 2022, 2032 (Revenue, CAGR%)
Figure 40 North America Direct-to-Patient Market by Value, 2022-2032 (US$ Mn, AGR (%))
Figure 41 North America Direct-to-Patient Market Share Forecast by Type 2022-2033 (%)
Figure 42 North America Direct-to-Patient Market by Marketing, 2022-2032 (US$ Mn, AGR %)
Figure 43 North America Direct-to-Patient Market Share Forecast by Marketing 2022-2032 (%)
Figure 44 North America Direct-to-Patient Market by Health Services, 2022-2032 (US$ Mn, AGR (%))
Figure 45 North America Direct-to-Patient Market Share Forecast by Health Services 2022-2032 (%)
Figure 46 North America Direct-to-Patient Market by Clinical Trials, 2022-2032 (US$ Mn, AGR (%))
Figure 47 North America Direct-to-Patient Market Share Forecast by Clinical Trial 2023-2033 (%)
Figure 48 North America Direct-to-Patient Market Logistics, 2022-2032 (US$ Mn, AGR (%))
Figure 49 North America Direct-to-Patient Market Share Forecast by Logistics 2022-2032 (%)
Figure 50 North America Direct-to-Patient Market by Therapeutics, 2022-2032 (US$ Mn, AGR %)
Figure 51 North America Direct-to-Patient Market Share Forecast by Therapeutics 2022-2032 (%)
Figure 52 North America Direct-to-Patient Market by Model, 2022-2032 (US$ Mn, AGR (%))
Figure 53 North America Direct-to-Patient Market Share Forecast by Model 2023-2033 (%)
Figure 54 North America Direct-to-Patient Market by Country, 2022-2032 (US$ Mn, AGR (%))
Figure 55 North America Direct-to-Patient Market Share Forecast by Country 2023-2033 (%)
Figure 56 U.S. Direct-to-Patient Market by Value, 2022-2032 (US$ Mn, AGR (%))
Figure 57 Canada Direct-to-Patient Market by Value, 2022-2032 (US$ Mn, AGR (%))
Figure 58 Europe Direct-to-Patient Market Attractiveness Index by Region
Figure 59 Europe Direct-to-Patient Market by Value, 2022-2032 (US$ Mn, AGR (%))
Figure 60 Europe Direct-to-Patient Market by Type, 2022-2032 (US$ Mn, AGR (%))
Figure 61 Europe Direct-to-Patient Market Share Forecast by Type 2022-2032 (%)
Figure 62 Europe Direct-to-Patient Market by Marketing, 2022-2032 (US$ Mn, AGR (%))
Figure 63 Europe Direct-to-Patient Market Share Forecast by Marketing 2022-2032 (%)
Figure 64 Europe Direct-to-Patient Market by Health Services, 2022-2032 (US$ Mn, AGR (%))
Figure 65 Europe Direct-to-Patient Market Share Forecast by Health Services 2022-2032 (%)
Figure 66 Europe Direct-to-Patient Market by Clinical Trials, 2022-2032 (US$ Mn, AGR (%))
Figure 67 Europe Direct-to-Patient Market Share Forecast by Clinical Trials 2022-2032 (%)
Figure 68 Europe Direct-to-Patient Market Logistics, 2022-2032 (US$ Mn, AGR (%))
Figure 69 Europe Direct-to-Patient Market Share Forecast by Logistics 2022-2032 (%)
Figure 70 Europe Direct-to-Patient Market by Therapeutics, 2022-2032 (US$ Mn, AGR (%))
Figure 71 Europe Direct-to-Patient Market Share Forecast by Therapeutics 2022-2032 (%)
Figure 72 Europe Direct-to-Patient Market by Model, 2022-2032 (US$ Mn, AGR (%))
Figure 73 Europe Direct-to-Patient Market Share Forecast by Model 2022-2032 (%)
Figure 74 Europe Direct-to-Patient Market by Country, 2022-2032 (US$ Mn, AGR (%))
Figure 75 Europe Direct-to-Patient Market Share Forecast by Country 2022-2032 (%)
Figure 76 Germany Direct-to-Patient Market by Value, 2022-2032 (US$ Mn, AGR (%))
Figure 77 UK Direct-to-Patient Market by Value, 2022-2032 (US$ Mn, AGR (%))
Figure 78 France Direct-to-Patient Market by Value, 2022-2032 (US$ Mn, AGR (%))
Figure 79 Italy Direct-to-Patient Market by Value, 2022-2032 (US$ Mn, AGR (%))
Figure 80 Spain Direct-to-Patient Market by Value, 2022-2032 (US$ Mn, AGR (%))
Figure 81 Rest of Europe Direct-to-Patient Market by Value, 2022-2032 (US$ Mn, AGR (%))
Figure 82 Asia Pacific Direct-to-Patient Market Attractiveness Index by Region
Figure 83 Asia-Pacific Direct-to-Patient Market by Value, 2022-2032 (US$ Mn, AGR (%))
Figure 84 Asia-Pacific Direct-to-Patient Market by Country, 2022-2032 (US$ Mn, AGR %))
Figure 85 Asia Pacific Direct-to-Patient Market Share Forecast by Type 2022-2032 (%)
Figure 86 Asia-Pacific Direct-to-Patient Market by Marketing, 2022-2032 (US$ Mn, AGR (%))
Figure 87 Asia Pacific Direct-to-Patient Market Share Forecast by Marketing 2022-2032 (%)
Figure 88 Asia-Pacific Direct-to-Patient Market by Health Services, 2022-2032 (US$ Mn, AGR (%))
Figure 89 Asia Pacific Direct-to-Patient Market Share Forecast by Health Services 2022-2032 (%)
Figure 90 Asia-Pacific Direct-to-Patient Market by Clinical Trials, 2022-2032 (US$ Mn, AGR (%))
Figure 91 Asia Pacific Direct-to-Patient Market Share Forecast by Clinical Trials 2022-2032 (%)
Figure 92 Asia-Pacific Direct-to-Patient Market Logistics, 2022-2032 (US$ Mn, AGR (%))
Figure 93 Asia Pacific Direct-to-Patient Market Share Forecast by Logistics 2022-2032 (%)
Figure 94 Asia-Pacific Direct-to-Patient Market by Therapeutics, 2022-2032 (US$ Mn, AGR (%))
Figure 95 Asia Pacific Direct-to-Patient Market Share Forecast by Therapeutics 2022-2032 (%)
Figure 96 Asia-Pacific Direct-to-Patient Market by Model, 2022-2032 (US$ Mn, AGR (%))
Figure 97 Asia Pacific Direct-to-Patient Market Share Forecast by Models 2022-2032 (%)
Figure 98 Asia-Pacific Direct-to-Patient Market by Country, 2022-2032 (US$ Mn, AGR %))
Figure 99 Asia Pacific Direct-to-Patient Market Share Forecast by Country 2023-2033 (%)
Figure 100 China Direct-to-Patient Market by Value, 2022-2032 (US$ Mn, AGR (%))
Figure 101 India Direct-to-Patient Market by Value, 2022-2032 (US$ Mn, AGR (%))
Figure 102 Japan Direct-to-Patient Market by Value, 2022-2032 (US$ Mn, AGR (%))
Figure 103 Australia Direct-to-Patient Market by Value, 2022-2032 (US$ Mn, AGR (%))
Figure 104 South Korea Direct-to-Patient Market by Value, 2022-2032 (US$ Mn, AGR (%))
Figure 105 Rest of Asia-Pacific Direct-to-Patient Market by Value, 2022-2032 (US$ Mn, AGR (%))
Figure 106 Latin America Direct-to-Patient Market Attractiveness Index by Region
Figure 107 Latin America Direct-to-Patient Market by Value, 2022-2032 (US$ Mn, AGR (%))
Figure 108 Latin America Direct-to-Patient Market by Type, 2022-2032 (US$ Mn, AGR (%))
Figure 109 Latin America Direct-to-Patient Market Share Forecast by Type 2022-2032 (%)
Figure 110 Latin America Direct-to-Patient Market by Marketing, 2022-2032 (US$ Mn, AGR (%))
Figure 111 Latin America Direct-to-Patient Market Share Forecast by Marketing 2022-2032 (%)
Figure 112 Latin America Direct-to-Patient Market by Health Services, 2022-2032 (US$ Mn, AGR (%))
Figure 113 Latin America Direct-to-Patient Market Share Forecast by Health Services 2022-2032 (%)
Figure 114 Latin America Direct-to-Patient Market by Clinical Trials, 2022-2032 (US$ Mn, AGR (%))
Figure 115 Latin America Direct-to-Patient Market Share Forecast by Clinical Trials 2022-2032 (%)
Figure 116 Latin America Direct-to-Patient Market Logistics, 2022-2032 (US$ Mn, AGR (%))
Figure 117 Latin America Direct-to-Patient Market Share Forecast by Logistics 2022-2032 (%)
Figure 118 Latin America Direct-to-Patient Market by Therapeutics, 2022-2032 (US$ Mn, AGR (%))
Figure 119 Latin America Direct-to-Patient Market Share Forecast by Therapeutics 2022-2032 (%)
Figure 120 Latin America Direct-to-Patient Market by Model, 2022-2032 (US$ Mn, AGR (%))
Figure 121 Latin America Direct-to-Patient Market Share Forecast by Model 2023-2033 (%)
Figure 122 Latin America Direct-to-Patient Market by Country, 2022-2032 (US$ Mn, AGR (%))
Figure 123 Latin America Direct-to-Patient Market Share Forecast by country 2023-2033 (%)
Figure 124 Brazil Direct-to-Patient Market by Value, 2022-2032 (US$ Mn, AGR (%))
Figure 125 Mexico Direct-to-Patient Market by Value, 2022-2032 (US$ Mn, AGR (%))
Figure 126 Rest of Latin America Direct-to-Patient Market by Value, 2022-2032 (US$ Mn, AGR (%))
Figure 127 MEA Direct-to-Patient Market Attractiveness Index by Region
Figure 128 MEA Direct-to-Patient Market by Value, 2022-2032 (US$ Mn, AGR (%))
Figure 129 MEA Direct-to-Patient Market by Type, 2022-2032 (US$ Mn, AGR (%))
Figure 130 MEA Direct-to-Patient Market Share Forecast by Type 2022-2032 (%)
Figure 131 MEA Direct-to-Patient Market by Marketing, 2022-2032 (US$ Mn, AGR (%))
Figure 132 MEA Direct-to-Patient Market Share Forecast by Marketing 2022-2032 (%)
Figure 133 MEA Direct-to-Patient Market by Health Services, 2022-2032 (US$ Mn, AGR (%))
Figure 134 MEA Direct-to-Patient Market Share Forecast by Health Services 2022-2032 (%)
Figure 135 MEA Direct-to-Patient Market by Clinical Trials, 2022-2032 (US$ Mn, AGR (%))
Figure 136 MEA Direct-to-Patient Market Share Forecast by Clinical Trial 2022-2032 (%)
Figure 137 MEA Direct-to-Patient Market Logistics, 2022-2032 (US$ Mn, AGR (%))
Figure 138 MEA Direct-to-Patient Market Share Forecast by Logistics 2022-2032 (%)
Figure 139 MEA Direct-to-Patient Market by Therapeutics, 2022-2032 (US$ Mn, AGR (%))
Figure 140 MEA Direct-to-Patient Market Share Forecast by Therapeutics 2022-2032 (%)
Figure 141 MEA Direct-to-Patient Market by Model, 2022-2032 (US$ Mn, AGR (%))
Figure 142 MEA Direct-to-Patient Market Share Forecast by Model 2022-2032 (%)
Figure 143 MEA Direct-to-Patient Market by Country, 2022-2032 (US$ Mn, AGR (%))
Figure 144 MEA Direct-to-Patient Market Share Forecast by Country 2022-2032 (%)
Figure 145 Saudi Arabia Direct-to-Patient Market by Value, 2022-2032 (US$ Mn, AGR (%))
Figure 146 Turkey Direct-to-Patient Market by Value, 2022-2032 (US$ Mn, AGR (%))
Figure 147 UAE Direct-to-Patient Market by Value, 2022-2032 (US$ Mn, AGR (%))
Figure 148 South Africa Direct-to-Patient Market by Value, 2022-2032 (US$ Mn, AGR (%))
Figure 149 Rest of MEA Direct-to-Patient Market by Value, 2022-2032 (US$ Mn, AGR (%))
Figure 150 American Well: Net Revenue, 2018-2021 (US$ million, AGR (%))
Figure 151 American Well: Operating Income 2018-2021 (US$ million, AGR (%))
Figure 152 American Well: Research & Development Expenses 2018-2021 (US$ million, AGR (%))
Figure 153 Babylon Health: Net Revenue, 2019-2021 (US$ million, AGR%)
Figure 154 Babylon Health: Operating Income, 2019-2021 (US$ million, AGR%)
Figure 155 Babylon Health: R&D Expenses 2019-2021 (US$ million, AGR%)
Figure 156 Health Partners: Net Revenue, 2018-2020 (US$ million, AGR (%))
Figure 157 Health Partners: Operating Income, 2018-2020 (US$ million, AGR (%))
Figure 158 HIMS: Net Revenue, 2019-2021 (US$ million, AGR (%))
Figure 159 HIMS: R&D Expenses, 2019-2021 (US$ million, AGR (%))
Figure 160 Specialists on call, Inc: Revenue, 2019-2021 (US$ million, AGR (%))
Figure 161 Specialists on call, Inc: R&D Expense 2019-2021 (US$ million, AGR%)
Figure 162 Teladoc, Health Inc: Revenue, 2017-2021 (US$ million, AGR (%))
Figure 163 Teladoc, Health Inc: Operating Income, 2017-2021 (US$ million, AGR(%))
Figure 164 Teladoc, Health Inc Research & Development Expenses 2017-2021 (US$ million, AGR (%))
ページTOPに戻る
本レポートと同じKEY WORD()の最新刊レポート
- 本レポートと同じKEY WORDの最新刊レポートはありません。
よくあるご質問
Visiongain社はどのような調査会社ですか?
英国の調査会社ヴィジョンゲイン社(Visiongain)は、通信とエネルギーのほか、自動車や化学・医薬品、金属など、広範な市場を対象に調査を行っています。自動車市場については、市場全般に関する調査のほ... もっと見る
調査レポートの納品までの日数はどの程度ですか?
在庫のあるものは速納となりますが、平均的には 3-4日と見て下さい。
但し、一部の調査レポートでは、発注を受けた段階で内容更新をして納品をする場合もあります。
発注をする前のお問合せをお願いします。
注文の手続きはどのようになっていますか?
1)お客様からの御問い合わせをいただきます。
2)見積書やサンプルの提示をいたします。
3)お客様指定、もしくは弊社の発注書をメール添付にて発送してください。
4)データリソース社からレポート発行元の調査会社へ納品手配します。
5) 調査会社からお客様へ納品されます。最近は、pdfにてのメール納品が大半です。
お支払方法の方法はどのようになっていますか?
納品と同時にデータリソース社よりお客様へ請求書(必要に応じて納品書も)を発送いたします。
お客様よりデータリソース社へ(通常は円払い)の御振り込みをお願いします。
請求書は、納品日の日付で発行しますので、翌月最終営業日までの当社指定口座への振込みをお願いします。振込み手数料は御社負担にてお願いします。
お客様の御支払い条件が60日以上の場合は御相談ください。
尚、初めてのお取引先や個人の場合、前払いをお願いすることもあります。ご了承のほど、お願いします。
データリソース社はどのような会社ですか?
当社は、世界各国の主要調査会社・レポート出版社と提携し、世界各国の市場調査レポートや技術動向レポートなどを日本国内の企業・公官庁及び教育研究機関に提供しております。
世界各国の「市場・技術・法規制などの」実情を調査・収集される時には、データリソース社にご相談ください。
お客様の御要望にあったデータや情報を抽出する為のレポート紹介や調査のアドバイスも致します。
|
|


