医薬品の凍結乾燥市場レポート:2023-2033
Lyophilisation in Pharmaceutical Market Report 2023-2033
レポート詳細
医薬品の凍結乾燥の市場レポート 2023-2033 :本レポートは、新たな収益の柱を目指すリーディングカンパニーが、業界とその背景にあるダイナミクスをより深く理解する上で、非常に有益な... もっと見る
※上記価格は部署ライセンス(Departmental licence)価格です。
その他の価格についてはデータリソースまでお問合せください。
日本語のページは自動翻訳を利用し作成しています。
実際のレポートは英文のみでご納品いたします。
サマリー
レポート詳細
医薬品の凍結乾燥の市場レポート 2023-2033:本レポートは、新たな収益の柱を目指すリーディングカンパニーが、業界とその背景にあるダイナミクスをより深く理解する上で、非常に有益なものとなるでしょう。また、異業種への進出や新地域での既存事業の拡大を目指す企業にとっても有用なレポートです。
慢性疾患の有病率増加と製品承認数の増加が市場成長を牽引
ファーストフードの消費、アルコール、タバコの喫煙といったライフスタイルの変化は、慢性疾患の有病率を高めると考えられています。慢性疾患を患う人々の増加に伴い、高度な薬剤や治療オプションに対する需要が高まり、それが将来の医薬品の凍結乾燥市場の成長を後押しすることになるでしょう。
業界の大半のプレーヤーは、市場に投入する薬剤の強力なパイプラインを有しています。このため、近年は製品承認の数が増加しています。がんやその他の疾患の治療用医薬品に凍結乾燥を適用するための製品承認を得るため、さまざまな組織で臨床試験が実施されています。このような継続的な製品承認と医療費の増加により、この業界は将来的に力強い成長を遂げるでしょう。
保存期間の長い安定した製剤への需要の高まりが、業界の成長を後押しする
凍結乾燥製剤の開発への注目が高まるにつれ、製薬会社は凍結乾燥によってより安定した製品を製造することを推奨しています。医薬品、バイオテクノロジー、バイオメディカル、バイオプロセスなどの分野では、長期保存性と安定性が非常に重要です。医薬品は乾燥状態であればより安定で、2年から5年という長い保存期間を実現し、製品の輸送をより容易にします。医薬品の凍結乾燥の需要は大幅に伸びると予想され、この分野で事業を展開する企業に有利な成長機会を提供することになるでしょう。
膨大な数の製品リコールが市場成長の妨げになる可能性
最近の製品回収件数の増加は、医薬品の凍結乾燥市場の成長を阻害する可能性があります。米国FDAは最近、サンファーマシューティカル社の医薬品3ロットにガラス粒子が混入していたとして、製品回収を通達しました。さらに、副作用や異物混入などによる市場関係者のリコール件数の大幅な増加が、市場の成長を阻害する可能性があります。
マーケットリサーチレポートを購入する前に、どのような質問をすべきでしょうか?
- 医薬品の凍結乾燥市場はどのように進化しているのか?
- 医薬品の凍結乾燥市場の推進要因と抑制要因は何か?
- 医薬品の凍結乾燥の各サブマーケットは予測期間中にどのように成長し、2033年にこれらのサブマーケットが占める売上高はどの程度になるのでしょうか?
- 2023年から2033年にかけて、医薬品の凍結乾燥の各サブマーケットの市場シェアはどのように推移するのでしょうか?
- 2023年から2033年にかけて、市場全体の主なドライバーは何でしょうか?
- 医薬品の凍結乾燥の主要市場はマクロ経済のダイナミクスに概ね追随するのか、それとも個々の国内市場が他を凌駕するのでしょうか?
- 2033年までに各国市場のシェアはどのように変化し、どの地域が2033年の市場をリードするのでしょうか?
- 主要プレイヤーは誰か、また予測期間中の展望は?
- これらの主要企業の医薬品の凍結乾燥プロジェクトはどのようなものですか?
- 2023年から2033年の間に、業界はどのように進化していくのでしょうか?現在および今後 10 年間に行われる医薬品の凍結乾燥プロジェクトにはどのような意味があるのでしょうか?
- 医薬品の凍結乾燥市場の規模をさらに拡大するために、製品の商業化の必要性は高まっているのでしょうか?
- 医薬品の凍結乾燥市場はどこへ向かい、どのようにして市場の最前線に立つことを確実にすることができますか?
- 新製品やサービスラインに対する最適な投資オプションは何ですか?
- 企業を新たな成長軌道に乗せ、C-suiteに移行させるための重要な展望は何か?
このことが、現在および今後10年間の医薬品の凍結乾燥市場にどのような影響を与えるかを知る必要があります。
- 260ページにわたる本レポートでは、114の表と183のグラフを独占的に提供します。
- このレポートでは、業界における主要な収益性の高い分野をハイライトしているため、今すぐターゲットを絞ることができます。
- 世界、地域、国別の売上高と成長率を詳細に分析しています。
- 競合他社が成功した主なトレンド、変化、収益予測をハイライトしています。
本レポートは、医薬品の凍結乾燥市場が今後10年間にどのように発展し、COVID-19の景気後退と回復の変動に沿うものであるかを今日あなたに伝えます。この市場は、過去10年間のどの時点よりも、今がより重要なのです。
2033年までの予測やその他の分析により、商業的な展望が見えてきた
- 2033年までの収益予測に加え、直近の実績、成長率、市場シェアもご覧いただけます。
- ビジネスの展望や展開など、独自の分析もご覧いただけます。
- 定性的分析(市場力学、ドライバー、機会、抑制、課題など)、ポーターの5つの力分析、PEST分析、最近の動向などをご覧いただけます。
本レポートでは、COVID-19が業界と貴社にどのような影響を与えるかについて、データ分析と貴重な洞察を掲載しています。本レポートでは、COVID-19の4つの回収パターンとその影響、すなわち「V」、「L」、「W」、「U」について論じています。
報告書の対象セグメント
薬剤タイプ
- 抗感染症
- 抗悪性腫瘍剤
- 抗凝固剤
- ホルモン剤
- 抗不整脈薬
- その他
デリバリータイプ
- プレフィルド希釈用シリンジ
- マルチステップデバイス
適応症
- 自己免疫疾患
- 呼吸器疾患
- 消化器系疾患
- 腫瘍学
- 循環器系疾患
- 感染症
- 代謝性疾患
- その他
パッケージ
- バイアル
- カートリッジ
- プレフィルドデバイス
世界市場全体とセグメントの収益予測に加え、5つの地域と16の主要国市場の収益予測も掲載しています。
北米
- 米国
- カナダ
欧州
- ドイツ
- 英国
- フランス
- イタリア
- スペイン
- ロシア
- その他の欧州
アジア太平洋
- 中国
- 日本
- インド
- オーストラリア
- 韓国
- その他のアジア太平洋地域
ラテンアメリカ
- ブラジル
- メキシコ
- その他のラテンアメリカ地域
MEA
- GCC
- 南アフリカ
- その他のMEA
医薬品における凍結乾燥市場の2023年から2033年にかけての主要企業のプロファイルと、これらの企業のこのセグメントに焦点を当てたものも含まれています。
主要企業と市場成長の可能性
・ Aurobindo Pharma
・ Bristol-Myers Squibb Company
・ Cipla Inc.
・ Fresenius Kabi AG
・ Gilead Sciences, Inc.
・ Johnson & Johnson Services, Inc.
・ Merck & Co., Inc.
・ Novo Nordisk A/S
・ F. Hoffmann-La Roche Ltd
・ Sanofi
・ Takeda Pharmaceutical Company Limited
・ Vetter Pharma
・ Zydus Group
医薬品における凍結乾燥市場の世界全体の収益、2023年から2033年まで、金額ベースで2023年に2820億米ドルを突破すると、我々の仕事は計算しています。2033年まで力強い収益成長が予測されます。本調査では、最も大きな可能性を秘めた組織を特定します。彼らの能力、進歩、商業的展望を発見することで、一歩先を行くことができます。
医薬品の凍結乾燥市場、2023年から2033年までのレポートはどのように役立つのでしょうか?
260ページに及ぶ報告書をまとめると、以下のような知見が得られます。
- 医薬品における凍結乾燥市場、2023年から2033年までの収益予測 薬剤タイプ、送達タイプ、適応症、包装の各予測を、世界および地域レベルで掲載 - 業界の展望を見出し、投資と収益に最も有利な場所を発見することができます。
- 5つの地域と16の主要国市場の2033年までの収益予測 - 北米、欧州、アジア太平洋、中南米、中東・アフリカの医薬品における凍結乾燥市場、2023年から2033年の市場予測をご覧いただけます。また、米国、カナダ、メキシコ、ブラジル、ドイツ、フランス、イギリス、イタリア、中国、インド、日本、オーストラリアなど、著名な経済圏の市場も予測しています。
- 既存企業や市場参入を目指す企業の展望 - 医薬品における凍結乾燥市場の2023年から2033年に関わる主要企業の企業プロファイルを含みます。
定量的・定性的な分析と独自の予測をご覧いただけます。私たちのレポートだけが持つ情報を入手し、貴重なビジネスインテリジェンスを得ることができます。
他にはない情報
私たちの新しいレポートがあれば、知識の遅れを取り戻し、チャンスを逃す可能性が低くなります。私たちの研究が貴社の調査、分析、意思決定にどのように役立つかをご覧ください。Visiongainの調査は、医薬品の凍結乾燥市場の2023年から2033年までの商業分析を必要とするすべての人、市場の主要な企業のためのものです。データ、トレンド、予測を見つけることができます。
ページTOPに戻る
目次
目次
1.レポートの概要
1.1 研究の目的
1.2 医薬品の凍結乾燥市場の紹介
1.3 本レポートが提供するもの
1.4 本レポートを読むべき理由
1.5 本分析レポートが回答する主要な質問
1.6 本レポートは誰のためのものなのか?
1.7 方法論
1.7.1 市場の定義
1.7.2 市場評価・予測手法
1.7.3 データの検証
1.7.3.1 一次調査
1.7.3.2 セカンダリーリサーチ
1.8 よくある質問(FAQ)
1.9 関連するVisiongainのレポート
1.10 Visiongainについて
2 エグゼクティブサマリー
3 市場の概要
3.1 主要な調査結果
3.2 マーケットダイナミクス
3.2.1 市場の推進要因
3.2.1.1 慢性疾患の有病率の増加
3.2.1.2 医薬品の凍結乾燥の製品承認数の増加
3.2.1.3 医薬品の凍結乾燥開発における技術的進歩
3.2.2 市場抑制要因
3.2.2.1 膨大な数の製品リコール
3.2.2.2 凍結乾燥製剤の製造コストの高さ
3.2.3 市場機会
3.2.3.1 業界における研究開発活動の活発化
3.2.3.2 製薬・バイオテクノロジー業界における製品の凍結乾燥に対する需要の増加
3.2.3.3 より長い保存期間と安定性を持つ優れた製品への需要の高まり
3.3 COVID-19の影響度分析
3.4 ポーターのファイブフォース分析
3.4.1 供給者のバーゲニングパワー
3.4.2 バイヤーのバーゲニングパワー
3.4.3 競争相手との競合
3.4.4 代替品による脅威
3.4.5 新規参入者の脅威
3.5 PEST分析
4 医薬品の凍結乾燥市場分析:薬物タイプ別
4.1 主な調査結果
4.2 薬剤タイプ別セグメント市場魅力度指数
4.3 医薬品の凍結乾燥の薬剤タイプ別市場規模の推定と予測
4.4 抗感染症
4.4.1 地域別市場規模、2023-2033 (10億米ドル)
4.4.2 地域別市場シェア、2023年&2033年(%)
4.5 抗悪性腫瘍剤
4.5.1 地域別市場規模、2023年〜2033年 (10億米ドル)
4.5.2 地域別市場シェア、2023年&2033年(%)
4.6 抗凝固剤
4.6.1 地域別市場規模、2023年〜2033年 (10億米ドル)
4.6.2 地域別市場シェア、2023年&2033年(%)
4.7 ホルモン剤
4.7.1 地域別市場規模、2023年〜2033年 (10億米ドル)
4.7.2 地域別市場シェア、2023年&2033年(%)
4.8 抗不整脈薬
4.8.1 地域別市場規模、2023年〜2033年 (bn米ドル)
4.8.2 地域別市場シェア、2023年&2033年(%)
4.9 その他
4.9.1 地域別市場規模、2023〜2033年 (bn米ドル)
4.9.2 地域別市場シェア、2023年&2033年(%)
5 医薬品の凍結乾燥の市場分析:デリバリータイプ別
5.1 主な調査結果
5.2 配送タイプ別セグメント市場魅力度指数
5.3 医薬品の凍結乾燥のデリバリータイプ別市場規模の推定と予測
5.4 プレフィルド希釈剤用シリンジ
5.4.1 地域別市場規模、2023-2033 (10億米ドル)
5.4.2 地域別市場シェア、2023年&2033年(%)
5.5 マルチステップデバイス
5.5.1 地域別市場規模、2023年~2033年 (10億米ドル)
5.5.2 地域別市場シェア、2023年&2033年(%)
6 医薬品の凍結乾燥市場分析:適応症別
6.1 主要な調査結果
6.2 適応症別セグメント市場魅力度指数
6.3 医薬品の凍結乾燥の適応症別市場規模の推定と予測
6.4 自己免疫疾患
6.4.1 地域別市場規模、2023〜2033年 (10億米ドル)
6.4.2 地域別市場シェア、2023年&2033年(%)
6.5 呼吸器系疾患
6.5.1 地域別市場規模、2023年〜2033年 (10億米ドル)
6.5.2 地域別市場シェア、2023年&2033年(%)
6.6 消化器系疾患
6.6.1 地域別市場規模、2023年~2033年 (10億米ドル)
6.6.2 地域別市場シェア、2023年&2033年(%)
6.7 腫瘍学
6.7.1 地域別市場規模、2023年〜2033年 (10億米ドル)
6.7.2 地域別市場シェア、2023年&2033年(%)
6.8 循環器疾患
6.8.1 地域別市場規模、2023年〜2033年 (10億米ドル)
6.8.2 地域別市場シェア、2023年&2033年(%)
6.9 感染症
6.9.1 地域別市場規模、2023年〜2033年 (10億米ドル)
6.9.2 地域別市場シェア、2023年&2033年(%)
6.10 代謝性疾患
6.10.1 地域別市場規模、2023年~2033年 (10億米ドル)
6.10.2 地域別市場シェア、2023年&2033年(%)
6.11 その他
6.11.1 地域別市場規模、2023年〜2033年 (10億米ドル)
6.11.2 地域別市場シェア、2023年&2033年(%)
7 医薬品の凍結乾燥市場分析:パッケージ別
7.1 主な調査結果
7.2 パッケージングセグメント市場魅力度指数
7.3 医薬品の凍結乾燥の包装別市場規模の推定と予測
7.4 バイアル
7.4.1 地域別市場規模、2023〜2033年 (億米ドル)
7.4.2 地域別市場シェア、2023年&2033年(%)
7.5 カートリッジ
7.5.1 地域別市場規模、2023年~2033年 (bn米ドル)
7.5.2 地域別市場シェア、2023年&2033年(%)
7.6 プレフィルドデバイス
7.6.1 地域別市場規模、2023年~2033年 (10億米ドル)
7.6.2 地域別市場シェア、2023年&2033年(%)
8 医薬品の凍結乾燥市場分析:地域別
8.1 主な調査結果
8.2 地域別セグメント市場魅力度指数
8.3 医薬品の凍結乾燥の市場規模の推定と予測
9 北米の医薬品の凍結乾燥市場分析
9.1 主な調査結果
9.2 北米医薬品の凍結乾燥市場の魅力度指数
9.3 北米医薬品の凍結乾燥の国別市場 2023年、2028年、2033年 (10億米ドル)
9.4 北米医薬品の凍結乾燥の国別市場規模予測・予想
9.5 北米医薬品の凍結乾燥の薬剤タイプ別市場規模予測・予測
9.6 北米医薬品の凍結乾燥の市場規模予測・送達タイプ別予測
9.7 北米医薬品の凍結乾燥の適応症別市場規模予測・予想
9.8 北米の医薬品の凍結乾燥の市場規模予測・予測:パッケージ別
9.9 医薬品用医薬品の凍結乾燥の米国市場分析
9.10 医薬品の凍結乾燥のカナダ市場分析
10 欧州の医薬品の凍結乾燥市場分析
10.1 主な調査結果
10.2 欧州の医薬品の凍結乾燥市場の魅力度指数
10.3 欧州の医薬品の凍結乾燥の国別市場、2023年、2028年、2033年 (10億米ドル)
10.4 欧州の医薬品の凍結乾燥の国別市場規模の推定と予測
10.5 欧州の医薬品の凍結乾燥の薬剤タイプ別市場規模の推定と予測
10.6 欧州の医薬品の凍結乾燥の市場規模予測・デリバリータイプ別予測
10.7 欧州の医薬品の凍結乾燥の適応症別市場規模予測・予測
10.8 欧州の医薬品の凍結乾燥の市場規模予測・予測:パッケージ別
10.9 ドイツ医薬品の凍結乾燥の市場分析
10.10 フランス医薬品の凍結乾燥の市場分析
10.11 イギリス医薬品の凍結乾燥市場の分析
10.12 イタリア医薬品の凍結乾燥の市場分析
10.13 スペイン医薬品の凍結乾燥の市場分析
10.14 ロシア医薬品の凍結乾燥の市場分析
10.15 医薬品の凍結乾燥のその他の欧州市場の分析
11 アジア太平洋地域の医薬品の凍結乾燥市場分析
11.1 主な調査結果
11.2 アジア太平洋地域の医薬品の凍結乾燥市場の魅力度指数
11.3 アジア太平洋地域の医薬品の凍結乾燥の国別市場規模予測・予想
11.4 アジア太平洋地域の医薬品の凍結乾燥の薬剤タイプ別市場規模の推定と予測
11.5 アジア太平洋地域の医薬品の凍結乾燥の投与タイプ別市場分析
11.6 アジア太平洋地域の医薬品の凍結乾燥の適応症別市場分析
11.7 アジア太平洋地域の医薬品の凍結乾燥の市場分析:パッケージ別
11.8 日本医薬品の凍結乾燥の市場分析
11.9 中国医薬品の凍結乾燥の市場分析
11.10 インド医薬品の凍結乾燥の市場分析
11.11 オーストラリア医薬品の凍結乾燥の市場分析
11.12 韓国医薬品の凍結乾燥市場分析
11.13 その他のアジア太平洋地域の医薬品の凍結乾燥の市場分析
12 ラテンアメリカの医薬品の凍結乾燥市場分析
12.1 主な調査結果
12.2 ラテンアメリカの医薬品の凍結乾燥市場の魅力度指数
12.3 ラテンアメリカの医薬品の凍結乾燥の国別市場:2023年、2028年、2033年(10億米ドル)
12.4 ラテンアメリカの医薬品の凍結乾燥の国別市場規模予測・予想
12.5 ラテンアメリカの医薬品の凍結乾燥の薬剤タイプ別市場規模予測・予測
12.6 ラテンアメリカの医薬品の凍結乾燥の市場規模予測・配送タイプ別予測
12.7 ラテンアメリカの医薬品の凍結乾燥の適応症別市場規模予測・予想
12.8 ラテンアメリカの医薬品の凍結乾燥のパッケージ別市場規模予測・予測
12.9 ブラジル医薬品の凍結乾燥の市場分析
12.10 メキシコ医薬品の凍結乾燥の市場分析
12.11 その他のラテンアメリカの医薬品の凍結乾燥の市場分析
13 MEAの医薬品における凍結乾燥の市場分析
13.1 主な調査結果
13.2 MEA医薬品の凍結乾燥市場の魅力度指数
13.3 MEA医薬品の凍結乾燥の国別市場:2023年、2028年、2033年 (10億米ドル)
13.4 MEA医薬品の凍結乾燥の国別市場規模予測・予想
13.5 MEA医薬品の凍結乾燥の薬剤タイプ別市場規模の推定と予測
13.6 MEA医薬品の凍結乾燥の市場規模予測・デリバリータイプ別予測
13.7 MEA医薬品の凍結乾燥の適応症別市場規模予測・予想
13.8 MEA医薬品の凍結乾燥のパッケージ別市場分析
13.9 GCC医薬品の凍結乾燥の市場分析
13.10 南アフリカ医薬品の凍結乾燥の市場分析
13.11 MEAのその他の地域 医薬品の凍結乾燥の市場分析
14 主要企業のプロフィール
14.1 競合他社の状況、2021年
14.2 ブリストル・マイヤーズ スクイブ社
14.2.1 会社概要
14.2.2 会社概要
14.2.3 財務分析
14.2.3.1 純収益、2017-2021年
14.2.3.2 R&D、2017-2021年
14.2.3.3 地域別市場シェア、2021年
14.2.4 製品ベンチマーク
14.2.5 戦略的な展望
14.3 ギリアド・サイエンシズ社
14.3.1 企業スナップショット
14.3.2 会社概要
14.3.3 財務分析
14.3.3.1 純収益、2017-2021年
14.3.3.2 R&D、2017年~2021年
14.3.3.3 地域別市場シェア、2021年
14.3.4 製品ベンチマーク
14.3.5 戦略的な展望
14.4 ノボノルディスクA/S
14.4.1 企業スナップショット
14.4.2 会社概要
14.4.3 財務分析
14.4.3.1 純収益、2017-2021年
14.4.3.2 R&D、2017年-2021年
14.4.3.3 地域別市場シェア、2021年
14.4.4 製品ベンチマーク
14.4.5 戦略的な展望
14.5 サノフィ
14.5.1 企業スナップショット
14.5.2 会社概要
14.5.3 財務分析
14.5.3.1 純収益、2017-2021年
14.5.3.2 R&D、2017年-2021年
14.5.3.3 地域別市場シェア、2021年
14.5.4 製品ベンチマーク
14.5.5 戦略的な展望
14.6 オーロビンド・ファーマ
14.6.1 企業スナップショット
14.6.2 会社概要
14.6.3 財務分析
14.6.3.1 純収益、2017-2021年
14.6.3.2 R&D、2017年-2021年
14.6.3.3 地域別市場シェア、2021年
14.6.4 製品ベンチマーク
14.6.5 戦略的な展望
14.7 フレゼニウス SE & Co.KGaA (フレゼニウス・カビ)
14.7.1 企業スナップショット
14.7.2 会社概要
14.7.3 財務分析
14.7.3.1 純収益、2017-2021年
14.7.3.2 R&D、2017年-2021年
14.7.3.3 地域別市場シェア、2021年
14.7.4 製品ベンチマーク
14.7.5 戦略的な展望
14.8 メルク・アンド・カンパニー
14.8.1 企業スナップショット
14.8.2 会社概要
14.8.3 財務分析
14.8.3.1 純収益、2017-2021年
14.8.3.2 R&D、2017年-2021年
14.8.3.3 地域別市場シェア、2021年
14.8.4 製品ベンチマーク
14.8.5 戦略的展望
14.9 ザイダスグループ
14.9.1 企業スナップショット
14.9.2 会社概要
14.9.3 財務分析
14.9.3.1 純収益、2017-2021年
14.9.3.2 R&D、2017年-2021年
14.9.3.3 地域別市場シェア、2021年
14.9.4 製品ベンチマーク
14.9.5 戦略的展望
14.10 ベッターファーマ
14.10.1 企業スナップショット
14.10.2 会社概要
14.10.3 財務分析
14.10.3.1 純収益、2017-2021年
14.10.4 製品ベンチマーク
14.10.5 戦略的な展望
14.11 F. ホフマン・ラ・ロシュ社
14.11.1 企業スナップショット
14.11.2 会社概要
14.11.3 財務分析
14.11.3.1 純収益、2017-2021年
14.11.3.2 R&D、2017年-2021年
14.11.3.3 地域別市場シェア、2021年
14.11.4 製品ベンチマーク
14.11.5 戦略的展望
14.12 武田薬品工業株式会社
14.12.1 企業スナップショット
14.12.2 会社概要
14.12.3 財務分析
14.12.3.1 純収益、2017-2021年
14.12.3.2 R&D、2017年-2021年
14.12.3.3 地域別市場シェア、2021年
14.12.4 製品ベンチマーク
14.12.5 戦略的な展望
14.13 ジョンソン・エンド・ジョンソンサービス
14.13.1 企業スナップショット
14.13.2 会社概要
14.13.3 財務分析
14.13.3.1 純収益、2017-2021年
14.13.3.2 R&D、2017年-2021年
14.13.3.3 地域別市場シェア、2021年
14.13.4 製品ベンチマーク
14.13.5 戦略的な展望
14.14 シプラ社
14.14.1 企業スナップショット
14.14.2 会社概要
14.14.3 財務分析
14.14.3.1 純収益、2017-2021年
14.14.3.2 R&D、2017年-2021年
14.14.3.3 地域別市場シェア、2021年
14.14.4 製品ベンチマーク
14.14.5 戦略的展望
15 結論と提言
15.1 ヴィジョンゲインからの結論
15.2 市場関係者への提言
表の一覧
Table 1 Lyophilization in Pharmaceuticals Market Snapshot, 2023 & 2033 (US$ billion, CAGR %)
Table 2 Lyophilization in Pharmaceuticals Market by Region, 2023-2033 (US$ bn, AGR (%), CAGR(%)): “V” Shaped Recovery Scenario
Table 3 Lyophilization in Pharmaceuticals Market by Region, 2023-2033 (US$ bn, AGR (%), CAGR(%)): “U” Shaped Recovery Scenario
Table 4 Lyophilization in Pharmaceuticals Market by Region, 2023-2033 (US$ bn, AGR (%), CAGR(%)): “W” Shaped Recovery Scenario
Table 5 Lyophilization in Pharmaceuticals Market by Region, 2023-2033 (US$ bn, AGR (%), CAGR(%)): “L” Shaped Recovery Scenario
Table 6 Lyophilization in Pharmaceuticals Market by Drug Type, 2023-2033 (US$ bn, AGR (%), CAGR(%))
Table 7 Anti-infective Market Forecast by Region, 2023-2033 (US$ Bn, AGR%, CAGR%)
Table 8 Anti-neoplastic Market Forecast by Region, 2023-2033 (US$ Bn, AGR%, CAGR%)
Table 9 Anticoagulant Market Forecast by Region, 2023-2033 (US$ Bn, AGR%, CAGR%)
Table 10 Hormones Market Forecast by Region, 2023-2033 (US$ Bn, AGR%, CAGR%)
Table 11 Antiarrhythmic Market Forecast by Region, 2023-2033 (US$ Bn, AGR%, CAGR%)
Table 12 Others Market Forecast by Region, 2023-2033 (US$ Bn, AGR%, CAGR%)
Table 13 Lyophilization in Pharmaceuticals Market by Type of Delivery, 2023-2033 (US$ bn, AGR (%), CAGR(%))
Table 14 Prefilled Diluent Syringes Market Forecast by Region, 2023-2033 (US$ Bn, AGR%, CAGR%)
Table 15 Multistep devices Market Forecast by Region, 2023-2033 (US$ Bn, AGR%, CAGR%)
Table 16 Lyophilization in Pharmaceuticals Market by Indication, 2023-2033 (US$ bn, AGR (%), CAGR(%)):
Table 17 Auto-Immune Diseases Market Forecast by Region, 2023-2033 (US$ Bn, AGR%, CAGR%)
Table 18 Respiratory Market Forecast by Region, 2023-2033 (US$ Bn, AGR%, CAGR%)
Table 19 Gastrointestinal Diseases Market Forecast by Region, 2023-2033 (US$ Bn, AGR%, CAGR%)
Table 20 Oncology Market Forecast by Region, 2023-2033 (US$ Bn, AGR%, CAGR%)
Table 21 Cardiovascular Market Forecast by Region, 2023-2033 (US$ Bn, AGR%, CAGR%)
Table 22 Infections Market Forecast by Region, 2023-2033 (US$ Bn, AGR%, CAGR%)
Table 23 Metabolic Disorders Market Forecast by Region, 2023-2033 (US$ Bn, AGR%, CAGR%)
Table 24 Others Market Forecast by Region, 2023-2033 (US$ Bn, AGR%, CAGR%)
Table 25 Lyophilization in Pharmaceuticals Market by Packaging, 2023-2033 (US$ bn, AGR (%), CAGR(%)):
Table 26 Vials Market Forecast by Region, 2023-2033 (US$ Bn, AGR%, CAGR%)
Table 27 Cartridges Market Forecast by Region, 2023-2033 (US$ Bn, AGR%, CAGR%)
Table 28 Prefilled Devices Market Forecast by Region, 2023-2033 (US$ Bn, AGR%, CAGR%)
Table 29 Lyophilization in Pharmaceuticals Market by Region, 2023-2033 (US$ bn, AGR (%), CAGR(%))
Table 30 North America Lyophilization in Pharmaceuticals Forecast by Country
Table 31 North America Lyophilization in Pharmaceuticals Market by Drug Type, 2023-2033 (US$ bn, AGR (%), CAGR(%)):
Table 32 Lyophilization in Pharmaceuticals Market by Type of Delivery, 2023-2033 (US$ bn, AGR (%), CAGR(%))
Table 33 Lyophilization in Pharmaceuticals Market by Indications, 2023-2033 (US$ bn, AGR (%), CAGR(%)):
Table 34 Lyophilization in Pharmaceuticals Market by Packaging, 2023-2033 (US$ bn, AGR (%), CAGR(%)):
Table 35 U.S. Lyophilization in Pharmaceuticals Market Forecast, 2023-2033 (US$ bn, AGR %, CAGR %)
Table 36 Canada Lyophilization in Pharmaceuticals Market Forecast, 2023-2033 (US$ bn, AGR %, CAGR %)
Table 37 Europe Lyophilization in Pharmaceuticals Market Forecast by Country, 2023-2033 (US$ bn, AGR%, CAGR%)
Table 38 Europe Lyophilization in Pharmaceuticals Market by Drug Type, 2023-2033 (US$ bn, AGR (%), CAGR(%)):
Table 39 Europe Lyophilization in Pharmaceuticals Market by Type of delivery, 2023-2033 (US$ bn, AGR (%), CAGR(%))
Table 40 Europe Lyophilization in Pharmaceuticals Market by Indications, 2023-2033 (US$ bn, AGR (%), CAGR(%)):
Table 41 Europe Lyophilization in Pharmaceuticals Market by Packaging, 2023-2033 (US$ bn, AGR (%), CAGR(%)):
Table 42 Germany Lyophilization in Pharmaceuticals Market Forecast, 2023-2033 (US$ bn, AGR (%), CAGR(%))
Table 43 France Lyophilization in Pharmaceuticals Market Forecast, 2023-2033 (US$ bn, AGR (%), CAGR(%)):
Table 44 UK Lyophilization in Pharmaceuticals Market Forecast, 2023-2033 (US$ bn, AGR (%), CAGR(%)):
Table 45 Italy Lyophilization in Pharmaceuticals Market Forecast, 2023-2033 (US$ bn, AGR (%), CAGR(%))
Table 46 Spain Lyophilization in Pharmaceuticals Market Forecast by Country: 2023-2033 (US$ bn, AGR (%), CAGR(%))
Table 47 Russia Lyophilization in Pharmaceuticals Market Forecast, 2023-2033 (US$ bn, AGR (%), CAGR(%))
Table 48 Rest of Europe Lyophilization in Pharmaceuticals Market Forecast, 2023-2033 (US$ bn, AGR (%), CAGR(%))
Table 49 Asia Pacific Lyophilization in Pharmaceuticals forecast by Country 2023-2033 (US$ Bn, AGR%, CAGR%)
Table 50 Asia Pacific Lyophilization in Pharmaceuticals Market by Drug Type, 2023-2033 (US$ bn, AGR (%), CAGR(%)):
Table 51 Asia Pacific in Pharmaceuticals Market by Type of Delivery, 2023-2033 (US$ bn, AGR (%), CAGR(%))
Table 52 Asia Pacific Lyophilization in Pharmaceuticals Market by Indication, 2023-2033 (US$ bn, AGR (%), CAGR(%))
Table 53 Asia Pacific Lyophilization in Pharmaceuticals Market by Packaging, 2023-2033 (US$ bn, AGR (%), CAGR(%))
Table 54 Japan Lyophilization in Pharmaceuticals Market Forecast, 2023-2033 (US$ bn, AGR (%), CAGR(%))
Table 55 China Lyophilization in Pharmaceuticals Market Forecast, 2023-2033 (US$ bn, AGR (%), CAGR(%))
Table 56 India Lyophilization in Pharmaceuticals Market Forecast, 2023-2033 (US$ bn, AGR (%), CAGR(%))
Table 57 Australia Lyophilization in Pharmaceuticals Market Forecast, 2023-2033 (US$ bn, AGR (%), CAGR(%))
Table 58 South Korea Lyophilization in Pharmaceuticals Market Forecast, 2023-2033 (US$ bn, AGR (%), CAGR(%))
Table 59 Rest of Asia Pacific Lyophilization in Pharmaceuticals Market Forecast, 2023-2033 (US$ bn, AGR (%), CAGR(%))
Table 60 Latin America Lyophilization in Pharmaceuticals forecast by Country 2023-2033 (US$ Bn, AGR%, CAGR%)
Table 61 Latin America Lyophilization in Pharmaceuticals Market by Drug Type, 2023-2033 (US$ bn, AGR (%), CAGR(%))
Table 62 Lyophilization in Pharmaceuticals Market by Type of Delivery, 2023-2033 (US$ bn, AGR (%), CAGR(%))
Table 63 Latin America Lyophilization in Pharmaceuticals Market by Indications, 2023-2033 (US$ bn, AGR (%), CAGR(%))
Table 64 Latin America Lyophilization in Pharmaceuticals Market by Packaging, 2023-2033 (US$ bn, AGR (%), CAGR(%))
Table 65 Brazil Lyophilization in Pharmaceuticals Market Forecast, 2023-2033 (US$ bn, AGR (%), CAGR(%))
Table 66 Mexico Lyophilization in Pharmaceuticals Market Forecast, 2023-2033 (US$ bn, AGR (%), CAGR(%))
Table 67 Rest of Latin America Lyophilization in Pharmaceuticals Market Forecast, 2023-2033 (US$ bn, AGR (%), CAGR(%))
Table 68 MEA Lyophilization in Pharmaceuticals forecast by Country 2023-2033 (US$ Bn, AGR%, CAGR%)
Table 69 Lyophilization in Pharmaceuticals Market by Drug Type, 2023-2033 (US$ bn, AGR (%), CAGR(%))
Table 70 MEA Lyophilization in Pharmaceuticals Market by Type of delivery, 2023-2033 (US$ bn, AGR (%), CAGR(%))
Table 71 MEA Lyophilization in Pharmaceuticals Market by Indications, 2023-2033 (US$ bn, AGR (%), CAGR(%)):
Table 72 MEA Lyophilization in Pharmaceuticals Market by Packaging, 2023-2033 (US$ bn, AGR (%), CAGR(%)):
Table 73 GCC Lyophilization in Pharmaceuticals Market Forecast, 2023-2033 (US$ bn, AGR (%), CAGR(%))
Table 74 South Africa Lyophilization in Pharmaceuticals Market Forecast, 2023-2033 (US$ bn, AGR (%), CAGR(%))
Table 75 Rest of MEA Lyophilization in Pharmaceuticals Market Forecast, 2023-2033 (US$ bn, AGR (%), CAGR(%))
Table 76 Bristol-Myers Squibb Company: Key Details, (CEO, HQ, Revenue, Founded, No. of Employees, Company Type, Website, Business Segment)
Table 77 Bristol-Myers Squibb Company: Product Benchmarking
Table 78 Bristol-Myers Squibb Company: Strategic Outlook
Table 79 Gilead Sciences, Inc.: Key Details, (CEO, HQ, Revenue, Founded, No. of Employees, Company Type, Website, Business Segment)
Table 80 Gilead Sciences, Inc.: Product Benchmarking
Table 81 Gilead Sciences, Inc.: Strategic Outlook
Table 82 Novo Nordisk: Key Details, (CEO, HQ, Revenue, Founded, No. of Employees, Company Type, Website, Business Segment)
Table 83 Novo Nordisk, Inc.: Product Benchmarking
Table 84 Novo Nordisk.: Strategic Outlook
Table 85 Sanofi: Key Details, (CEO, HQ, Revenue, Founded, No. of Employees, Company Type, Website, Business Segment)
Table 86 Sanofi.: Product Benchmarking
Table 87 Sanofi.: Strategic Outlook
Table 88 Aurobindo Pharma: Key Details, (CEO, HQ, Revenue, Founded, No. of Employees, Company Type, Website, Business Segment)
Table 89 Aurobindo Pharma: Product Benchmarking
Table 90 Aurobindo Pharma.: Strategic Outlook
Table 91 Fresenius Kabi: Key Details, (CEO, HQ, Revenue, Founded, No. of Employees, Company Type, Website, Business Segment)
Table 92 Fresenius Kabi: Product Benchmarking
Table 93 Fresenius Kabi: Strategic Outlook
Table 94 Merck & Co., Inc.: Key Details, (CEO, HQ, Revenue, Founded, No. of Employees, Company Type, Website, Business Segment)
Table 95 Merck & Co., Inc.: Product Benchmarking
Table 96 Merck & Co., Inc.: Strategic Outlook
Table 97 Zydus: Key Details, (CEO, HQ, Revenue, Founded, No. of Employees, Company Type, Website, Business Segment)
Table 98 Zydus.: Product Benchmarking
Table 99 Zydus.: Strategic Outlook
Table 100 Vetter Pharma: Key Details, (CEO, HQ, Revenue, Founded, No. of Employees, Company Type, Website, Business Segment)
Table 101 Vetter Pharma: Product Benchmarking
Table 102 Vetter Pharma: Strategic Outlook
Table 103 F. Hoffmann-La Roche Ltd: Key Details, (CEO, HQ, Revenue, Founded, No. of Employees, Company Type, Website, Business Segment)
Table 104 F. Hoffmann-La Roche Ltd.: Product Benchmarking
Table 105 F. Hoffmann-La Roche Ltd.: Strategic Outlook
Table 106 Takeda: Key Details, (CEO, HQ, Revenue, Founded, No. of Employees, Company Type, Website, Business Segment)
Table 107 Takeda: Product Benchmarking
Table 108 Takeda: Strategic Outlook
Table 109 Johnson & Johnson: Key Details, (CEO, HQ, Revenue, Founded, No. of Employees, Company Type, Website, Business Segment)
Table 110 Johnson & Johnson: Product Benchmarking
Table 111 Johnson & Johnson: Strategic Outlook
Table 112 Cipla Inc.: Key Details, (CEO, HQ, Revenue, Founded, No. of Employees, Company Type, Website, Business Segment)
Table 113 Cipla Inc.: Product Benchmarking
Table 114 Cipla Inc.: Strategic Outlook
図の一覧
Figure 1 Lyophilization in Pharmaceuticals Market Segmentation
Figure 2 Lyophilization in Pharmaceuticals Market by Drug type: Market Attractiveness Index
Figure 3 Lyophilization in Pharmaceuticals Market by Type of Delivery: Market Attractiveness Index
Figure 4 Lyophilization in Pharmaceuticals Market by Indication: Market Attractiveness Index
Figure 5 Lyophilization in Pharmaceuticals Market by Packaging: Market Attractiveness Index
Figure 6 Lyophilization in Pharmaceuticals Market Attractiveness Index by Region
Figure 7 Lyophilization in Pharmaceuticals Market: Market Dynamics
Figure 8 COVID Impact Analysis: Lyophilization in Pharmaceuticals Market Recovery Scenarios
Figure 9 Lyophilization in Pharmaceuticals Market by Region, 2023-2033 (US$ bn, AGR (%), CAGR (%)): “V” Shaped Recovery
Figure 10 Lyophilization in Pharmaceuticals Market by Region, 2023-2033 (US$ bn, AGR (%), CAGR (%)): “U” Shaped Recovery
Figure 11 Lyophilization in Pharmaceuticals Market by Region, 2023-2033 (US$ bn, AGR (%), CAGR (%)): “W” Shaped Recovery
Figure 12 Lyophilization in Pharmaceuticals Market by Region, 2023-2033 (US$ bn, AGR (%), CAGR (%)): “L” Shaped Recovery
Figure 13 Lyophilization in Pharmaceuticals Market: Porter’s Five Forces Analysis
Figure 14 Lyophilization in Pharmaceuticals Market: PEST Analysis
Figure 15 Lyophilization in Pharmaceuticals Market by Drug type: Market Attractiveness Index
Figure 16 Lyophilization in Pharmaceuticals Market Forecast by Drug Type, 2023-2033 (US$ billion)
Figure 17 Lyophilization in Pharmaceuticals Market Share Forecast by Drug Type, 2023, 2033 (%)
Figure 18 Anti-infective Market Forecast by Region, 2023-2033 (US$ billion)
Figure 19 Anti-infective Market Share Forecast by Region, 2023 & 2033 (%)
Figure 20 Antineoplastic Market Forecast by Region, 2023-2033 (US$ billion)
Figure 21 Antineoplastic Market Share Forecast by Region, 2023 & 2033 (%)
Figure 22 Anticoagulant Market Forecast by Region, 2023-2033 (US$ billion)
Figure 23 Anticoagulant Market Share Forecast by Region, 2023 & 2033 (%)
Figure 24 Hormones Market Forecast by Region, 2023-2033 (US$ billion)
Figure 25 Hormones Market Share Forecast by Region, 2023 & 2033 (%)
Figure 26 Antiarrhythmic Market Forecast by Region, 2023-2033 (US$ billion)
Figure 27 Antiarrhythmic Market Share Forecast by Region, 2023 & 2033 (%)
Figure 28 Others Market Forecast by Region, 2023-2033 (US$ billion)
Figure 29 Others Market Share Forecast by Region, 2023 & 2033 (%)
Figure 30 Lyophilization in Pharmaceuticals Market by Type of Delivery: Market Attractiveness Index
Figure 31 Lyophilization in Pharmaceuticals Market Forecast by Type of Delivery, 2023-2033 (US$ billion)
Figure 32 Lyophilization in Pharmaceuticals Market Share Forecast by Type of Delivery, 2023 & 2033 (%)
Figure 33 Prefilled Diluent Syringes Market Forecast by Region, 2023-2033 (US$ billion)
Figure 34 Prefilled Diluent Syringes Market Share Forecast by Region, 2023 & 2033 (%)
Figure 35 Multi-step Devices Market Forecast by Region, 2023-2033 (US$ billion)
Figure 36 Multi-step Devices Market Share Forecast by Region, 2023 & 2033 (%)
Figure 37 Lyophilization in Pharmaceuticals Market by Type of Delivery: Market Attractiveness Index
Figure 38 Lyophilization in Pharmaceuticals Market by Indication, 2023-2033 (US$ bn, AGR (%), CAGR(%))
Figure 39 Lyophilization in Pharmaceuticals Market Share Forecast by Indication, 2023 & 2033 (%)
Figure 40 Autoimmune Diseases Market Forecast by Region, 2023-2033 (US$ billion)
Figure 41 Autoimmune Diseases Market Share Forecast by Region, 2023 & 2033 (%)
Figure 42 Respiratory Diseases Market Forecast by Region, 2023-2033 (US$ billion)
Figure 43 Respiratory Diseases Market Share Forecast by Region, 2023 & 2033 (%)
Figure 44 Gastrointestinal Diseases Market Forecast by Region, 2023-2033 (US$ billion)
Figure 45 Gastrointestinal Diseases Market Share Forecast by Region, 2023 & 2033 (%)
Figure 46 Oncology Diseases Market Forecast by Region, 2023-2033 (US$ billion)
Figure 47 Oncology Diseases Market Share Forecast by Region, 2023 & 2033 (%)
Figure 48 Cardiovascular Diseases Market Forecast by Region, 2023-2033 (US$ billion)
Figure 49 Cardiovascular Diseases Market Share Forecast by Region, 2023 & 2033 (%)
Figure 50 Infectious Diseases Market Forecast by Region, 2023-2033 (US$ billion)
Figure 51 Infectious Diseases Market Share Forecast by Region, 2023 & 2033 (%)
Figure 52 Metabolic Diseases Market Forecast by Region, 2023-2033 (US$ billion)
Figure 53 Metabolic Diseases Market Share Forecast by Region, 2023 & 2033 (%)
Figure 54 Others Market Forecast by Region, 2023-2033 (US$ billion)
Figure 55 Others Market Share Forecast by Region, 2023 & 2033 (%)
Figure 56 Lyophilization in Pharmaceuticals Market by Packaging: Market Attractiveness Index
Figure 57 Lyophilization in Pharmaceuticals Market by Packaging, 2023-2033 (US$ bn, AGR (%), CAGR(%))
Figure 58 Lyophilization in Pharmaceuticals Market Share Forecast by Packaging, 2023 & 2033 (%)
Figure 59 Vials Market Forecast by Region, 2023-2033 (US$ billion)
Figure 60 Vials Market Share Forecast by Region, 2023 & 2033 (%)
Figure 61 Cartridges Market Forecast by Region, 2023-2033 (US$ billion)
Figure 62 Cartridges Market Share Forecast by Region, 2023 & 2033 (%)
Figure 63 Prefilled devices Market Forecast by Region, 2023-2033 (US$ billion)
Figure 64 Prefilled devices Market Share Forecast by Region, 2023 & 2033 (%)
Figure 65 Lyophilization in Pharmaceuticals Market by Region: Market Attractiveness Index
Figure 66 Lyophilization in Pharmaceuticals Market by Region, 2023-2033 (US$ bn)
Figure 67 Lyophilization in Pharmaceuticals Market Share Forecast by Region 2023, 2033(%)
Figure 68 North America Lyophilization in Pharmaceuticals Market Attractiveness Index
Figure 69 North America Lyophilization in Pharmaceuticals Market by Region, 2023, 2028 & 2033 (US$ billion)
Figure 70 North America Lyophilization in Pharmaceuticals Market Forecast by Country, 2023-2033 (US$ billion)
Figure 71 North America Lyophilization in Pharmaceuticals Market Share Forecast by Country, 2023 & 2033 (%)
Figure 72 North America Lyophilization in Pharmaceuticals Market Forecast by Drug Type, 2023-2033 (US$ billion)
Figure 73 North America Lyophilization in Pharmaceuticals Market Share Forecast by Drug Type, 2023 & 2033 (%)
Figure 74 North America Lyophilization in Pharmaceuticals Market Forecast by Type of Delivery, 2023-2033 (US$ billion)
Figure 75 North America Lyophilization in Pharmaceuticals Market Share Forecast by Type of Delivery, 2023 & 2033 (%)
Figure 76 U.S. Lyophilization in Pharmaceuticals Market Forecast, 2023-2033 (US$ billion, AGR %)
Figure 77 North America Lyophilization in Pharmaceuticals Market Share Forecast by Indication, 2023 & 2033 (%)
Figure 78 North America Lyophilization in Pharmaceuticals Market Share Forecast by Packaging, 2023 & 2033 (%)
Figure 79 North America Lyophilization in Pharmaceuticals Market Share Forecast by Packaging, 2023 & 2033 (%)
Figure 80 U.S. Lyophilization in Pharmaceuticals Market Forecast, 2023-2033 (US$ billion, AGR %)
Figure 81 Canada Lyophilization in Pharmaceuticals Market Forecast, 2023-2033 (US$ billion, AGR %)
Figure 82 Europe Lyophilization in Pharmaceuticals Market Attractiveness Index
Figure 83 Europe Lyophilization in Pharmaceuticals Market by Region, 2023, 2028 & 2033 (US$ billion)
Figure 84 Europe Lyophilization in Pharmaceuticals Market Forecast by Country, 2023-2033 (US$ billion)
Figure 85 Europe Lyophilization in Pharmaceuticals Market Share Forecast by Country, 2023 & 2033 (%)
Figure 86 Europe Lyophilization in Pharmaceuticals Market Forecast by Drug Type, 2023-2033 (US$ billion)
Figure 87 Europe Lyophilization in Pharmaceuticals Market Share Forecast by Drug Type, 2023 & 2033 (%)
Figure 88 Europe Lyophilization in Pharmaceuticals Market Forecast by Type of Delivery, 2023-2033 (US$ billion)
Figure 89 Europe Lyophilization in Pharmaceuticals Market Share Forecast by Type of Delivery, 2023 & 2033 (%)
Figure 90 Europe Lyophilization in Pharmaceuticals Market Forecast by Indications, 2023-2033 (US$ billion, AGR %)
Figure 91 Europe Lyophilization in Pharmaceuticals Market Share Forecast by Indications, 2023 & 2033 (%)
Figure 92 Europe Lyophilization in Pharmaceuticals Market Forecast by Packaging, 2023-2033 (US$ billion, AGR %)
Figure 93 Europe Lyophilization in Pharmaceuticals Market Share Forecast by Packaging, 2023 & 2033 (%)
Figure 94 Germany Lyophilization in Pharmaceuticals Market Forecast, 2023-2033 (US$ billion, AGR %)
Figure 95 France Lyophilization in Pharmaceuticals Market Forecast, 2023-2033 (US$ billion, AGR %)
Figure 96 UK Lyophilization in Pharmaceuticals Market Forecast, 2023-2033 (US$ billion, AGR %)
Figure 97 Italy Lyophilization in Pharmaceuticals Market Forecast, 2023-2033 (US$ billion, AGR %)
Figure 98 Spain Lyophilization in Pharmaceuticals Market Forecast, 2023-2033 (US$ billion, AGR %)
Figure 99 Russia Lyophilization in Pharmaceuticals Market Forecast, 2023-2033 (US$ billion, AGR %)
Figure 100 Rest of Europe Lyophilization in Pharmaceuticals Market Forecast, 2023-2033 (US$ billion, AGR %)
Figure 101 Asia Pacific Lyophilization in Pharmaceuticals Market Attractiveness Index
Figure 102 Asia Pacific Lyophilization in Pharmaceuticals Market Forecast, 2023-2033 (US$ billion, AGR %)
Figure 103 Asia Pacific Lyophilization in Pharmaceuticals Market Share Forecast by Country, 2023 & 2033 (%)
Figure 104 Asia Pacific Lyophilization in Pharmaceuticals Market Forecast by Drug Type, 2023-2033 (US$ billion, AGR %)
Figure 105 Asia Pacific Lyophilization in Pharmaceuticals Market Share Forecast by Drug Type, 2023 & 2033 (%)
Figure 106 Asia Pacific Lyophilization in Pharmaceuticals Market Forecast by Type of Delivery, 2023-2033 (US$ billion, AGR %)
Figure 107 Asia Pacific Lyophilization in Pharmaceuticals Market Share Forecast by Type of Delivery, 2023 & 2033 (%)
Figure 108 Asia Pacific Lyophilization in Pharmaceuticals Market Forecast by Indication, 2023-2033 (US$ billion, AGR %)
Figure 109 Asia Pacific Lyophilization in Pharmaceuticals Market Share Forecast by Indication, 2023 & 2033 (%)
Figure 110 Asia Pacific Lyophilization in Pharmaceuticals Market Forecast by Packaging, 2023-2033 (US$ billion, AGR %)
Figure 111 Asia Pacific Lyophilization in Pharmaceuticals Market Share Forecast by Packaging, 2023 & 2033 (%)
Figure 112 Japan Lyophilization in Pharmaceuticals Market Forecast, 2023-2033 (US$ billion, AGR %)
Figure 113 China Lyophilization in Pharmaceuticals Market Forecast, 2023-2033 (US$ billion, AGR %)
Figure 114 India Lyophilization in Pharmaceuticals Market Forecast, 2023-2033 (US$ billion, AGR %)
Figure 115 Australia Lyophilization in Pharmaceuticals Market Forecast, 2023-2033 (US$ billion, AGR %)
Figure 116 South Korea Lyophilization in Pharmaceuticals Market Forecast, 2023-2033 (US$ billion, AGR %)
Figure 117 Rest of Asia Pacific Lyophilization in Pharmaceuticals Market Forecast, 2023-2033 (US$ billion, AGR %)
Figure 118 Latin America Lyophilization in Pharmaceuticals Market Attractiveness Index
Figure 119 Latin America Lyophilization in Pharmaceuticals Market by Country, 2023, 2028 & 2033 (US$ billion)
Figure 120 Latin America Lyophilization in Pharmaceuticals Market Forecast by Country, 2023-2033 (US$ billion)
Figure 121 Latin America Lyophilization in Pharmaceuticals Market Share Forecast by Country, 2023 & 2033 (%)
Figure 122 Latin America Lyophilization in Pharmaceuticals Market Forecast by Drug Type, 2023-2033 (US$ billion)
Figure 123 Latin America Lyophilization in Pharmaceuticals Market Share Forecast by Drug Type, 2023 & 2033 (%)
Figure 124 Latin America Lyophilization in Pharmaceuticals Market Forecast by Type of Delivery, 2023-2033 (US$ billion)
Figure 125 Latin America Lyophilization in Pharmaceuticals Market Share Forecast by Type of Delivery, 2023 & 2033 (%)
Figure 126 Latin America Lyophilization in Pharmaceuticals Market Forecast by Indications, 2023-2033 (US$ billion, AGR %)
Figure 127 Latin America Lyophilization in Pharmaceuticals Market Share Forecast by Indications, 2023 & 2033 (%)
Figure 128 Latin America Lyophilization in Pharmaceuticals Market Forecast by Packaging, 2023-2033 (US$ billion, AGR %)
Figure 129 Latin America Lyophilization in Pharmaceuticals Market Share Forecast by Packaging, 2023 & 2033 (%)
Figure 130 Brazil Lyophilization in Pharmaceuticals Market Forecast, 2023-2033 (US$ billion, AGR %)
Figure 131 Mexico Lyophilization in Pharmaceuticals Market Forecast, 2023-2033 (US$ billion, AGR %)
Figure 132 Rest of Latin America Lyophilization in Pharmaceuticals Market Forecast, 2023-2033 (US$ billion, AGR %)
Figure 133 MEA Lyophilization in Pharmaceuticals Market Attractiveness Index
Figure 134 MEA Lyophilization in Pharmaceuticals Market by Country, 2023, 2028 & 2033 (US$ billion)
Figure 135 MEA Lyophilization in Pharmaceuticals Market Forecast by Country, 2023-2033 (US$ billion)
Figure 136 MEA Lyophilization in Pharmaceuticals Market Share Forecast by Country, 2023 & 2033 (%)
Figure 137 MEA Lyophilization in Pharmaceuticals Market Forecast by Drug Type, 2023-2033 (US$ billion)
Figure 138 MEA Lyophilization in Pharmaceuticals Market Share Forecast by Drug Type, 2023 & 2033 (%)
Figure 139 MEA Lyophilization in Pharmaceuticals Market Forecast by Type of Delivery, 2023-2033 (US$ billion)
Figure 140 MEA Lyophilization in Pharmaceuticals Market Share Forecast by Type of Delivery, 2023 & 2033 (%)
Figure 141 MEA Lyophilization in Pharmaceuticals Market Indications, 2023-2033 (US$ billion, AGR %)
Figure 142 MEA Lyophilization in Pharmaceuticals Market Share Forecast by Indications, 2023 & 2033 (%)
Figure 143 MEA Lyophilization in Pharmaceuticals Market Forecast by Packaging, 2023-2033 (US$ billion, AGR %)
Figure 144 MEA Lyophilization in Pharmaceuticals Market Share Forecast by Packaging, 2023 & 2033 (%)
Figure 145 GCC Lyophilization in Pharmaceuticals Market Forecast, 2023-2033 (US$ billion, AGR %)
Figure 146 South Africa Lyophilization in Pharmaceuticals Market Forecast, 2023-2033 (US$ billion, AGR %)
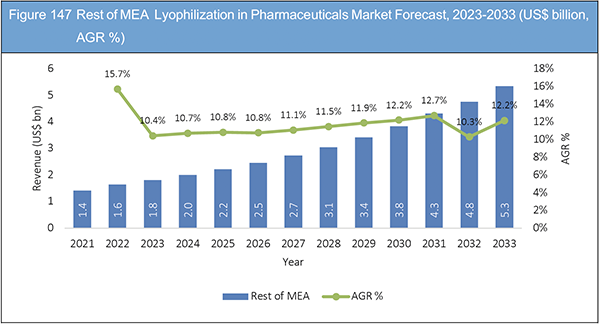
Figure 147 Rest of MEA Lyophilization in Pharmaceuticals Market Forecast, 2023-2033 (US$ billion, AGR %)
Figure 148 Bristol-Myers Squibb Company: Net Revenue, 2017-2021 (US$ million, AGR%)
Figure 149 Bristol-Myers Squibb Company: R&D, 2017-2021 (US$ million, AGR%)
Figure 150 Bristol-Myers Squibb Company: Regional Market Shares, 2021
Figure 151 Gilead Sciences, Inc.: Net Revenue, 2017-2021 (US$ million, AGR%)
Figure 152 Gilead Sciences, Inc.: R&D, 2017-2021 (US$ million, AGR%)
Figure 153 Gilead Sciences, Inc.: Regional Market Shares, 2021
Figure 154 Novo Nordisk: Net Revenue, 2017-2021 (US$ million, AGR%)
Figure 155 Novo Nordisk: R&D, 2017-2021 (US$ million, AGR%)
Figure 156 Novo Nordisk: Regional Market Shares, 2021
Figure 157 Sanofi: Net Revenue, 2017-2021 (US$ million, AGR%)
Figure 158 Sanofi: R&D, 2017-2021 (US$ million, AGR%)
Figure 159 Sanofi: Regional Market Shares, 2021
Figure 160 Aurobindo Pharma: Net Revenue, 2017-2021 (US$ million, AGR%)
Figure 161 Aurobindo Pharma: R&D, 2017-2021 (US$ million, AGR%)
Figure 162 Aurobindo Pharma: Regional Market Shares, 2021
Figure 163 Fresenius Kabi: Net Revenue, 2017-2021 (US$ million, AGR%)
Figure 164 Fresenius Kabi AG: R&D, 2017-2021 (US$ million, AGR%)
Figure 165 Fresenius Kabi AG: Regional Market Shares, 2021
Figure 166 Merck & Co., Inc.: Net Revenue, 2017-2021 (US$ million, AGR%)
Figure 167 Merck & Co., Inc.: R&D, 2017-2021 (US$ million, AGR%)
Figure 168 Merck & Co., Inc.: Regional Market Shares, 2021
Figure 169 Zydus: Net Revenue, 2017-2021 (US$ million, AGR%)
Figure 170 Zydus: R&D, 2017-2021 (US$ million, AGR%)
Figure 171 Zydus: Regional Market Shares, 2021
Figure 172 F. Hoffmann-La Roche Ltd: Net Revenue, 2017-2021 (US$ million, AGR%)
Figure 173 F. Hoffmann-La Roche Ltd.: R&D, 2017-2021 (US$ million, AGR%)
Figure 174 F. Hoffmann-La Roche Ltd.: Regional Market Shares, 2021
Figure 175 Takeda: Net Revenue, 2017-2021 (US$ million, AGR%)
Figure 176 Takeda: R&D, 2017-2021 (US$ million, AGR%)
Figure 177 Takeda: Regional Market Shares, 2021
Figure 178 Johnson & Johnson: Net Revenue, 2017-2021 (US$ million, AGR%)
Figure 179 Johnson & Johnson: R&D, 2017-2021 (US$ million, AGR%)
Figure 180 Johnson & Johnson: Regional Market Shares, 2021
Figure 181 Cipla Inc.: Net Revenue, 2017-2021 (US$ million, AGR%)
Figure 182 Cipla Inc.: R&D, 2017-2021 (US$ million, AGR%)
Figure 183 Cipla Inc.: Regional Market Shares, 2021
ページTOPに戻る
Summary
Report Details
The Lyophilisation in Pharmaceutical Market Report 2023-2033: This report will prove invaluable to leading firms striving for new revenue pockets if they wish to better understand the industry and its underlying dynamics. It will be useful for companies that would like to expand into different industries or to expand their existing operations in a new region.
Increasing Prevalence of Chronic Diseases and Growing Number of Product Approvals Driving Market Growth
Lifestyle changes such as consumption of fast food, alcohol and tobacco smoking will increase the prevalence of chronic diseases. With the increasing number of people suffering from chronic conditions, there will be more demand for advanced drugs and treatment options, hence driving lyophilization in pharmaceuticals market growth in the future.
A majority of market players in the industry has a strong pipeline of drugs ready to hit the market. This resulted in increased number of product approvals over recent years. Several clinical studies are being undertaken by various organizations to secure product approval for extended application of lyophilization in pharmaceuticals to treat cancer and other diseases. With such continuous product approvals and increasing healthcare expenditure, the industry will experience robust growth in the future.
Increasing Demand for Stable Drug Formulations with Longer Shelf Life to Boost Industry Growth
Growing focus on development of freeze dried formulations is encouraging pharmaceutical companies to produce more stable products through lyophilization. Longer shelf-life and stability are of critical importance in the area of pharmaceuticals, biotechnology, bio-medical and bio-processing. Drug products are more stable in a dry state and enhances longer shelf-life, often as long as two to five years, making much easier to transport the product. The demand for lyophilization in pharmaceuticals is expected to grow significantly and will provide lucrative growth opportunity for the companies operating in this sector.
Substantial Number of Product Recalls Likely to Hamper Market Growth
Rising number of product recalls in the recent times may impede the growth in lyophilization in pharmaceuticals market. The U.S.FDA recently issued product recall notice to three lots of drugs from Sun Pharmaceutical Industries due to presence of glass particles in these drug lots. Furthermore, a significant increase in the number of recalls by market players due to adverse effects, the presence of foreign substances, among others may hamper the market growth.
What Questions Should You Ask before Buying a Market Research Report?
• How is the lyophilization in pharmaceuticals market evolving?
• What is driving and restraining the lyophilization in pharmaceuticals market?
• How will each lyophilization in pharmaceuticals submarket grow over the forecast period and how much revenue will these submarkets account for in 2033?
• How will the market shares for each lyophilization in pharmaceuticals submarket develop from 2023 to 2033?
• What will be the main driver for the overall market from 2023 to 2033?
• Will leading lyophilization in pharmaceuticals markets broadly follow the macroeconomic dynamics, or will individual national markets outperform others?
• How will the market shares of the national markets change by 2033 and which geographical region will lead the market in 2033?
• Who are the leading players and what are their prospects over the forecast period?
• What are the lyophilization in pharmaceuticals projects for these leading companies?
• How will the industry evolve during the period between 2023 and 2033? What are the implications of lyophilization in pharmaceuticals projects taking place now and over the next 10 years?
• Is there a greater need for product commercialisation to further scale the lyophilization in pharmaceuticals market?
• Where is the lyophilization in pharmaceuticals market heading and how can you ensure you are at the forefront of the market?
• What are the best investment options for new product and service lines?
• What are the key prospects for moving companies into a new growth path and C-suite?
You need to discover how this will impact the Lyophilization in Pharmaceuticals Market today, and over the next 10 years:
• Our 260-page report provides 114 tables and 183 charts/graphs exclusively to you.
• The report highlights key lucrative areas in the industry so you can target them – NOW.
• It contains in-depth analysis of global, regional and national sales and growth.
• It highlights for you the key successful trends, changes and revenue projections made by your competitors.
This report tells you TODAY how the Lyophilization in Pharmaceuticals Market will develop in the next 10 years, and in line with the variations in COVID-19 economic recession and bounce. This market is more critical now than at any point over the last 10 years.
Forecasts to 2033 and other analyses reveal commercial prospects
• In addition to revenue forecasting to 2033, our new study provides you with recent results, growth rates, and market shares.
• You will find original analyses, with business outlooks and developments.
• Discover qualitative analyses (including market dynamics, drivers, opportunities, restraints and challenges), Porter’s Five Forces Analysis, PEST Analysis and recent developments.
This report includes data analysis and invaluable insight into how COVID-19 will affect the industry and your company. Four COVID-19 recovery patterns and their impact, namely, “V”, “L”, “W” and “U” are discussed in this report.
Segments Covered in the Report
Drug Type
• Anti-infective
• Anti-neoplastic
• Anticoagulant
• Hormones
• Antiarrhythmic
• Others
Type of Delivery
• Prefilled Diluent Syringes
• Multi-step Devices
Indication
• Autoimmune Diseases
• Respiratory Diseases
• Gastrointestinal Disorders
• Oncology
• Cardiovascular Diseases
• Infectious Diseases
• Metabolic Disorders
• Others
Packaging
• Vials
• Cartridges
• Prefilled Devices
In addition to the revenue predictions for the overall world market and segments, you will also find revenue forecasts for five regional and 16 leading national markets:
North America
• U.S.
• Canada
Europe
• Germany
• UK
• France
• Italy
• Spain
• Russia
• Rest of Europe
Asia Pacific
• China
• Japan
• India
• Australia
• South Korea
• Rest of Asia Pacific
Latin America
• Brazil
• Mexico
• Rest of Latin America
MEA
• GCC
• South Africa
• Rest of MEA
The report also includes profiles and for some of the leading companies in the Lyophilization in Pharmaceuticals Market, 2023 to 2033, with a focus on this segment of these companies’ operations.
Leading companies and the potential for market growth
• Aurobindo Pharma
• Bristol-Myers Squibb Company
• Cipla Inc.
• Fresenius Kabi AG
• Gilead Sciences, Inc.
• Johnson & Johnson Services, Inc.
• Merck & Co., Inc.
• Novo Nordisk A/S
• F. Hoffmann-La Roche Ltd
• Sanofi
• Takeda Pharmaceutical Company Limited
• Vetter Pharma
• Zydus Group
Overall world revenue for Lyophilization in Pharmaceuticals Market, 2023 to 2033 in terms of value the market will surpass US$282 billion in 2023, our work calculates. We predict strong revenue growth through to 2033. Our work identifies which organizations hold the greatest potential. Discover their capabilities, progress, and commercial prospects, helping you stay ahead.
How will the Lyophilization in Pharmaceuticals Market, 2023 to 2033 report help you?
In summary, our 260-page report provides you with the following knowledge:
• Revenue forecasts to 2033 for Lyophilization in Pharmaceuticals Market, 2023 to 2033 Market, with forecasts for drug type, type of delivery, indication and packaging, each forecast at a global and regional level – discover the industry’s prospects, finding the most lucrative places for investments and revenues.
• Revenue forecasts to 2033 for five regional and 16 key national markets – See forecasts for the Lyophilization in Pharmaceuticals Market, 2023 to 2033 market in North America, Europe, Asia-Pacific and Latin America and Middle East and Africa. Also forecasted is the market in the US, Canada, Mexico, Brazil, Germany, France, UK, Italy, China, India, Japan, and Australia among other prominent economies.
• Prospects for established firms and those seeking to enter the market – including company profiles of the major companies involved in the Lyophilization in Pharmaceuticals Market, 2023 to 2033.
Find quantitative and qualitative analyses with independent predictions. Receive information that only our report contains, staying informed with invaluable business intelligence.
Information found nowhere else
With our new report, you are less likely to fall behind in knowledge or miss out on opportunities. See how our work could benefit your research, analyses, and decisions. Visiongain’s study is for everybody needing commercial analyses for the Lyophilization in Pharmaceuticals Market, 2023 to 2033, market-leading companies. You will find data, trends and predictions.
ページTOPに戻る
Table of Contents
Table of Contents
1. Report Overview
1.1 Objectives of the Study
1.2 Introduction to Lyophilization in Pharmaceuticals Market
1.3 What This Report Delivers
1.4 Why You Should Read This Report
1.5 Key Questions Answered by This Analytical Report
1.6 Who is This Report for?
1.7 Methodology
1.7.1 Market Definitions
1.7.2 Market Evaluation & Forecasting Methodology
1.7.3 Data Validation
1.7.3.1 Primary Research
1.7.3.2 Secondary Research
1.8 Frequently Asked Questions (FAQs)
1.9 Associated Visiongain Reports
1.10 About Visiongain
2 Executive Summary
3 Market Overview
3.1 Key Findings
3.2 Market Dynamics
3.2.1 Market Driving Factors
3.2.1.1 Increasing Prevalence of Chronic Diseases
3.2.1.2 Growing Number of Product Approvals for Lyophilized Pharmaceuticals
3.2.1.3 Technological Advancements in Lyophilized Drug Development
3.2.2 Market Restraining Factors
3.2.2.1 Substantial Number of Product Recalls
3.2.2.2 High Cost of Manufacturing Lyophilized Pharmaceuticals
3.2.3 Market Opportunities
3.2.3.1 Growing Research and Development Activities in the Industry
3.2.3.2 Increased Demand for Lyophilization of Products in Pharmaceutical and Biotech Industry
3.2.3.3 Growing Demand for Superior Products with Longer Shelf Life and Stability
3.3 COVID-19 Impact Analysis
3.4 Porter’s Five Forces Analysis
3.4.1 Bargaining Power of Suppliers
3.4.2 Bargaining Power of Buyers
3.4.3 Competitive Rivalry
3.4.4 Threat from Substitutes
3.4.5 Threat of New Entrants
3.5 PEST Analysis
4 Lyophilization in Pharmaceuticals Market Analysis by Drug Type
4.1 Key Findings
4.2 Drug Type Segment: Market Attractiveness Index
4.3 Lyophilization in Pharmaceuticals Market Size Estimation and Forecast by Drug Type
4.4 Anti-infective
4.4.1 Market Size by Region, 2023-2033 (US$ bn)
4.4.2 Market Share by Region, 2023 & 2033 (%)
4.5 Antineoplastic
4.5.1 Market Size by Region, 2023-2033 (US$ bn)
4.5.2 Market Share by Region, 2023 & 2033 (%)
4.6 Anticoagulant
4.6.1 Market Size by Region, 2023-2033 (US$ bn)
4.6.2 Market Share by Region, 2023 & 2033 (%)
4.7 Hormones
4.7.1 Market Size by Region, 2023-2033 (US$ bn)
4.7.2 Market Share by Region, 2023 & 2033 (%)
4.8 Antiarrhythmic
4.8.1 Market Size by Region, 2023-2033 (US$ bn)
4.8.2 Market Share by Region, 2023 & 2033 (%)
4.9 Others
4.9.1 Market Size by Region, 2023-2033 (US$ bn)
4.9.2 Market Share by Region, 2023 & 2033 (%)
5 Lyophilization in Pharmaceuticals Market Analysis by Type of Delivery
5.1 Key Findings
5.2 Type of Delivery Segment: Market Attractiveness Index
5.3 Lyophilization in Pharmaceuticals Market Size Estimation and Forecast by Type of Delivery
5.4 Prefilled Diluent Syringes
5.4.1 Market Size by Region, 2023-2033 (US$ bn)
5.4.2 Market Share by Region, 2023 & 2033 (%)
5.5 Multi-step Devices
5.5.1 Market Size by Region, 2023-2033 (US$ bn)
5.5.2 Market Share by Region, 2023 & 2033 (%)
6 Lyophilization in Pharmaceuticals Market Analysis by Indication
6.1 Key Findings
6.2 Indication Segment: Market Attractiveness Index
6.3 Lyophilization in Pharmaceuticals Market Size Estimation and Forecast by Indication
6.4 Autoimmune Diseases
6.4.1 Market Size by Region, 2023-2033 (US$ bn)
6.4.2 Market Share by Region, 2023 & 2033 (%)
6.5 Respiratory Diseases
6.5.1 Market Size by Region, 2023-2033 (US$ bn)
6.5.2 Market Share by Region, 2023 & 2033 (%)
6.6 Gastrointestinal Diseases
6.6.1 Market Size by Region, 2023-2033 (US$ bn)
6.6.2 Market Share by Region, 2023 & 2033 (%)
6.7 Oncology
6.7.1 Market Size by Region, 2023-2033 (US$ bn)
6.7.2 Market Share by Region, 2023 & 2033 (%)
6.8 Cardiovascular Diseases
6.8.1 Market Size by Region, 2023-2033 (US$ bn)
6.8.2 Market Share by Region, 2023 & 2033 (%)
6.9 Infectious Diseases
6.9.1 Market Size by Region, 2023-2033 (US$ bn)
6.9.2 Market Share by Region, 2023 & 2033 (%)
6.10 Metabolic Diseases
6.10.1 Market Size by Region, 2023-2033 (US$ bn)
6.10.2 Market Share by Region, 2023 & 2033 (%)
6.11 Others
6.11.1 Market Size by Region, 2023-2033 (US$ bn)
6.11.2 Market Share by Region, 2023 & 2033 (%)
7 Lyophilization in Pharmaceuticals Market Analysis by Packaging
7.1 Key Findings
7.2 Packaging Segment: Market Attractiveness Index
7.3 Lyophilization in Pharmaceuticals Market Size Estimation and Forecast by Packaging
7.4 Vials
7.4.1 Market Size by Region, 2023-2033 (US$ bn)
7.4.2 Market Share by Region, 2023 & 2033 (%)
7.5 Cartridges
7.5.1 Market Size by Region, 2023-2033 (US$ bn)
7.5.2 Market Share by Region, 2023 & 2033 (%)
7.6 Prefilled devices
7.6.1 Market Size by Region, 2023-2033 (US$ bn)
7.6.2 Market Share by Region, 2023 & 2033 (%)
8 Lyophilization in Pharmaceuticals Market Analysis by Region
8.1 Key Findings
8.2 Regional Segment: Market Attractiveness Index
8.3 Lyophilization in Pharmaceuticals Market Size Estimation and Forecast
9 North America Lyophilization in Pharmaceuticals Market Analysis
9.1 Key Findings
9.2 North America Lyophilization in Pharmaceuticals Market Attractiveness Index
9.3 North America Lyophilization in Pharmaceuticals Market by Country, 2023, 2028 & 2033 (US$ bn)
9.4 North America Lyophilization in Pharmaceuticals Market Size Estimation and Forecast by Country
9.5 North America Lyophilization in Pharmaceuticals Market Size Estimation and Forecast by Drug Type
9.6 North America Lyophilization in Pharmaceuticals Market Size Estimation and Forecast by Type of Delivery
9.7 North America Lyophilization in Pharmaceuticals Market Size Estimation and Forecast by Indication
9.8 North America Lyophilization in Pharmaceuticals Market Size Estimation and Forecast by Packaging
9.9 U.S. Lyophilization in Pharmaceuticals Market Analysis
9.10 Canada Lyophilization in Pharmaceuticals Market Analysis
10 Europe Lyophilization in Pharmaceuticals Market Analysis
10.1 Key Findings
10.2 Europe Lyophilization in Pharmaceuticals Market Attractiveness Index
10.3 Europe Lyophilization in Pharmaceuticals Market by Country, 2023, 2028 & 2033 (US$ bn)
10.4 Europe Lyophilization in Pharmaceuticals Market Size Estimation and Forecast by Country
10.5 Europe Lyophilization in Pharmaceuticals Market Size Estimation and Forecast by Drug Type
10.6 Europe Lyophilization in Pharmaceuticals Market Size Estimation and Forecast by Type of Delivery
10.7 Europe Lyophilization in Pharmaceuticals Market Size Estimation and Forecast by Indication
10.8 Europe Lyophilization in Pharmaceuticals Market Size Estimation and Forecast by Packaging
10.9 Germany Lyophilization in Pharmaceuticals Market Analysis
10.10 France Lyophilization in Pharmaceuticals Market Analysis
10.11 UK Lyophilization in Pharmaceuticals Market Analysis
10.12 Italy Lyophilization in Pharmaceuticals Market Analysis
10.13 Spain Lyophilization in Pharmaceuticals Market Analysis
10.14 Russia Lyophilization in Pharmaceuticals Market Analysis
10.15 Rest of Europe Lyophilization in Pharmaceuticals Market Analysis
11 Asia Pacific Lyophilization in Pharmaceuticals Market Analysis
11.1 Key Findings
11.2 Asia Pacific Lyophilization in Pharmaceuticals Market Attractiveness Index
11.3 Asia Pacific Lyophilization in Pharmaceuticals Market Size Estimation and Forecast by Country
11.4 Asia Pacific Lyophilization in Pharmaceuticals Market Size Estimation and Forecast by Drug Type
11.5 Asia Pacific Lyophilization in Pharmaceuticals Market Analysis by Type of Delivery
11.6 Asia Pacific Lyophilization in Pharmaceuticals Market Analysis by Indication
11.7 Asia Pacific Lyophilization in Pharmaceuticals Market Analysis by Packaging
11.8 Japan Lyophilization in Pharmaceuticals Market Analysis
11.9 China Lyophilization in Pharmaceuticals Market Analysis
11.10 India Lyophilization in Pharmaceuticals Market Analysis
11.11 Australia Lyophilization in Pharmaceuticals Market Analysis
11.12 South Korea Lyophilization in Pharmaceuticals Market Analysis
11.13 Rest of Asia Pacific Lyophilization in Pharmaceuticals Market Analysis
12 Latin America Lyophilization in Pharmaceuticals Market Analysis
12.1 Key Findings
12.2 Latin America Lyophilization in Pharmaceuticals Market Attractiveness Index
12.3 Latin America Lyophilization in Pharmaceuticals Market by Country, 2023, 2028 & 2033 (US$ bn)
12.4 Latin America Lyophilization in Pharmaceuticals Market Size Estimation and Forecast by Country
12.5 Latin America Lyophilization in Pharmaceuticals Market Size Estimation and Forecast by Drug Type
12.6 Latin America Lyophilization in Pharmaceuticals Market Size Estimation and Forecast by Type of Delivery
12.7 Latin America Lyophilization in Pharmaceuticals Market Size Estimation and Forecast by Indication
12.8 Latin America Lyophilization in Pharmaceuticals Market Size Estimation and Forecast by Packaging
12.9 Brazil Lyophilization in Pharmaceuticals Market Analysis
12.10 Mexico Lyophilization in Pharmaceuticals Market Analysis
12.11 Rest of Latin America Lyophilization in Pharmaceuticals Market Analysis
13 MEA Lyophilization in Pharmaceuticals Market Analysis
13.1 Key Findings
13.2 MEA Lyophilization in Pharmaceuticals Market Attractiveness Index
13.3 MEA Lyophilization in Pharmaceuticals Market by Country, 2023, 2028 & 2033 (US$ bn)
13.4 MEA Lyophilization in Pharmaceuticals Market Size Estimation and Forecast by Country
13.5 MEA Lyophilization in Pharmaceuticals Market Size Estimation and Forecast by Drug Type
13.6 MEA Lyophilization in Pharmaceuticals Market Size Estimation and Forecast by Type of Delivery
13.7 MEA Lyophilization in Pharmaceuticals Market Size Estimation and Forecast by Indication
13.8 MEA Lyophilization in Pharmaceuticals Market Analysis by Packaging
13.9 GCC Lyophilization in Pharmaceuticals Market Analysis
13.10 South Africa Lyophilization in Pharmaceuticals Market Analysis
13.11 Rest of MEA Lyophilization in Pharmaceuticals Market Analysis
14 Company Profiles
14.1 Competitive Landscape, 2021
14.2 Bristol-Myers Squibb Company
14.2.1 Company Snapshot
14.2.2 Company Overview
14.2.3 Financial Analysis
14.2.3.1 Net Revenue, 2017-2021
14.2.3.2 R&D, 2017-2021
14.2.3.3 Regional Market Shares, 2021
14.2.4 Product Benchmarking
14.2.5 Strategic Outlook
14.3 Gilead Sciences, Inc.
14.3.1 Company Snapshot
14.3.2 Company Overview
14.3.3 Financial Analysis
14.3.3.1 Net Revenue, 2017-2021
14.3.3.2 R&D, 2017-2021
14.3.3.3 Regional Market Shares, 2021
14.3.4 Product Benchmarking
14.3.5 Strategic Outlook
14.4 Novo Nordisk A/S
14.4.1 Company Snapshot
14.4.2 Company Overview
14.4.3 Financial Analysis
14.4.3.1 Net Revenue, 2017-2021
14.4.3.2 R&D, 2017-2021
14.4.3.3 Regional Market Shares, 2021
14.4.4 Product Benchmarking
14.4.5 Strategic Outlook
14.5 Sanofi
14.5.1 Company Snapshot
14.5.2 Company Overview
14.5.3 Financial Analysis
14.5.3.1 Net Revenue, 2017-2021
14.5.3.2 R&D, 2017-2021
14.5.3.3 Regional Market Shares, 2021
14.5.4 Product Benchmarking
14.5.5 Strategic Outlook
14.6 Aurobindo Pharma
14.6.1 Company Snapshot
14.6.2 Company Overview
14.6.3 Financial Analysis
14.6.3.1 Net Revenue, 2017-2021
14.6.3.2 R&D, 2017-2021
14.6.3.3 Regional Market Shares, 2021
14.6.4 Product Benchmarking
14.6.5 Strategic Outlook
14.7 Fresenius SE & Co. KGaA (Fresenius Kabi)
14.7.1 Company Snapshot
14.7.2 Company Overview
14.7.3 Financial Analysis
14.7.3.1 Net Revenue, 2017-2021
14.7.3.2 R&D, 2017-2021
14.7.3.3 Regional Market Shares, 2021
14.7.4 Product Benchmarking
14.7.5 Strategic Outlook
14.8 Merck & Co., Inc
14.8.1 Company Snapshot
14.8.2 Company Overview
14.8.3 Financial Analysis
14.8.3.1 Net Revenue, 2017-2021
14.8.3.2 R&D, 2017-2021
14.8.3.3 Regional Market Shares, 2021
14.8.4 Product Benchmarking
14.8.5 Strategic Outlook
14.9 Zydus Group
14.9.1 Company Snapshot
14.9.2 Company Overview
14.9.3 Financial Analysis
14.9.3.1 Net Revenue, 2017-2021
14.9.3.2 R&D, 2017-2021
14.9.3.3 Regional Market Shares, 2021
14.9.4 Product Benchmarking
14.9.5 Strategic Outlook
14.10 Vetter Pharma
14.10.1 Company Snapshot
14.10.2 Company Overview
14.10.3 Financial Analysis
14.10.3.1 Net Revenue, 2017-2021
14.10.4 Product Benchmarking
14.10.5 Strategic Outlook
14.11 F. Hoffmann-La Roche Ltd
14.11.1 Company Snapshot
14.11.2 Company Overview
14.11.3 Financial Analysis
14.11.3.1 Net Revenue, 2017-2021
14.11.3.2 R&D, 2017-2021
14.11.3.3 Regional Market Shares, 2021
14.11.4 Product Benchmarking
14.11.5 Strategic Outlook
14.12 Takeda Pharmaceuticals Company Limited
14.12.1 Company Snapshot
14.12.2 Company Overview
14.12.3 Financial Analysis
14.12.3.1 Net Revenue, 2017-2021
14.12.3.2 R&D, 2017-2021
14.12.3.3 Regional Market Shares, 2021
14.12.4 Product Benchmarking
14.12.5 Strategic Outlook
14.13 Johnson & Johnson Services Inc.
14.13.1 Company Snapshot
14.13.2 Company Overview
14.13.3 Financial Analysis
14.13.3.1 Net Revenue, 2017-2021
14.13.3.2 R&D, 2017-2021
14.13.3.3 Regional Market Shares, 2021
14.13.4 Product Benchmarking
14.13.5 Strategic Outlook
14.14 Cipla Inc.
14.14.1 Company Snapshot
14.14.2 Company Overview
14.14.3 Financial Analysis
14.14.3.1 Net Revenue, 2017-2021
14.14.3.2 R&D, 2017-2021
14.14.3.3 Regional Market Shares, 2021
14.14.4 Product Benchmarking
14.14.5 Strategic Outlook
15 Conclusion and Recommendations
15.1 Concluding Remarks from Visiongain
15.2 Recommendations for Market Players
List of Tables
Table 1 Lyophilization in Pharmaceuticals Market Snapshot, 2023 & 2033 (US$ billion, CAGR %)
Table 2 Lyophilization in Pharmaceuticals Market by Region, 2023-2033 (US$ bn, AGR (%), CAGR(%)): “V” Shaped Recovery Scenario
Table 3 Lyophilization in Pharmaceuticals Market by Region, 2023-2033 (US$ bn, AGR (%), CAGR(%)): “U” Shaped Recovery Scenario
Table 4 Lyophilization in Pharmaceuticals Market by Region, 2023-2033 (US$ bn, AGR (%), CAGR(%)): “W” Shaped Recovery Scenario
Table 5 Lyophilization in Pharmaceuticals Market by Region, 2023-2033 (US$ bn, AGR (%), CAGR(%)): “L” Shaped Recovery Scenario
Table 6 Lyophilization in Pharmaceuticals Market by Drug Type, 2023-2033 (US$ bn, AGR (%), CAGR(%))
Table 7 Anti-infective Market Forecast by Region, 2023-2033 (US$ Bn, AGR%, CAGR%)
Table 8 Anti-neoplastic Market Forecast by Region, 2023-2033 (US$ Bn, AGR%, CAGR%)
Table 9 Anticoagulant Market Forecast by Region, 2023-2033 (US$ Bn, AGR%, CAGR%)
Table 10 Hormones Market Forecast by Region, 2023-2033 (US$ Bn, AGR%, CAGR%)
Table 11 Antiarrhythmic Market Forecast by Region, 2023-2033 (US$ Bn, AGR%, CAGR%)
Table 12 Others Market Forecast by Region, 2023-2033 (US$ Bn, AGR%, CAGR%)
Table 13 Lyophilization in Pharmaceuticals Market by Type of Delivery, 2023-2033 (US$ bn, AGR (%), CAGR(%))
Table 14 Prefilled Diluent Syringes Market Forecast by Region, 2023-2033 (US$ Bn, AGR%, CAGR%)
Table 15 Multistep devices Market Forecast by Region, 2023-2033 (US$ Bn, AGR%, CAGR%)
Table 16 Lyophilization in Pharmaceuticals Market by Indication, 2023-2033 (US$ bn, AGR (%), CAGR(%)):
Table 17 Auto-Immune Diseases Market Forecast by Region, 2023-2033 (US$ Bn, AGR%, CAGR%)
Table 18 Respiratory Market Forecast by Region, 2023-2033 (US$ Bn, AGR%, CAGR%)
Table 19 Gastrointestinal Diseases Market Forecast by Region, 2023-2033 (US$ Bn, AGR%, CAGR%)
Table 20 Oncology Market Forecast by Region, 2023-2033 (US$ Bn, AGR%, CAGR%)
Table 21 Cardiovascular Market Forecast by Region, 2023-2033 (US$ Bn, AGR%, CAGR%)
Table 22 Infections Market Forecast by Region, 2023-2033 (US$ Bn, AGR%, CAGR%)
Table 23 Metabolic Disorders Market Forecast by Region, 2023-2033 (US$ Bn, AGR%, CAGR%)
Table 24 Others Market Forecast by Region, 2023-2033 (US$ Bn, AGR%, CAGR%)
Table 25 Lyophilization in Pharmaceuticals Market by Packaging, 2023-2033 (US$ bn, AGR (%), CAGR(%)):
Table 26 Vials Market Forecast by Region, 2023-2033 (US$ Bn, AGR%, CAGR%)
Table 27 Cartridges Market Forecast by Region, 2023-2033 (US$ Bn, AGR%, CAGR%)
Table 28 Prefilled Devices Market Forecast by Region, 2023-2033 (US$ Bn, AGR%, CAGR%)
Table 29 Lyophilization in Pharmaceuticals Market by Region, 2023-2033 (US$ bn, AGR (%), CAGR(%))
Table 30 North America Lyophilization in Pharmaceuticals Forecast by Country
Table 31 North America Lyophilization in Pharmaceuticals Market by Drug Type, 2023-2033 (US$ bn, AGR (%), CAGR(%)):
Table 32 Lyophilization in Pharmaceuticals Market by Type of Delivery, 2023-2033 (US$ bn, AGR (%), CAGR(%))
Table 33 Lyophilization in Pharmaceuticals Market by Indications, 2023-2033 (US$ bn, AGR (%), CAGR(%)):
Table 34 Lyophilization in Pharmaceuticals Market by Packaging, 2023-2033 (US$ bn, AGR (%), CAGR(%)):
Table 35 U.S. Lyophilization in Pharmaceuticals Market Forecast, 2023-2033 (US$ bn, AGR %, CAGR %)
Table 36 Canada Lyophilization in Pharmaceuticals Market Forecast, 2023-2033 (US$ bn, AGR %, CAGR %)
Table 37 Europe Lyophilization in Pharmaceuticals Market Forecast by Country, 2023-2033 (US$ bn, AGR%, CAGR%)
Table 38 Europe Lyophilization in Pharmaceuticals Market by Drug Type, 2023-2033 (US$ bn, AGR (%), CAGR(%)):
Table 39 Europe Lyophilization in Pharmaceuticals Market by Type of delivery, 2023-2033 (US$ bn, AGR (%), CAGR(%))
Table 40 Europe Lyophilization in Pharmaceuticals Market by Indications, 2023-2033 (US$ bn, AGR (%), CAGR(%)):
Table 41 Europe Lyophilization in Pharmaceuticals Market by Packaging, 2023-2033 (US$ bn, AGR (%), CAGR(%)):
Table 42 Germany Lyophilization in Pharmaceuticals Market Forecast, 2023-2033 (US$ bn, AGR (%), CAGR(%))
Table 43 France Lyophilization in Pharmaceuticals Market Forecast, 2023-2033 (US$ bn, AGR (%), CAGR(%)):
Table 44 UK Lyophilization in Pharmaceuticals Market Forecast, 2023-2033 (US$ bn, AGR (%), CAGR(%)):
Table 45 Italy Lyophilization in Pharmaceuticals Market Forecast, 2023-2033 (US$ bn, AGR (%), CAGR(%))
Table 46 Spain Lyophilization in Pharmaceuticals Market Forecast by Country: 2023-2033 (US$ bn, AGR (%), CAGR(%))
Table 47 Russia Lyophilization in Pharmaceuticals Market Forecast, 2023-2033 (US$ bn, AGR (%), CAGR(%))
Table 48 Rest of Europe Lyophilization in Pharmaceuticals Market Forecast, 2023-2033 (US$ bn, AGR (%), CAGR(%))
Table 49 Asia Pacific Lyophilization in Pharmaceuticals forecast by Country 2023-2033 (US$ Bn, AGR%, CAGR%)
Table 50 Asia Pacific Lyophilization in Pharmaceuticals Market by Drug Type, 2023-2033 (US$ bn, AGR (%), CAGR(%)):
Table 51 Asia Pacific in Pharmaceuticals Market by Type of Delivery, 2023-2033 (US$ bn, AGR (%), CAGR(%))
Table 52 Asia Pacific Lyophilization in Pharmaceuticals Market by Indication, 2023-2033 (US$ bn, AGR (%), CAGR(%))
Table 53 Asia Pacific Lyophilization in Pharmaceuticals Market by Packaging, 2023-2033 (US$ bn, AGR (%), CAGR(%))
Table 54 Japan Lyophilization in Pharmaceuticals Market Forecast, 2023-2033 (US$ bn, AGR (%), CAGR(%))
Table 55 China Lyophilization in Pharmaceuticals Market Forecast, 2023-2033 (US$ bn, AGR (%), CAGR(%))
Table 56 India Lyophilization in Pharmaceuticals Market Forecast, 2023-2033 (US$ bn, AGR (%), CAGR(%))
Table 57 Australia Lyophilization in Pharmaceuticals Market Forecast, 2023-2033 (US$ bn, AGR (%), CAGR(%))
Table 58 South Korea Lyophilization in Pharmaceuticals Market Forecast, 2023-2033 (US$ bn, AGR (%), CAGR(%))
Table 59 Rest of Asia Pacific Lyophilization in Pharmaceuticals Market Forecast, 2023-2033 (US$ bn, AGR (%), CAGR(%))
Table 60 Latin America Lyophilization in Pharmaceuticals forecast by Country 2023-2033 (US$ Bn, AGR%, CAGR%)
Table 61 Latin America Lyophilization in Pharmaceuticals Market by Drug Type, 2023-2033 (US$ bn, AGR (%), CAGR(%))
Table 62 Lyophilization in Pharmaceuticals Market by Type of Delivery, 2023-2033 (US$ bn, AGR (%), CAGR(%))
Table 63 Latin America Lyophilization in Pharmaceuticals Market by Indications, 2023-2033 (US$ bn, AGR (%), CAGR(%))
Table 64 Latin America Lyophilization in Pharmaceuticals Market by Packaging, 2023-2033 (US$ bn, AGR (%), CAGR(%))
Table 65 Brazil Lyophilization in Pharmaceuticals Market Forecast, 2023-2033 (US$ bn, AGR (%), CAGR(%))
Table 66 Mexico Lyophilization in Pharmaceuticals Market Forecast, 2023-2033 (US$ bn, AGR (%), CAGR(%))
Table 67 Rest of Latin America Lyophilization in Pharmaceuticals Market Forecast, 2023-2033 (US$ bn, AGR (%), CAGR(%))
Table 68 MEA Lyophilization in Pharmaceuticals forecast by Country 2023-2033 (US$ Bn, AGR%, CAGR%)
Table 69 Lyophilization in Pharmaceuticals Market by Drug Type, 2023-2033 (US$ bn, AGR (%), CAGR(%))
Table 70 MEA Lyophilization in Pharmaceuticals Market by Type of delivery, 2023-2033 (US$ bn, AGR (%), CAGR(%))
Table 71 MEA Lyophilization in Pharmaceuticals Market by Indications, 2023-2033 (US$ bn, AGR (%), CAGR(%)):
Table 72 MEA Lyophilization in Pharmaceuticals Market by Packaging, 2023-2033 (US$ bn, AGR (%), CAGR(%)):
Table 73 GCC Lyophilization in Pharmaceuticals Market Forecast, 2023-2033 (US$ bn, AGR (%), CAGR(%))
Table 74 South Africa Lyophilization in Pharmaceuticals Market Forecast, 2023-2033 (US$ bn, AGR (%), CAGR(%))
Table 75 Rest of MEA Lyophilization in Pharmaceuticals Market Forecast, 2023-2033 (US$ bn, AGR (%), CAGR(%))
Table 76 Bristol-Myers Squibb Company: Key Details, (CEO, HQ, Revenue, Founded, No. of Employees, Company Type, Website, Business Segment)
Table 77 Bristol-Myers Squibb Company: Product Benchmarking
Table 78 Bristol-Myers Squibb Company: Strategic Outlook
Table 79 Gilead Sciences, Inc.: Key Details, (CEO, HQ, Revenue, Founded, No. of Employees, Company Type, Website, Business Segment)
Table 80 Gilead Sciences, Inc.: Product Benchmarking
Table 81 Gilead Sciences, Inc.: Strategic Outlook
Table 82 Novo Nordisk: Key Details, (CEO, HQ, Revenue, Founded, No. of Employees, Company Type, Website, Business Segment)
Table 83 Novo Nordisk, Inc.: Product Benchmarking
Table 84 Novo Nordisk.: Strategic Outlook
Table 85 Sanofi: Key Details, (CEO, HQ, Revenue, Founded, No. of Employees, Company Type, Website, Business Segment)
Table 86 Sanofi.: Product Benchmarking
Table 87 Sanofi.: Strategic Outlook
Table 88 Aurobindo Pharma: Key Details, (CEO, HQ, Revenue, Founded, No. of Employees, Company Type, Website, Business Segment)
Table 89 Aurobindo Pharma: Product Benchmarking
Table 90 Aurobindo Pharma.: Strategic Outlook
Table 91 Fresenius Kabi: Key Details, (CEO, HQ, Revenue, Founded, No. of Employees, Company Type, Website, Business Segment)
Table 92 Fresenius Kabi: Product Benchmarking
Table 93 Fresenius Kabi: Strategic Outlook
Table 94 Merck & Co., Inc.: Key Details, (CEO, HQ, Revenue, Founded, No. of Employees, Company Type, Website, Business Segment)
Table 95 Merck & Co., Inc.: Product Benchmarking
Table 96 Merck & Co., Inc.: Strategic Outlook
Table 97 Zydus: Key Details, (CEO, HQ, Revenue, Founded, No. of Employees, Company Type, Website, Business Segment)
Table 98 Zydus.: Product Benchmarking
Table 99 Zydus.: Strategic Outlook
Table 100 Vetter Pharma: Key Details, (CEO, HQ, Revenue, Founded, No. of Employees, Company Type, Website, Business Segment)
Table 101 Vetter Pharma: Product Benchmarking
Table 102 Vetter Pharma: Strategic Outlook
Table 103 F. Hoffmann-La Roche Ltd: Key Details, (CEO, HQ, Revenue, Founded, No. of Employees, Company Type, Website, Business Segment)
Table 104 F. Hoffmann-La Roche Ltd.: Product Benchmarking
Table 105 F. Hoffmann-La Roche Ltd.: Strategic Outlook
Table 106 Takeda: Key Details, (CEO, HQ, Revenue, Founded, No. of Employees, Company Type, Website, Business Segment)
Table 107 Takeda: Product Benchmarking
Table 108 Takeda: Strategic Outlook
Table 109 Johnson & Johnson: Key Details, (CEO, HQ, Revenue, Founded, No. of Employees, Company Type, Website, Business Segment)
Table 110 Johnson & Johnson: Product Benchmarking
Table 111 Johnson & Johnson: Strategic Outlook
Table 112 Cipla Inc.: Key Details, (CEO, HQ, Revenue, Founded, No. of Employees, Company Type, Website, Business Segment)
Table 113 Cipla Inc.: Product Benchmarking
Table 114 Cipla Inc.: Strategic Outlook
List of Figures
Figure 1 Lyophilization in Pharmaceuticals Market Segmentation
Figure 2 Lyophilization in Pharmaceuticals Market by Drug type: Market Attractiveness Index
Figure 3 Lyophilization in Pharmaceuticals Market by Type of Delivery: Market Attractiveness Index
Figure 4 Lyophilization in Pharmaceuticals Market by Indication: Market Attractiveness Index
Figure 5 Lyophilization in Pharmaceuticals Market by Packaging: Market Attractiveness Index
Figure 6 Lyophilization in Pharmaceuticals Market Attractiveness Index by Region
Figure 7 Lyophilization in Pharmaceuticals Market: Market Dynamics
Figure 8 COVID Impact Analysis: Lyophilization in Pharmaceuticals Market Recovery Scenarios
Figure 9 Lyophilization in Pharmaceuticals Market by Region, 2023-2033 (US$ bn, AGR (%), CAGR (%)): “V” Shaped Recovery
Figure 10 Lyophilization in Pharmaceuticals Market by Region, 2023-2033 (US$ bn, AGR (%), CAGR (%)): “U” Shaped Recovery
Figure 11 Lyophilization in Pharmaceuticals Market by Region, 2023-2033 (US$ bn, AGR (%), CAGR (%)): “W” Shaped Recovery
Figure 12 Lyophilization in Pharmaceuticals Market by Region, 2023-2033 (US$ bn, AGR (%), CAGR (%)): “L” Shaped Recovery
Figure 13 Lyophilization in Pharmaceuticals Market: Porter’s Five Forces Analysis
Figure 14 Lyophilization in Pharmaceuticals Market: PEST Analysis
Figure 15 Lyophilization in Pharmaceuticals Market by Drug type: Market Attractiveness Index
Figure 16 Lyophilization in Pharmaceuticals Market Forecast by Drug Type, 2023-2033 (US$ billion)
Figure 17 Lyophilization in Pharmaceuticals Market Share Forecast by Drug Type, 2023, 2033 (%)
Figure 18 Anti-infective Market Forecast by Region, 2023-2033 (US$ billion)
Figure 19 Anti-infective Market Share Forecast by Region, 2023 & 2033 (%)
Figure 20 Antineoplastic Market Forecast by Region, 2023-2033 (US$ billion)
Figure 21 Antineoplastic Market Share Forecast by Region, 2023 & 2033 (%)
Figure 22 Anticoagulant Market Forecast by Region, 2023-2033 (US$ billion)
Figure 23 Anticoagulant Market Share Forecast by Region, 2023 & 2033 (%)
Figure 24 Hormones Market Forecast by Region, 2023-2033 (US$ billion)
Figure 25 Hormones Market Share Forecast by Region, 2023 & 2033 (%)
Figure 26 Antiarrhythmic Market Forecast by Region, 2023-2033 (US$ billion)
Figure 27 Antiarrhythmic Market Share Forecast by Region, 2023 & 2033 (%)
Figure 28 Others Market Forecast by Region, 2023-2033 (US$ billion)
Figure 29 Others Market Share Forecast by Region, 2023 & 2033 (%)
Figure 30 Lyophilization in Pharmaceuticals Market by Type of Delivery: Market Attractiveness Index
Figure 31 Lyophilization in Pharmaceuticals Market Forecast by Type of Delivery, 2023-2033 (US$ billion)
Figure 32 Lyophilization in Pharmaceuticals Market Share Forecast by Type of Delivery, 2023 & 2033 (%)
Figure 33 Prefilled Diluent Syringes Market Forecast by Region, 2023-2033 (US$ billion)
Figure 34 Prefilled Diluent Syringes Market Share Forecast by Region, 2023 & 2033 (%)
Figure 35 Multi-step Devices Market Forecast by Region, 2023-2033 (US$ billion)
Figure 36 Multi-step Devices Market Share Forecast by Region, 2023 & 2033 (%)
Figure 37 Lyophilization in Pharmaceuticals Market by Type of Delivery: Market Attractiveness Index
Figure 38 Lyophilization in Pharmaceuticals Market by Indication, 2023-2033 (US$ bn, AGR (%), CAGR(%))
Figure 39 Lyophilization in Pharmaceuticals Market Share Forecast by Indication, 2023 & 2033 (%)
Figure 40 Autoimmune Diseases Market Forecast by Region, 2023-2033 (US$ billion)
Figure 41 Autoimmune Diseases Market Share Forecast by Region, 2023 & 2033 (%)
Figure 42 Respiratory Diseases Market Forecast by Region, 2023-2033 (US$ billion)
Figure 43 Respiratory Diseases Market Share Forecast by Region, 2023 & 2033 (%)
Figure 44 Gastrointestinal Diseases Market Forecast by Region, 2023-2033 (US$ billion)
Figure 45 Gastrointestinal Diseases Market Share Forecast by Region, 2023 & 2033 (%)
Figure 46 Oncology Diseases Market Forecast by Region, 2023-2033 (US$ billion)
Figure 47 Oncology Diseases Market Share Forecast by Region, 2023 & 2033 (%)
Figure 48 Cardiovascular Diseases Market Forecast by Region, 2023-2033 (US$ billion)
Figure 49 Cardiovascular Diseases Market Share Forecast by Region, 2023 & 2033 (%)
Figure 50 Infectious Diseases Market Forecast by Region, 2023-2033 (US$ billion)
Figure 51 Infectious Diseases Market Share Forecast by Region, 2023 & 2033 (%)
Figure 52 Metabolic Diseases Market Forecast by Region, 2023-2033 (US$ billion)
Figure 53 Metabolic Diseases Market Share Forecast by Region, 2023 & 2033 (%)
Figure 54 Others Market Forecast by Region, 2023-2033 (US$ billion)
Figure 55 Others Market Share Forecast by Region, 2023 & 2033 (%)
Figure 56 Lyophilization in Pharmaceuticals Market by Packaging: Market Attractiveness Index
Figure 57 Lyophilization in Pharmaceuticals Market by Packaging, 2023-2033 (US$ bn, AGR (%), CAGR(%))
Figure 58 Lyophilization in Pharmaceuticals Market Share Forecast by Packaging, 2023 & 2033 (%)
Figure 59 Vials Market Forecast by Region, 2023-2033 (US$ billion)
Figure 60 Vials Market Share Forecast by Region, 2023 & 2033 (%)
Figure 61 Cartridges Market Forecast by Region, 2023-2033 (US$ billion)
Figure 62 Cartridges Market Share Forecast by Region, 2023 & 2033 (%)
Figure 63 Prefilled devices Market Forecast by Region, 2023-2033 (US$ billion)
Figure 64 Prefilled devices Market Share Forecast by Region, 2023 & 2033 (%)
Figure 65 Lyophilization in Pharmaceuticals Market by Region: Market Attractiveness Index
Figure 66 Lyophilization in Pharmaceuticals Market by Region, 2023-2033 (US$ bn)
Figure 67 Lyophilization in Pharmaceuticals Market Share Forecast by Region 2023, 2033(%)
Figure 68 North America Lyophilization in Pharmaceuticals Market Attractiveness Index
Figure 69 North America Lyophilization in Pharmaceuticals Market by Region, 2023, 2028 & 2033 (US$ billion)
Figure 70 North America Lyophilization in Pharmaceuticals Market Forecast by Country, 2023-2033 (US$ billion)
Figure 71 North America Lyophilization in Pharmaceuticals Market Share Forecast by Country, 2023 & 2033 (%)
Figure 72 North America Lyophilization in Pharmaceuticals Market Forecast by Drug Type, 2023-2033 (US$ billion)
Figure 73 North America Lyophilization in Pharmaceuticals Market Share Forecast by Drug Type, 2023 & 2033 (%)
Figure 74 North America Lyophilization in Pharmaceuticals Market Forecast by Type of Delivery, 2023-2033 (US$ billion)
Figure 75 North America Lyophilization in Pharmaceuticals Market Share Forecast by Type of Delivery, 2023 & 2033 (%)
Figure 76 U.S. Lyophilization in Pharmaceuticals Market Forecast, 2023-2033 (US$ billion, AGR %)
Figure 77 North America Lyophilization in Pharmaceuticals Market Share Forecast by Indication, 2023 & 2033 (%)
Figure 78 North America Lyophilization in Pharmaceuticals Market Share Forecast by Packaging, 2023 & 2033 (%)
Figure 79 North America Lyophilization in Pharmaceuticals Market Share Forecast by Packaging, 2023 & 2033 (%)
Figure 80 U.S. Lyophilization in Pharmaceuticals Market Forecast, 2023-2033 (US$ billion, AGR %)
Figure 81 Canada Lyophilization in Pharmaceuticals Market Forecast, 2023-2033 (US$ billion, AGR %)
Figure 82 Europe Lyophilization in Pharmaceuticals Market Attractiveness Index
Figure 83 Europe Lyophilization in Pharmaceuticals Market by Region, 2023, 2028 & 2033 (US$ billion)
Figure 84 Europe Lyophilization in Pharmaceuticals Market Forecast by Country, 2023-2033 (US$ billion)
Figure 85 Europe Lyophilization in Pharmaceuticals Market Share Forecast by Country, 2023 & 2033 (%)
Figure 86 Europe Lyophilization in Pharmaceuticals Market Forecast by Drug Type, 2023-2033 (US$ billion)
Figure 87 Europe Lyophilization in Pharmaceuticals Market Share Forecast by Drug Type, 2023 & 2033 (%)
Figure 88 Europe Lyophilization in Pharmaceuticals Market Forecast by Type of Delivery, 2023-2033 (US$ billion)
Figure 89 Europe Lyophilization in Pharmaceuticals Market Share Forecast by Type of Delivery, 2023 & 2033 (%)
Figure 90 Europe Lyophilization in Pharmaceuticals Market Forecast by Indications, 2023-2033 (US$ billion, AGR %)
Figure 91 Europe Lyophilization in Pharmaceuticals Market Share Forecast by Indications, 2023 & 2033 (%)
Figure 92 Europe Lyophilization in Pharmaceuticals Market Forecast by Packaging, 2023-2033 (US$ billion, AGR %)
Figure 93 Europe Lyophilization in Pharmaceuticals Market Share Forecast by Packaging, 2023 & 2033 (%)
Figure 94 Germany Lyophilization in Pharmaceuticals Market Forecast, 2023-2033 (US$ billion, AGR %)
Figure 95 France Lyophilization in Pharmaceuticals Market Forecast, 2023-2033 (US$ billion, AGR %)
Figure 96 UK Lyophilization in Pharmaceuticals Market Forecast, 2023-2033 (US$ billion, AGR %)
Figure 97 Italy Lyophilization in Pharmaceuticals Market Forecast, 2023-2033 (US$ billion, AGR %)
Figure 98 Spain Lyophilization in Pharmaceuticals Market Forecast, 2023-2033 (US$ billion, AGR %)
Figure 99 Russia Lyophilization in Pharmaceuticals Market Forecast, 2023-2033 (US$ billion, AGR %)
Figure 100 Rest of Europe Lyophilization in Pharmaceuticals Market Forecast, 2023-2033 (US$ billion, AGR %)
Figure 101 Asia Pacific Lyophilization in Pharmaceuticals Market Attractiveness Index
Figure 102 Asia Pacific Lyophilization in Pharmaceuticals Market Forecast, 2023-2033 (US$ billion, AGR %)
Figure 103 Asia Pacific Lyophilization in Pharmaceuticals Market Share Forecast by Country, 2023 & 2033 (%)
Figure 104 Asia Pacific Lyophilization in Pharmaceuticals Market Forecast by Drug Type, 2023-2033 (US$ billion, AGR %)
Figure 105 Asia Pacific Lyophilization in Pharmaceuticals Market Share Forecast by Drug Type, 2023 & 2033 (%)
Figure 106 Asia Pacific Lyophilization in Pharmaceuticals Market Forecast by Type of Delivery, 2023-2033 (US$ billion, AGR %)
Figure 107 Asia Pacific Lyophilization in Pharmaceuticals Market Share Forecast by Type of Delivery, 2023 & 2033 (%)
Figure 108 Asia Pacific Lyophilization in Pharmaceuticals Market Forecast by Indication, 2023-2033 (US$ billion, AGR %)
Figure 109 Asia Pacific Lyophilization in Pharmaceuticals Market Share Forecast by Indication, 2023 & 2033 (%)
Figure 110 Asia Pacific Lyophilization in Pharmaceuticals Market Forecast by Packaging, 2023-2033 (US$ billion, AGR %)
Figure 111 Asia Pacific Lyophilization in Pharmaceuticals Market Share Forecast by Packaging, 2023 & 2033 (%)
Figure 112 Japan Lyophilization in Pharmaceuticals Market Forecast, 2023-2033 (US$ billion, AGR %)
Figure 113 China Lyophilization in Pharmaceuticals Market Forecast, 2023-2033 (US$ billion, AGR %)
Figure 114 India Lyophilization in Pharmaceuticals Market Forecast, 2023-2033 (US$ billion, AGR %)
Figure 115 Australia Lyophilization in Pharmaceuticals Market Forecast, 2023-2033 (US$ billion, AGR %)
Figure 116 South Korea Lyophilization in Pharmaceuticals Market Forecast, 2023-2033 (US$ billion, AGR %)
Figure 117 Rest of Asia Pacific Lyophilization in Pharmaceuticals Market Forecast, 2023-2033 (US$ billion, AGR %)
Figure 118 Latin America Lyophilization in Pharmaceuticals Market Attractiveness Index
Figure 119 Latin America Lyophilization in Pharmaceuticals Market by Country, 2023, 2028 & 2033 (US$ billion)
Figure 120 Latin America Lyophilization in Pharmaceuticals Market Forecast by Country, 2023-2033 (US$ billion)
Figure 121 Latin America Lyophilization in Pharmaceuticals Market Share Forecast by Country, 2023 & 2033 (%)
Figure 122 Latin America Lyophilization in Pharmaceuticals Market Forecast by Drug Type, 2023-2033 (US$ billion)
Figure 123 Latin America Lyophilization in Pharmaceuticals Market Share Forecast by Drug Type, 2023 & 2033 (%)
Figure 124 Latin America Lyophilization in Pharmaceuticals Market Forecast by Type of Delivery, 2023-2033 (US$ billion)
Figure 125 Latin America Lyophilization in Pharmaceuticals Market Share Forecast by Type of Delivery, 2023 & 2033 (%)
Figure 126 Latin America Lyophilization in Pharmaceuticals Market Forecast by Indications, 2023-2033 (US$ billion, AGR %)
Figure 127 Latin America Lyophilization in Pharmaceuticals Market Share Forecast by Indications, 2023 & 2033 (%)
Figure 128 Latin America Lyophilization in Pharmaceuticals Market Forecast by Packaging, 2023-2033 (US$ billion, AGR %)
Figure 129 Latin America Lyophilization in Pharmaceuticals Market Share Forecast by Packaging, 2023 & 2033 (%)
Figure 130 Brazil Lyophilization in Pharmaceuticals Market Forecast, 2023-2033 (US$ billion, AGR %)
Figure 131 Mexico Lyophilization in Pharmaceuticals Market Forecast, 2023-2033 (US$ billion, AGR %)
Figure 132 Rest of Latin America Lyophilization in Pharmaceuticals Market Forecast, 2023-2033 (US$ billion, AGR %)
Figure 133 MEA Lyophilization in Pharmaceuticals Market Attractiveness Index
Figure 134 MEA Lyophilization in Pharmaceuticals Market by Country, 2023, 2028 & 2033 (US$ billion)
Figure 135 MEA Lyophilization in Pharmaceuticals Market Forecast by Country, 2023-2033 (US$ billion)
Figure 136 MEA Lyophilization in Pharmaceuticals Market Share Forecast by Country, 2023 & 2033 (%)
Figure 137 MEA Lyophilization in Pharmaceuticals Market Forecast by Drug Type, 2023-2033 (US$ billion)
Figure 138 MEA Lyophilization in Pharmaceuticals Market Share Forecast by Drug Type, 2023 & 2033 (%)
Figure 139 MEA Lyophilization in Pharmaceuticals Market Forecast by Type of Delivery, 2023-2033 (US$ billion)
Figure 140 MEA Lyophilization in Pharmaceuticals Market Share Forecast by Type of Delivery, 2023 & 2033 (%)
Figure 141 MEA Lyophilization in Pharmaceuticals Market Indications, 2023-2033 (US$ billion, AGR %)
Figure 142 MEA Lyophilization in Pharmaceuticals Market Share Forecast by Indications, 2023 & 2033 (%)
Figure 143 MEA Lyophilization in Pharmaceuticals Market Forecast by Packaging, 2023-2033 (US$ billion, AGR %)
Figure 144 MEA Lyophilization in Pharmaceuticals Market Share Forecast by Packaging, 2023 & 2033 (%)
Figure 145 GCC Lyophilization in Pharmaceuticals Market Forecast, 2023-2033 (US$ billion, AGR %)
Figure 146 South Africa Lyophilization in Pharmaceuticals Market Forecast, 2023-2033 (US$ billion, AGR %)
Figure 147 Rest of MEA Lyophilization in Pharmaceuticals Market Forecast, 2023-2033 (US$ billion, AGR %)
Figure 148 Bristol-Myers Squibb Company: Net Revenue, 2017-2021 (US$ million, AGR%)
Figure 149 Bristol-Myers Squibb Company: R&D, 2017-2021 (US$ million, AGR%)
Figure 150 Bristol-Myers Squibb Company: Regional Market Shares, 2021
Figure 151 Gilead Sciences, Inc.: Net Revenue, 2017-2021 (US$ million, AGR%)
Figure 152 Gilead Sciences, Inc.: R&D, 2017-2021 (US$ million, AGR%)
Figure 153 Gilead Sciences, Inc.: Regional Market Shares, 2021
Figure 154 Novo Nordisk: Net Revenue, 2017-2021 (US$ million, AGR%)
Figure 155 Novo Nordisk: R&D, 2017-2021 (US$ million, AGR%)
Figure 156 Novo Nordisk: Regional Market Shares, 2021
Figure 157 Sanofi: Net Revenue, 2017-2021 (US$ million, AGR%)
Figure 158 Sanofi: R&D, 2017-2021 (US$ million, AGR%)
Figure 159 Sanofi: Regional Market Shares, 2021
Figure 160 Aurobindo Pharma: Net Revenue, 2017-2021 (US$ million, AGR%)
Figure 161 Aurobindo Pharma: R&D, 2017-2021 (US$ million, AGR%)
Figure 162 Aurobindo Pharma: Regional Market Shares, 2021
Figure 163 Fresenius Kabi: Net Revenue, 2017-2021 (US$ million, AGR%)
Figure 164 Fresenius Kabi AG: R&D, 2017-2021 (US$ million, AGR%)
Figure 165 Fresenius Kabi AG: Regional Market Shares, 2021
Figure 166 Merck & Co., Inc.: Net Revenue, 2017-2021 (US$ million, AGR%)
Figure 167 Merck & Co., Inc.: R&D, 2017-2021 (US$ million, AGR%)
Figure 168 Merck & Co., Inc.: Regional Market Shares, 2021
Figure 169 Zydus: Net Revenue, 2017-2021 (US$ million, AGR%)
Figure 170 Zydus: R&D, 2017-2021 (US$ million, AGR%)
Figure 171 Zydus: Regional Market Shares, 2021
Figure 172 F. Hoffmann-La Roche Ltd: Net Revenue, 2017-2021 (US$ million, AGR%)
Figure 173 F. Hoffmann-La Roche Ltd.: R&D, 2017-2021 (US$ million, AGR%)
Figure 174 F. Hoffmann-La Roche Ltd.: Regional Market Shares, 2021
Figure 175 Takeda: Net Revenue, 2017-2021 (US$ million, AGR%)
Figure 176 Takeda: R&D, 2017-2021 (US$ million, AGR%)
Figure 177 Takeda: Regional Market Shares, 2021
Figure 178 Johnson & Johnson: Net Revenue, 2017-2021 (US$ million, AGR%)
Figure 179 Johnson & Johnson: R&D, 2017-2021 (US$ million, AGR%)
Figure 180 Johnson & Johnson: Regional Market Shares, 2021
Figure 181 Cipla Inc.: Net Revenue, 2017-2021 (US$ million, AGR%)
Figure 182 Cipla Inc.: R&D, 2017-2021 (US$ million, AGR%)
Figure 183 Cipla Inc.: Regional Market Shares, 2021
ページTOPに戻る
- 本レポートと同じKEY WORDの最新刊レポートはありません。
よくあるご質問
Visiongain社はどのような調査会社ですか?
英国の調査会社ヴィジョンゲイン社(Visiongain)は、通信とエネルギーのほか、自動車や化学・医薬品、金属など、広範な市場を対象に調査を行っています。自動車市場については、市場全般に関する調査のほ... もっと見る
調査レポートの納品までの日数はどの程度ですか?
在庫のあるものは速納となりますが、平均的には 3-4日と見て下さい。
但し、一部の調査レポートでは、発注を受けた段階で内容更新をして納品をする場合もあります。
発注をする前のお問合せをお願いします。
注文の手続きはどのようになっていますか?
1)お客様からの御問い合わせをいただきます。
2)見積書やサンプルの提示をいたします。
3)お客様指定、もしくは弊社の発注書をメール添付にて発送してください。
4)データリソース社からレポート発行元の調査会社へ納品手配します。
5) 調査会社からお客様へ納品されます。最近は、pdfにてのメール納品が大半です。
お支払方法の方法はどのようになっていますか?
納品と同時にデータリソース社よりお客様へ請求書(必要に応じて納品書も)を発送いたします。
お客様よりデータリソース社へ(通常は円払い)の御振り込みをお願いします。
請求書は、納品日の日付で発行しますので、翌月最終営業日までの当社指定口座への振込みをお願いします。振込み手数料は御社負担にてお願いします。
お客様の御支払い条件が60日以上の場合は御相談ください。
尚、初めてのお取引先や個人の場合、前払いをお願いすることもあります。ご了承のほど、お願いします。
データリソース社はどのような会社ですか?
当社は、世界各国の主要調査会社・レポート出版社と提携し、世界各国の市場調査レポートや技術動向レポートなどを日本国内の企業・公官庁及び教育研究機関に提供しております。
世界各国の「市場・技術・法規制などの」実情を調査・収集される時には、データリソース社にご相談ください。
お客様の御要望にあったデータや情報を抽出する為のレポート紹介や調査のアドバイスも致します。
|
|


