間葉系幹細胞市場レポート:2022-2032
Mesenchymal Stem Cells Market Report 2022-2032
レポート詳細
間葉系幹細胞市場レポート 2022-2032 :本レポートは、新たな収益の柱を目指すリーディングカンパニーが、業界とその背景にあるダイナミクスをより深く理解する上で、非常に有益なものと... もっと見る
※上記価格は部署ライセンス(Departmental licence)価格です。
その他の価格についてはデータリソースまでお問合せください。
日本語のページは自動翻訳を利用し作成しています。
実際のレポートは英文のみでご納品いたします。

|
サマリー
レポート詳細
間葉系幹細胞市場レポート 2022-2032:本レポートは、新たな収益の柱を目指すリーディングカンパニーが、業界とその背景にあるダイナミクスをより深く理解する上で、非常に有益なものとなるでしょう。また、異業種への進出や新地域での既存事業の拡大を目指す企業にとっても有用なレポートです。
様々な治療分野での応用や臨床試験数の増加が市場成長を促進する要因に
間葉系幹細胞市場を推進する主な要因としては、血液疾患、移植片対宿主病、臓器移植、糖尿病、炎症性疾患、肝臓・腎臓・肺の疾患、心臓血管、骨・軟骨、神経、自己免疫疾患などの幅広い分野での間葉系幹細胞の応用が挙げられます。間葉系幹細胞を用いた治療法の臨床試験件数が増加していることは、市場を牽引する大きな要因の一つです。間葉系幹細胞研究への投資や資金調達の増加、整形外科疾患の発生率や癌の発生率の増加が、世界市場の成長をサポートすると予想されます。
間葉系幹細胞の技術移転と限定的な拡大への挑戦
しかし、臨床試験において多くの失敗が報告されており、FDAから拒絶反応を示されている。ドナーから得られたMSCは、年齢、性別、遺伝的体質、健康状態などの要因により不均質である。また、脂肪組織、骨髄、筋肉、臍帯など異なる由来から分離された間葉系幹細胞は、分化能や幹細胞の程度に差があることが観察されている。また、培養条件、フラスコやバイオリアクターの継代数、酸素濃度、細胞表面の改質など、さらなる拡大能力にも矛盾がある。さらに、MSCは肝細胞、神経細胞、膵島細胞など様々な種類の細胞に分化する能力も持っている。したがって、試験管内でMSCを誘導しても、病気の治療に必要な純粋な細胞が得られない可能性がかなりある。
マーケットリサーチレポートを購入する前に、どのような質問をすべきでしょうか?
- 間葉系幹細胞市場はどのように進化しているのか?
- 何が間葉系幹細胞市場を牽引し、何が抑制しているのか?
- 間葉系幹細胞の各サブマーケットセグメントは予測期間中にどのように成長し、2032年にはどの程度の売上を占めるようになるのか?
- 2022年から2032年にかけて、間葉系幹細胞の各サブマーケットの市場シェアはどのように推移するのだろうか?
- 2022年から2032年にかけて、市場全体の主なドライバーは何になるのだろうか?
- 間葉系幹細胞の主要市場はマクロ経済のダイナミクスに概ね追随するのか、それとも個々の国別市場が他を凌駕するのか?
- 2032年までに各国市場のシェアはどのように変化し、どの地域が2032年の市場をリードするのか?
- 主要プレイヤーは誰か、また予測期間中の見込みは?
- これらの主要企業の間葉系幹細胞プロジェクトはどのようなものなのか?
- 2022年から2032年の間に、業界はどのように進化していくのか?現在および今後10年間に実施される間葉系幹細胞プロジェクトにはどのような意味があるのでしょうか?
- 間葉系幹細胞市場をさらに拡大するために、製品の商業化の必要性は高まっているのでしょうか?
- 間葉系幹細胞市場はどこに向かい、どのようにすれば市場の最前線に立つことができるのか?
- 新製品やサービスラインに対する最適な投資オプションは何か?
- 企業を新たな成長軌道に乗せ、C-suiteに移行させるための重要な展望とは?
・ What are the key prospects for moving companies into a new growth path and C-suite?
このことが間葉系幹細胞市場に現在、そして今後10年間、どのような影響を与えるかを知る必要があります。
- 282ページにわたる本レポートでは、117の表と184のチャート/グラフを独占的に提供します。
- このレポートでは、業界における主要な収益性の高い分野をハイライトしているため、今すぐターゲットを絞ることができます。
- 世界、地域、国別の売上高と成長率を詳細に分析しています。
- 競合他社が成功した主なトレンド、変化、収益予測をハイライトしています。
本レポートは、間葉系幹細胞市場が今後10年間にどのように発展し、COVID-19の景気後退と回復の変動に対応していくかを教えてくれます。この市場は、過去10年間のどの時点よりも今が重要である。
レポートでは、COVID-19のバリエーションや経済データなど、お客様の市場に特化した独自の情報をお届けしています。
2032年までの予測やその他の分析により、商業的な展望が見えてくる
- 2032年までの収益予測に加え、直近の実績、成長率、市場シェアもご覧いただけます。
- ビジネスの展望や展開など、独自の分析もご覧いただけます。
- 定性的分析(市場力学、促進要因、機会、阻害要因、課題など)、コスト構造、間葉系幹細胞への投資増加の影響、最近の開発状況などをご覧いただけます。
本レポートでは、COVID-19が業界と貴社にどのような影響を及ぼすかについて、データ分析と貴重な洞察を掲載しています。本レポートでは、COVID-19の4つの回収パターンとその影響、すなわち「V」、「L」、「W」、「U」について論じています。
報告書の対象セグメント
タイプ
- 製品情報
- 細胞・細胞株
- キット メディア・試薬
- その他
- サービス
ソース
- 骨髄
- 脂肪組織
- 臍帯血
- 胎児肝臓
- 肺
- 末梢血
- 卵管
- その他のソース
適応症
- 骨・軟骨の修復
- 心臓血管疾患
- 癌
- GvHD
- 炎症性・免疫性疾患
- 肝疾患
- その他の適応症
用途
- 疾患モデリング
- 創薬・医薬品開発
- 幹細胞バンク
- 組織工学
- トキシコロジー研究
- その他
世界市場全体とセグメントの収益予測に加え、5つの地域と17の主要国市場の収益予測も掲載しています。
北米
- 米国
- カナダ
欧州
- ドイツ
- 英国
- フランス
- スペイン
- イタリア
- その他の欧州
アジア太平洋
- 中国
- 日本
- インド
- オーストラリア
- その他のアジア太平洋地域
ラテンアメリカ
- ブラジル
- メキシコ
- アルゼンチン
- その他のラテンアメリカ地域
MEA
- サウジアラビア
- 南アフリカ
- トルコ
- その他のMEA
間葉系幹細胞市場の主要企業のプロファイルと2022年から2032年までの、これらの企業のこのセグメントを中心とした情報も含んでいます。
主要企業と市場成長の可能性
・ Cell Application Inc.
・ Celltex Therapeutics Corporation.
・ Celprogen Inc.
・ Cyagen Biosciences
・ Cytori Therapeutics Inc. (Plus Therapeutics Inc.)
・ Lonza
・ Merck KGaA (Millipore Sigma)
・ PromoCell GmbH
・ STEMCELL Technologies Inc.
・ Stemedica Cell Technologies Inc.
・ Thermo Fischer Scientific Inc.
間葉系幹細胞市場の世界全体の収益、金額ベースで2022年から2032年まで、市場は2022年に27億5000万米ドルを超えると、我々の仕事は計算されます。2032年まで力強い収益成長が予測される。本調査では、最も大きな可能性を秘めた組織を特定しました。彼らの能力、進歩、商業的展望を発見することで、一歩先を行くことができます。
間葉系幹細胞市場、2022年から2032年までのレポートはどのように役立つのでしょうか?
280ページを超えるレポートでは、要約すると以下のような知識を得ることができます。
- 間葉系幹細胞市場の2032年までの収益予測、タイプ、ソース、適応症、用途の各予測を世界および地域レベルで掲載 - 業界の展望を見出し、投資と収益に最も有利な場所を見つけることができます。
- 5つの地域と17の主要国市場の2032年までの収益予測 - 間葉系幹細胞市場の2022年から2032年までの北米、欧州、アジア太平洋とLATAMとMEAの市場予測を参照してください。また、米国、カナダ、メキシコ、ブラジル、ドイツ、フランス、英国、イタリア、中国、インド、日本、オーストラリアなどの主要経済圏の市場も予測されています。
- 間葉系幹細胞市場に関与する主要企業11社の企業プロファイルを含む、既存企業および市場参入を目指す企業の展望(2022年~2032年)。
定量的・定性的な分析と独自の予測をご覧いただけます。私たちのレポートだけが持つ情報を入手し、貴重なビジネスインテリジェンスを得ることができます。
他にはない情報
私たちの新しいレポートがあれば、知識の遅れを取り戻し、チャンスを逃す可能性が低くなります。私たちの研究が貴社の研究、分析、意思決定にどのように役立つかをご覧ください。Visiongainの調査は、間葉系幹細胞市場、2022年から2032年、市場をリードする企業の商業分析を必要とするすべての人のためのものです。データ、トレンド、予測をご覧いただけます。
ページTOPに戻る
目次
目次
1.レポートの概要
1.1 研究の目的
1.2 間葉系幹細胞市場の紹介
1.3 本レポートが提供するもの
1.4 本レポートを読むべき理由
1.5 本分析レポートが回答する主な質問には以下が含まれる。
1.6 本レポートは誰のためのものなのか?
1.7 方法論
1.7.1 市場の定義
1.7.2 市場評価・予測手法
1.7.3 データの検証
1.8 よくある質問と回答(FAQ)
1.9 関連するVisiongainレポート
1.10 Visiongainについて
2 エグゼクティブサマリー
3 市場の概要
3.1 主要な調査結果
3.2 マーケットダイナミクス
3.2.1 市場の推進要因
3.2.2 市場の抑制要因
3.2.3 市場機会
3.3 COVID-19影響度分析
3.4 ポーターのファイブフォース分析
3.4.1 サプライヤーパワー
3.4.2 バイヤーパワー
3.4.3 競争相手との競合
3.4.4 代替品による脅威
3.4.5 新規参入者の脅威
3.5 PESTLE分析
4 間葉系幹細胞市場分析:タイプ別
4.1 主な調査結果
4.2 タイプ別成長展望
4.3 間葉系幹細胞のタイプ別市場規模の推定と予測
4.4 製品
4.4.1 地域別市場予測、2022年~2032年 (US$ Mn)
4.4.2 地域別市場シェア、2022年&2032年(%)
4.5 細胞・細胞株
4.5.1 地域別市場予測、2022年~2032年 (US$ Mn)
4.5.2 地域別市場シェア、2022年~2032年(%)
4.6 キット、メディア、試薬
4.6.1 地域別市場予測、2022年~2032年 (US$ Mn)
4.6.2 地域別市場シェア、2022-2032 (%)
4.7 その他
4.7.1 地域別市場予測、2022年-2032年 (US$ Mn)
4.7.2 地域別市場シェア、2022-2032年(%)
4.8 サービス
4.8.1 地域別市場予測、2022年~2032年 (US$ Mn)
4.8.2 地域別市場シェア、2022-2032年(%)
5 間葉系幹細胞市場分析:ソース別
5.1 主な調査結果
5.2 ソース別成長展望
5.3 間葉系幹細胞のソース別市場規模推定・予測
5.4 骨髄
5.4.1 地域別市場予測、2022年~2032年 (US$ Mn)
5.4.2 地域別市場シェア、2022年&2032年(%)
5.5 脂肪組織
5.5.1 地域別市場予測、2022年~2032年 (US$ Mn)
5.5.2 地域別市場シェア、2022年&2032年(%)
5.6 臍帯血
5.6.1 地域別市場予測、2022年~2032年 (US$ Mn)
5.6.2 地域別市場シェア、2022年&2032年(%)
5.7 胎児肝臓
5.7.1 地域別市場予測、2022年~2032年 (US$ Mn)
5.7.2 地域別市場シェア、2022年&2032年(%)
5.8 肺
5.8.1 地域別市場予測、2022年〜2032年 (US$ Mn)
5.8.2 地域別市場シェア、2022年&2032年(%)
5.9 末梢血液
5.9.1 地域別市場予測、2022年〜2032年 (US$ Mn)
5.9.2 地域別市場シェア、2022年&2032年(%)
5.10 卵管
5.10.1 地域別市場予測、2022年〜2032年 (US$ Mn)
5.10.2 地域別市場シェア、2022年&2032年(%)
5.11 その他
5.11.1 地域別市場予測、2022年〜2032年 (US$ Mn)
5.11.2 地域別市場シェア、2022年&2032年(%)
6 間葉系幹細胞市場分析:適応症別
6.1 主要な調査結果
6.2 適応症別の成長展望
6.3 間葉系幹細胞の適応症別市場規模の推定と予測
6.4 骨・軟骨修復
6.4.1 地域別市場予測、2022-2032 (US$ Mn)
6.4.2 地域別市場シェア、2022年&2032年(%)
6.5 循環器系疾患
6.5.1 地域別市場予測、2022年〜2032年 (US$ Mn)
6.5.2 地域別市場シェア、2022年〜2032年 (%)
6.6 癌
6.6.1 地域別市場予測、2022年〜2032年 (US$ Mn)
6.6.2 地域別市場シェア、2022年&2032年(%)
6.7 GvHD
6.7.1 地域別市場予測、2022年〜2032年 (US$ Mn)
6.7.2 地域別市場シェア、2022年&2032年(%)
6.8 炎症性疾患および免疫性疾患
6.8.1 地域別市場予測、2022年~2032年 (US$ Mn)
6.8.2 地域別市場シェア、2022年&2032年(%)
6.9 肝臓疾患
6.9.1 地域別市場予測、2022年〜2032年 (US$ Mn)
6.9.2 地域別市場シェア、2022年&2032年(%) 9.2 地域別市場シェア、2022年&2032年(%) 10 その他
6.10 その他
6.10.1 地域別市場予測、2022年〜2032年 (US$ Mn)
6.10.2 地域別市場シェア、2022年&2032年(%)
7 間葉系幹細胞市場分析:用途別
7.1 主な調査結果
7.2 用途別成長展望
7.3 間葉系幹細胞の用途別市場規模の推定と予測
7.4 疾患モデリング
7.4.1 地域別市場予測、2022年~2032年 (US$ Mn)
7.4.2 地域別市場シェア、2022年&2032年(%)
7.5 創薬・開発
7.5.1 地域別市場予測、2022年~2032年(US$ Mn)
7.5.2 地域別市場シェア、2022年~2032年(%)
7.6 幹細胞バンク
7.6.1 地域別市場予測、2022年〜2032年 (US$ Mn)
7.6.2 地域別市場シェア、2022年&2032年(%)
7.7 組織工学
7.7.1 地域別市場予測、2022年〜2032年 (US$ Mn)
7.7.2 地域別市場シェア、2022年&2032年(%)
7.8 トキシコロジー研究
7.8.1 地域別市場予測、2022年〜2032年 (US$ Mn)
7.8.2 地域別市場シェア、2022年&2032年(%)
7.9 その他
7.9.1 地域別市場予測、2022年〜2032年 (US$ Mn)
7.9.2 地域別市場シェア、2022年&2032年(%)
8 間葉系幹細胞市場分析:地域別
8.1 主な調査結果
8.2 地域別市場規模の推定と予測
9 北米の間葉系幹細胞市場分析
9.1 主な調査結果
9.2 北米間葉系幹細胞市場の魅力度指数
9.3 国別市場規模、2022年、2027年&2032年 (US$Mn)(単位:百万円)
9.4 国別市場規模推計・予測、2022年~2032年(US$ Mn)
9.5 タイプ別市場規模の推定と予測、2022年~2032年(US$ Mn)
9.5.1 製品別市場規模予測・予測、2022年~2032年(US$ Mn)
9.6 ソース別市場規模推定・予測、2022年~2032年 (US$ Mn)
9.7 適応症別市場規模予測・予測、2022年~2032年 (US$ Mn)
9.8 用途別市場規模推定・予測、2022年~2032年 (US$ Mn)
9.9 米国
9.10 カナダ
10 欧州の間葉系幹細胞市場分析
10.1 主な調査結果
10.2 欧州間葉系幹細胞市場の魅力度指数
10.3 国別市場規模、2022年、2027年&2032年(US$ Mn)
10.4 国別市場規模推計・予測、2022年~2032年(US$ Mn)
10.5 タイプ別市場規模の推定と予測、2022年~2032年(US$ Mn)
10.5.1 製品別市場規模予測・予測、2022年~2032年(US$ Mn)
10.6 ソース別市場規模推定・予測、2022年~2032年 (US$ Mn)
10.7 適応症別市場規模予測・予測、2022年~2032年 (US$ Mn)
10.8 用途別市場規模推定・予測、2022年~2032年 (US$ Mn)
10.9 ドイツ
10.10 フランス
10.11 英 国
10.12 イタリア
10.13 スペイン
10.14 その他の欧州
11 アジア太平洋地域の間葉系幹細胞市場の分析
11.1 主な調査結果
11.2 アジア太平洋地域の間葉系幹細胞市場の魅力度指数
11.3 国別市場規模、2022年、2027年&2032年 (US$Mn)(単位:百万円)
11.4 国別市場規模推計・予測、2022年~2032年(US$ Mn)
11.5 タイプ別市場規模の推定と予測、2022年~2032年(US$ Mn)
11.5.1 製品別市場規模予測・予測、2022年~2032年(US$ Mn)
11.6 ソース別市場規模推定・予測、2022年~2032年 (US$ Mn)
11.7 適応症別市場規模予測・予測、2022年~2032年 (US$ Mn)
11.8 用途別市場規模推定・予測、2022年~2032年 (US$ Mn)
11.9 中国
11.10 日本
11.11 インド
11.12 オーストラリア
11.13 その他のアジア太平洋地域
12 中南米間葉系幹細胞市場の分析
12.1 主な調査結果
12.2 中南米間葉系幹細胞市場の魅力度指数
12.3 国別市場規模、2022年、2027年&2032年 (US$Mn)(単位:百万円)
12.4 国別市場規模推計・予測、2022年~2032年(US$ Mn)
12.5 タイプ別市場規模の推定と予測、2022年~2032年(US$ Mn)
12.5.1 製品別市場規模予測・予測、2022年~2032年(US$ Mn)
12.6 ソース別市場規模推定・予測、2022年~2032年 (US$ Mn)
12.7 適応症別市場規模予測・予測、2022年~2032年 (US$ Mn)
12.8 用途別市場規模予測・予測、2022年~2032年 (US$ Mn)
12.9 ブラジル
12.10 メキシコ
12.11 アルゼンチン
12.12 その他のラテンアメリカの地域
13 中東・アフリカの間葉系幹細胞市場分析
13.1 主な調査結果
13.2 中東・アフリカ間葉系幹細胞市場の魅力度指数
13.3 国別市場規模、2022年、2027年、2032年 (US$Mn)(単位:百万円)
13.4 国別市場規模予測・予測、2022年~2032年(US$ Mn)
13.5 タイプ別市場規模の推定と予測、2022年~2032年(US$ Mn)
13.5.1 製品別市場規模予測・予測、2022年~2032年(US$ Mn)
13.6 ソース別市場規模推定・予測、2022年~2032年 (US$ Mn)
13.7 適応症別市場規模予測・予測、2022年~2032年 (US$ Mn)
13.8 用途別市場規模予測・予測、2022年~2032年 (US$ Mn)
13.9 サウジアラビア
13.10 南アフリカ
13.11 トルコ
13.12 その他の中東・アフリカの地域
14 主要企業のプロフィール
14.1 企業シェア分析
14.2 主要事業戦略分析
14.3 サーモフィッシャーサイエンティフィック社
14.3.1 企業スナップショット
14.3.2 会社概要
14.3.3 財務分析
14.3.4 製品ベンチマーク
14.3.5 戦略的な展望
14.4 メルクKGaA(ミリポア・シグマ)
14.4.1 企業スナップショット
14.4.2 会社概要
14.4.3 財務分析
14.4.4 製品ベンチマーク
14.4.5 戦略的展望
14.5 STEMCELL Technologies Inc.
14.5.1 企業スナップショット
14.5.2 会社概要
14.5.3 ベンチマーキング
14.5.4 戦略的展望
14.6 サイトリ・セラピューティクス社(プラス・セラピューティクス社)
14.6.1 企業スナップショット
14.6.2 会社概要
14.6.3 製品ベンチマーク
14.7 サイジェン・バイオサイエンス
14.7.1 企業スナップショット
14.7.2 会社概要
14.7.3 製品ベンチマーク
14.7.4 戦略的展望
14.8 プロモセル社
14.8.1 企業スナップショット
14.8.2 会社概要
14.8.3 製品ベンチマーク
14.9 セルプロジェン
14.9.1 企業スナップショット
14.9.2 会社概要
14.9.3 ベンチマーキング
14.10 ステメディカ・セル・テクノロジーズ
14.10.1 企業スナップショット
14.10.2 会社概要
14.10.3 ベンチマーキング
14.10.4 戦略的な展望
14.11 セルアプリケーションズ
14.11.1 企業スナップショット
14.11.2 会社概要
14.11.3 ベンチマーキング
14.12 ロンザ
14.12.1 企業スナップショット
14.12.2 会社概要
14.12.3 財務分析
14.12.4 製品ベンチマーク
14.12.5 戦略的展望
14.13 セルテックス・セラピューティック
14.13.1 企業スナップショット
14.13.2 会社概要
14.13.3 製品ベンチマーク
14.13.4 戦略的展望
15 結論と提言
15.1 ヴィジョンゲインからの結論
15.2 市場関係者への提言
表の一覧
Table 1 Mesenchymal Stem Cells Market Snapshot, 2022 & 2032 (US$ billion, CAGR %)
Table 2 Mesenchymal Stem Cells Market, 2022-2032 (US$ million, AGR (%), CAGR(%)): “V” Shaped Recovery Scenario
Table 3 Mesenchymal Stem Cells Market, 2022-2032 (US$ million, AGR (%), CAGR(%)): “V” Shaped Recovery Scenario
Table 4 Mesenchymal Stem Cells Market, 2022-2032 (US$ million, AGR (%), CAGR(%)): “W” Shaped Recovery Scenario
Table 5 Mesenchymal Stem Cells Market, 2022-2032 (US$ million, AGR (%), CAGR(%)): “L” Shaped Recovery Scenario
Table 6 Mesenchymal Stem Cells Market Forecast by Type, 2022-2032 (US$ million, AGR %, CAGR %)
Table 7 Products Market Forecast by Region, 2022-2032 (US$ million, AGR %, CAGR %)
Table 8 Cell & Cell Lines Market Forecast by Region, 2022-2032 (US$ million, AGR %, CAGR %)
Table 9 Kits, Media & Reagent Market Forecast by Region, 2022-2032 (US$ million, AGR %, CAGR %)
Table 10 Others Market Forecast by Region, 2022-2032 (US$ million, AGR %, CAGR %)
Table 11 Services Market Forecast by Region, 2022-2032 (US$ million, AGR %, CAGR %)
Table 12 Mesenchymal Stem Cells Market Forecast by Source, 2022-2032 (US$ million, AGR %, CAGR %)
Table 13 Bone Marrow Market Forecast by Region, 2022-2032 (US$ million, AGR %, CAGR %)
Table 14 Adipose Tissues Market Forecast by Region, 2022-2032 (US$ million, AGR %, CAGR %)
Table 15 Cord Blood Market Forecast by Region, 2022-2032 (US$ million, AGR %, CAGR %)
Table 16 Fetal Liver Market Forecast by Region, 2022-2032 (US$ million, AGR %, CAGR %)
Table 17 Lung Market Forecast by Region, 2022-2032 (US$ million, AGR %, CAGR %)
Table 18 Peripheral Blood Market Forecast by Region, 2022-2032 (US$ million, AGR %, CAGR %)
Table 19 Fallopian Tube Market Forecast by Region, 2022-2032 (US$ million, AGR %, CAGR %)
Table 20 Others Market Forecast by Region, 2022-2032 (US$ million, AGR %, CAGR %)
Table 21 Mesenchymal Stem Cells Market Forecast by Indication, 2022-2032 (US$ million, AGR %, CAGR %)
Table 22 Bone And Cartilage Repair Market Forecast by Region, 2022-2032 (US$ million, AGR %, CAGR %)
Table 23 Cardiovascular Diseases Market Forecast by Region, 2022-2032 (US$ million, AGR %, CAGR %)
Table 24 Cancer Market Forecast by Region, 2022-2032 (US$ million, AGR %, CAGR %)
Table 25 GvHD Market Forecast by Region, 2022-2032 (US$ million, AGR %, CAGR %)
Table 26 Inflammatory And Immunological Diseases Market Forecast by Region, 2022-2032 (US$ million, AGR %, CAGR %)
Table 27 Liver Diseases Market Forecast by Region, 2022-2032 (US$ million, AGR %, CAGR %)
Table 28 Others Market Forecast by Region, 2022-2032 (US$ million, AGR %, CAGR %)
Table 29 Mesenchymal Stem Cells Market Forecast by Indication, 2022-2032 (US$ million, AGR %, CAGR %)
Table 30 Disease Modelling Market Forecast by Region, 2022-2032 (US$ million, AGR %, CAGR %)
Table 31 Drug Development & Discovery Market Forecast by Region, 2022-2032 (US$ million, AGR %, CAGR %)
Table 32 Stem Cell Banking Market Forecast by Region, 2022-2032 (US$ million, AGR %, CAGR %)
Table 33 Tissue Engineering Market Forecast by Region, 2022-2032 (US$ million, AGR %, CAGR %)
Table 34 Toxicology Studies Market Forecast by Region, 2022-2032 (US$ million, AGR %, CAGR %)
Table 35 Others Market Forecast by Region, 2022-2032 (US$ million, AGR %, CAGR %)
Table 36 Mesenchymal Stem Cells Market by Region, 2022-2032 (US$ million, AGR (%), CAGR (%))
Table 37 North America Mesenchymal Stem Cells Market Forecast by Country, 2022-2032 (US$ million, AGR %, CAGR %)
Table 38 North America Mesenchymal Stem Cells Market Forecast by Type, 2022-2032 (US$ million, AGR %, CAGR %)
Table 39 North America Mesenchymal Stem Cells Market Forecast by Product, 2022-2032 (US$ million, AGR %, CAGR %)
Table 40 North America Mesenchymal Stem Cells Market Forecast by Source, 2022-2032 (US$ million, AGR %, CAGR %)
Table 41 North America Mesenchymal Stem Cell Market Forecast by Indication, 2022-2032 (US$ million, AGR %, CAGR %)
Table 42 North America Mesenchymal Stem Cell Market Forecast by Application, 2022-2032 (US$ million, AGR %, CAGR %)
Table 43 U.S. Mesenchymal Stem Cells Market Forecast, 2022-2032 (US$ million, AGR %, CAGR %)
Table 44 Canada Mesenchymal Stem Cells Market Forecast, 2022-2032 (US$ million, AGR %, CAGR %)
Table 45 Europe Mesenchymal Stem Cells Market by Country, 2022-2032 (US$ million, AGR (%), CAGR (%))
Table 46 Europe Mesenchymal Stem Cells Market Forecast by Type, 2022-2032 (US$ million, AGR %, CAGR %)
Table 47 Europe Mesenchymal Stem Cells Market Forecast by Product, 2022-2032 (US$ million, AGR %, CAGR %)
Table 48 Europe Mesenchymal Stem Cells Market Forecast by Source, 2022-2032 (US$ million, AGR %, CAGR %)
Table 49 Europe Mesenchymal Stem Cell Market Forecast by Indication, 2022-2032 (US$ million, AGR %, CAGR %)
Table 50 Europe Mesenchymal Stem Cell Market Forecast by Application, 2022-2032 (US$ million, AGR %, CAGR %)
Table 51 Germany Mesenchymal Stem Cells Market Forecast, 2022-2032 (US$ million, AGR %, CAGR %)
Table 52 France Mesenchymal Stem Cells Market Forecast, 2022-2032 (US$ million, AGR %, CAGR %)
Table 53 U.K. Mesenchymal Stem Cells Market Forecast, 2022-2032 (US$ million, AGR %, CAGR %)
Table 54 Italy Mesenchymal Stem Cells Market Forecast, 2022-2032 (US$ million, AGR %, CAGR %)
Table 55 Spain Mesenchymal Stem Cells Market Forecast, 2022-2032 (US$ million, AGR %, CAGR %)
Table 56 Rest of Europe Mesenchymal Stem Cells Market Forecast, 2022-2032 (US$ million, AGR %, CAGR %)
Table 57 Asia Pacific Mesenchymal Stem Cells Market by Country, 2022-2032 (US$ million, AGR (%), CAGR (%))
Table 58 Asia Pacific Mesenchymal Stem Cells Market Forecast by Type, 2022-2032 (US$ million, AGR %, CAGR %)
Table 59 Asia Pacific Mesenchymal Stem Cells Market Forecast by Product, 2022-2032 (US$ million, AGR %, CAGR %)
Table 60 Asia Pacific Mesenchymal Stem Cells Market Forecast by Source, 2022-2032 (US$ million, AGR %, CAGR %)
Table 61 Asia Pacific Mesenchymal Stem Cell Market Forecast by Indication, 2022-2032 (US$ million, AGR %, CAGR %)
Table 62 Asia Pacific Mesenchymal Stem Cell Market Forecast by Application, 2022-2032 (US$ million, AGR %, CAGR %)
Table 63 China Mesenchymal Stem Cells Market Forecast, 2022-2032 (US$ million, AGR %, CAGR %)
Table 64 Japan Mesenchymal Stem Cells Market Forecast, 2022-2032 (US$ million, AGR %, CAGR %)
Table 65 India Mesenchymal Stem Cells Market Forecast, 2022-2032 (US$ million, AGR %, CAGR %)
Table 66 Australia Mesenchymal Stem Cells Market Forecast, 2022-2032 (US$ million, AGR %, CAGR %)
Table 67 Rest of Asia Pacific Mesenchymal Stem Cells Market Forecast, 2022-2032 (US$ million, AGR %, CAGR %)
Table 68 Latin America Mesenchymal Stem Cells Market by Country, 2022-2032 (US$ million, AGR (%), CAGR (%))
Table 69 Latin America Mesenchymal Stem Cells Market Forecast by Type, 2022-2032 (US$ million, AGR %, CAGR %)
Table 70 Latin America Mesenchymal Stem Cells Market Forecast by Product, 2022-2032 (US$ million, AGR %, CAGR %)
Table 71 Latin America Mesenchymal Stem Cells Market Forecast by Source, 2022-2032 (US$ million, AGR %, CAGR %)
Table 72 Latin America Mesenchymal Stem Cell Market Forecast by Indication, 2022-2032 (US$ million, AGR %, CAGR %)
Table 73 Latin America Mesenchymal Stem Cell Market Forecast by Application, 2022-2032 (US$ million, AGR %, CAGR %)
Table 74 Brazil Mesenchymal Stem Cells Market Forecast, 2022-2032 (US$ million, AGR %, CAGR %)
Table 75 Mexico Mesenchymal Stem Cells Market Forecast, 2022-2032 (US$ million, AGR %, CAGR %)
Table 76 Argentina Mesenchymal Stem Cells Market Forecast, 2022-2032 (US$ million, AGR %, CAGR %)
Table 77 Rest of Latin America Mesenchymal Stem Cells Market Forecast, 2022-2032 (US$ million, AGR %, CAGR %)
Table 78 Middle East & Africa Mesenchymal Stem Cells Market by Country, 2022-2032 (US$ million, AGR (%), CAGR (%))
Table 79 Middle East & Africa Mesenchymal Stem Cells Market Forecast by Type, 2022-2032 (US$ million, AGR %, CAGR %)
Table 80 Middle East & Africa Mesenchymal Stem Cells Market Forecast by Product, 2022-2032 (US$ million, AGR %, CAGR %)
Table 81 Middle East & Africa Mesenchymal Stem Cells Market Forecast by Source, 2022-2032 (US$ million, AGR %, CAGR %)
Table 82 Middle East & Africa Mesenchymal Stem Cell Market Forecast by Indication, 2022-2032 (US$ million, AGR %, CAGR %)
Table 83 Middle East & Africa Mesenchymal Stem Cell Market Forecast by Application, 2022-2032 (US$ million, AGR %, CAGR %)
Table 84 Saudi Arabia Mesenchymal Stem Cells Market Forecast, 2022-2032 (US$ million, AGR %, CAGR %)
Table 85 South Africa Mesenchymal Stem Cells Market Forecast, 2022-2032 (US$ million, AGR %, CAGR %)
Table 86 Turkey Mesenchymal Stem Cells Market Forecast, 2022-2032 (US$ million, AGR %, CAGR %)
Table 87 Rest of Middle East & Africa Mesenchymal Stem Cells Market Forecast, 2022-2032 (US$ million, AGR %, CAGR %)
Table 88 Key Business Strategies Adopted by Key Players in Mesenchymal Stem Cells Market
Table 89 Thermo Fisher Scientific Inc.: Key Details, (CEO, HQ, Revenue, Founded, No. of Employees, Company Type, Website, Business Segment)
Table 90 Thermo Fisher Scientific Inc.: Product Benchmarking
Table 91 Thermo Fisher Scientific Inc.: Strategic Outlook
Table 92 Merck KGaA: Key Details, (CEO, HQ, Revenue, Founded, No. of Employees, Company Type, Website, Business Segment)
Table 93 Merck KGaA: Product Benchmarking
Table 94 Merck KGaA: Strategic Outlook
Table 95 STEMCELL Technologies Inc: Key Details, (CEO, HQ, Revenue, Founded, No. of Employees, Company Type, Website, Business Segment)
Table 96 STEMCELL Technologies: Product Benchmarking
Table 97 STEMCELL Technologies: Strategic Outlook
Table 98 Cytori Therapeutics Inc.: Key Details, (CEO, HQ, Revenue, Founded, No. of Employees, Company Type, Website, Business Segment)
Table 99 Cytori Therapeutics Inc: Product Benchmarking
Table 100 Cyagen Biosciences: Key Details, (CEO, HQ, Revenue, Founded, No. of Employees, Company Type, Website, Business Segment)
Table 101 Cyagen Biosciences: Product Benchmarking
Table 102 Cyagen Biosciences: Strategic Outlook
Table 103 PromoCell GmbH: Key Details, (CEO, HQ, Revenue, Founded, No. of Employees, Company Type, Website, Business Segment)
Table 104 PromoCell GmbH: Product Benchmarking
Table 105 Celprogen Inc.: Key Details, (CEO, HQ, Revenue, Founded, No. of Employees, Company Type, Website, Business Segment)
Table 106 Celprogen Inc: Product Benchmarking
Table 107 Stemedica Cell Technologies, Inc.: Key Details, (CEO, HQ, Revenue, Founded, No. of Employees, Company Type, Website, Business Segment)
Table 108 Stemedica Cell Technologies, Inc: Product Benchmarking
Table 109 Stemedica Cell Technologies, Inc: Strategic Outlook
Table 110 Cell Applications, Inc.: Key Details, (CEO, HQ, Revenue, Founded, No. of Employees, Company Type, Website, Business Segment)
Table 111 Cell Applications, Inc: Product Benchmarking
Table 112 Lonza: Key Details, (CEO, HQ, Revenue, Founded, No. of Employees, Company Type, Website, Business Segment)
Table 113 Lonza: Product Benchmarking
Table 114 Lonza: Strategic Outlook
Table 115 Celltex Therapeutics Corporation: Key Details, (CEO, HQ, Revenue, Founded, No. of Employees, Company Type, Website, Business Segment)
Table 116 Celltex Therapeutics Corporation: Product Benchmarking
Table 117 Celltex Therapeutics Corporation: Strategic Outlook
図の一覧
Figure 1 Mesenchymal Stem Cells Market Segmentation
Figure 2 Mesenchymal Stem Cells Market Forecast by Region: Market Attractiveness Index
Figure 3 Mesenchymal Stem Cells Market by Type: Market Attractiveness Index
Figure 4 Mesenchymal Stem Cells Market by Source: Market Attractiveness Index
Figure 5 Mesenchymal Stem Cells Market by Indication: Market Attractiveness Index
Figure 6 Mesenchymal Stem Cells Market by Application: Market Attractiveness Index
Figure 7 Mesenchymal Stem Cells Market: Market Dynamics
Figure 8 Mesenchymal Stem Cells Market, 2022-2032 Covid-19 Impact Analysis
Figure 9 Mesenchymal Stem Cells Market, 2022-2032 (US$ million, AGR (%), CAGR (%)): “V” Shaped Recovery
Figure 10 Mesenchymal Stem Cells Market, 2022-2032 (US$ million, AGR (%), CAGR (%)): “U” Shaped Recovery
Figure 11 Mesenchymal Stem Cells Market by Region, 2022-2032 (US$ million, AGR (%), CAGR (%)): “W” Shaped Recovery
Figure 12 Mesenchymal Stem Cells Market, 2022-2032 (US$ million, AGR (%), CAGR (%)): “L” Shaped Recovery
Figure 13 Mesenchymal Stem Cells Market: Porter’s Five Forces Analysis
Figure 14 Mesenchymal Stem Cells Market: PESTLE Analysis
Figure 15 Mesenchymal Stem Cells Market by Type Growth Prospects
Figure 16 Mesenchymal Stem Cells Market Forecast by Type, 2022-2032 (US$ million, AGR %)
Figure 17 Mesenchymal Stem Cells Market Share Forecast by Type, 2022, 2027, 2032 (%)
Figure 18 Products Market Forecast by Region, 2022-2032 (US$ million)
Figure 19 Products Market Share Forecast by Region, 2022 & 2032 (%)
Figure 20 Cell & Cell Lines Market Forecast by Region, 2022-2032 (US$ million)
Figure 21 Cell & Cell Lines Market Share Forecast by Region, 2022 & 2032 (%)
Figure 22 Kits, Media & Reagent Market Forecast by Region, 2022-2032 (US$ million)
Figure 23 Kits, Media & Reagent Market Share Forecast by Region, 2022 & 2032 (%)
Figure 24 Others Market Forecast by Region, 2022-2032 (US$ million)
Figure 25 Others Market Share Forecast by Region, 2022-2032 (%)
Figure 26 Services Market Forecast by Region, 2022-2032 (US$ million)
Figure 27 Services Market Share Forecast by Region, 2022 & 2032 (%)
Figure 28 Mesenchymal Stem Cells Market by Source Growth Prospects
Figure 29 Mesenchymal Stem Cells Market Forecast by Source, 2022-2032 (US$ million, AGR %)
Figure 30 Mesenchymal Stem Cells Market Share Forecast by Source, 2022, 2027, 2032 (%)
Figure 31 Bone Marrow Market Forecast by Region, 2022-2032 (US$ million)
Figure 32 Bone Marrow Market Share Forecast by Region, 2022 & 2032 (%)
Figure 33 Adipose Tissues Market Forecast by Region, 2022-2032 (US$ million)
Figure 34 Adipose Tissues Market Share Forecast by Region, 2022 & 2032 (%)
Figure 35 Cord Blood Market Forecast by Region, 2022-2032 (US$ million)
Figure 36 Cord Blood Market Share Forecast by Region, 2022 & 2032 (%)
Figure 37 Fetal Liver Market Forecast by Region, 2022-2032 (US$ million)
Figure 38 Fetal Liver Market Share Forecast by Region, 2022 & 2032 (%)
Figure 39 Lung Market Forecast by Region, 2022-2032 (US$ million)
Figure 40 Lung Market Share Forecast by Region, 2022 & 2032 (%)
Figure 41 Peripheral Blood Market Forecast by Region, 2022-2032 (US$ million)
Figure 42 Peripheral Blood Market Share Forecast by Region, 2022 & 2032 (%)
Figure 43 Fallopian Tube Market Forecast by Region, 2022-2032 (US$ million)
Figure 44 Fallopian Tube Market Share Forecast by Region, 2022 & 2032 (%)
Figure 45 Others Market Forecast by Region, 2022-2032 (US$ million)
Figure 46 Bone Marrow Market Share Forecast by Region, 2022-2032 (%)
Figure 47 Mesenchymal Stem Cells Market by Indication Growth Prospects
Figure 48 Mesenchymal Stem Cells Market Forecast by Indication, 2022-2032 (US$ million, AGR %)
Figure 49 Mesenchymal Stem Cells Market Share Forecast by Indication, 2022, 2027, 2032 (%)
Figure 50 Bone And Cartilage Repair Market Forecast by Region, 2022-2032 (US$ million)
Figure 51 Bone And Cartilage Repair Market Share Forecast by Region, 2022 & 2032 (%)
Figure 52 Cardiovascular Diseases Market Forecast by Region, 2022-2032 (US$ million)
Figure 53 Cardiovascular Diseases Market Share Forecast by Region, 2022-2032 (%)
Figure 54 Cancer Market Forecast by Region, 2022 & 2032 (US$ million)
Figure 55 Cancer Market Share Forecast by Region, 2022 & 2032 (%)
Figure 56 GvHD Market Forecast by Region, 2022-2032 (US$ million)
Figure 57 GvHD Market Share Forecast by Region, 2022 & 2032 (%)
Figure 58 Inflammatory And Immunological Diseases Market Forecast by Region, 2022-2032 (US$ million)
Figure 59 Inflammatory And Immunological Diseases Market Share Forecast by Region, 2022 & 2032 (%)
Figure 60 Liver Diseases Market Forecast by Region, 2022-2032 (US$ million)
Figure 61 Liver Diseases Market Share Forecast by Region, 2022 & 2032 (%)
Figure 62 Others Market Forecast by Region, 2022-2032 (US$ million)
Figure 63 Others Market Share Forecast by Region, 2022 & 2032 (%)
Figure 64 Mesenchymal Stem Cells Market by Application Growth Prospects
Figure 65 Mesenchymal Stem Cells Market Forecast by Application, 2022-2032 (US$ million, AGR %)
Figure 66 Mesenchymal Stem Cells Market Share Forecast by Application, 2022, 2027, 2032 (%)
Figure 67 Disease Modelling Market Forecast by Region, 2022-2032 (US$ million)
Figure 68 Disease Modelling Repair Market Share Forecast by Region, 2022 & 2032 (%)
Figure 69 Drug Discovery & Development Market Forecast by Region, 2022-2032 (US$ million)
Figure 70 Drug Development & Discovery Market Share Forecast by Region, 2022-2032 (%)
Figure 71 Stem Cell Banking Market Forecast by Region, 2022-2032 (US$ million)
Figure 72 Stem Cell Banking Market Share Forecast by Region, 2022 & 2032 (%)
Figure 73 Tissue Engineering Market Forecast by Region, 2022-2032 (US$ million)
Figure 74 Tissue Engineering Market Share Forecast by Region, 2022 & 2032 (%)
Figure 75 Toxicology Studies Market Forecast by Region, 2022-2032 (US$ million)
Figure 76 Toxicology Studies Market Share Forecast by Region, 2022 & 2032 (%)
Figure 77 Others Market Forecast by Region, 2022-2032 (US$ million)
Figure 78 Others Market Share Forecast by Region, 2022-2032 (%)
Figure 79 Mesenchymal Stem Cells Market Forecast by Region 2022, 2027, 2032 (Revenue, CAGR%)
Figure 80 Mesenchymal Stem Cells Market Share Forecast by Region 2022, 2027, 2032(%)
Figure 81 Mesenchymal Stem Cells Market by Region, 2022-2032 (US$ million, AGR (%))
Figure 82 North America Mesenchymal Stem Cells Market Attractiveness Index
Figure 83 North America Mesenchymal Stem Cells Market by Region, 2022, 2027 & 2032 (US$ million)
Figure 84 North America Mesenchymal Stem Cells Market Forecast by Country, 2022-2032 (US$ million)
Figure 85 North America Mesenchymal Stem Cells Market Share Forecast by Country, 2022 & 2032 (%)
Figure 86 North America Mesenchymal Stem Cells Market Forecast by Type, 2022-2032 (US$ million)
Figure 87 North America Mesenchymal Stem Cells Market Share Forecast by Type, 2022 & 2032 (%)
Figure 88 North America Mesenchymal Stem Cells Market Forecast by Product, 2022-2032 (US$ million)
Figure 89 North America Mesenchymal Stem Cells Market Share Forecast by Product, 2022 & 2032 (%)
Figure 90 North America Mesenchymal Stem Cells Market Forecast by Technology, 2022-2032 (US$ million)
Figure 91 North America Mesenchymal Stem Cells Market Share Forecast by Source, 2022 & 2032 (%)
Figure 92 North America Mesenchymal Stem Cells Market Forecast by Indication, 2022-2032 (US$ million)
Figure 93 North America Mesenchymal Stem Cells Market Share Forecast by Indication, 2022 & 2032 (%)
Figure 94 North America Mesenchymal Stem Cells Market Forecast by Application, 2022-2032 (US$ million)
Figure 95 North America Mesenchymal Stem Cells Market Share Forecast by Application, 2022 & 2032 (%)
Figure 96 U.S. Mesenchymal Stem Cells Market Forecast, 2022-2032 (US$ million, AGR %)
Figure 97 Canada Mesenchymal Stem Cells Market Forecast, 2022-2032 (US$ million, AGR %)
Figure 98 Europe Mesenchymal Stem Cells Market Attractiveness Index
Figure 99 Europe Mesenchymal Stem Cells Market by Region, 2022, 2027 & 2032 (US$ million)
Figure 100 Europe Mesenchymal Stem Cells Market Forecast by Country, 2022-2032 (US$ million)
Figure 101 Europe Mesenchymal Stem Cells Market Share Forecast by Country, 2022 & 2032 (%)
Figure 102 Europe Mesenchymal Stem Cells Market Forecast by Type, 2022-2032 (US$ million)
Figure 103 Europe Mesenchymal Stem Cells Market Share Forecast by Type, 2022 & 2032 (%)
Figure 104 Europe Mesenchymal Stem Cells Market Forecast by Product, 2022-2032 (US$ million)
Figure 105 Europe Mesenchymal Stem Cells Market Share Forecast by Product, 2022 & 2032 (%)
Figure 106 Europe Mesenchymal Stem Cells Market Forecast by Source, 2022-2032 (US$ million)
Figure 107 Europe Mesenchymal Stem Cells Market Share Forecast by Source, 2022 & 2032 (%)
Figure 108 Europe Mesenchymal Stem Cells Market Forecast by Indication, 2022-2032 (US$ million)
Figure 109 Europe Mesenchymal Stem Cells Market Share Forecast by Indication, 2022 & 2032 (%)
Figure 110 Europe Mesenchymal Stem Cells Market Forecast by Application, 2022-2032 (US$ million)
Figure 111 Europe Mesenchymal Stem Cells Market Share Forecast by Application, 2022 & 2032 (%)
Figure 112 Germany Mesenchymal Stem Cells Market Forecast, 2022-2032 (US$ million, AGR %)
Figure 113 France Mesenchymal Stem Cells Market Forecast, 2022-2032 (US$ million, AGR %)
Figure 114 U.K. Mesenchymal Stem Cells Market Forecast, 2022-2032 (US$ million, AGR %)
Figure 115 Italy Mesenchymal Stem Cells Market Forecast, 2022-2032 (US$ million, AGR %)
Figure 116 Spain Mesenchymal Stem Cells Market Forecast, 2022-2032 (US$ million, AGR %)
Figure 117 Rest of Europe Mesenchymal Stem Cells Market Forecast, 2022-2032 (US$ million, AGR %)
Figure 118 Asia Pacific Mesenchymal Stem Cells Market Attractiveness Index
Figure 119 Asia Pacific Mesenchymal Stem Cells Market by Region, 2022, 2027 & 2032 (US$ million)
Figure 120 Asia Pacific Mesenchymal Stem Cells Market Forecast by Country, 2022-2032 (US$ million)
Figure 121 Asia Pacific Mesenchymal Stem Cells Market Share Forecast by Country, 2022 & 2032 (%)
Figure 122 Asia Pacific Mesenchymal Stem Cells Market Forecast by Type, 2022-2032 (US$ million)
Figure 123 Asia Pacific Mesenchymal Stem Cells Market Share Forecast by Type, 2022 & 2032 (%)
Figure 124 Asia Pacific Mesenchymal Stem Cells Market Forecast by Product, 2022-2032 (US$ million)
Figure 125 Asia Pacific Mesenchymal Stem Cells Market Share Forecast by Product, 2022 & 2032 (%)
Figure 126 Asia Pacific Mesenchymal Stem Cells Market Forecast by Source, 2022-2032 (US$ million)
Figure 127 Asia Pacific Mesenchymal Stem Cells Market Share Forecast by Source, 2022 & 2032 (%)
Figure 128 Asia Pacific Mesenchymal Stem Cells Market Forecast by Indication, 2022-2032 (US$ million)
Figure 129 Asia Pacific Mesenchymal Stem Cells Market Share Forecast by Indication, 2022 & 2032 (%)
Figure 130 Asia Pacific Mesenchymal Stem Cells Market Forecast by Application, 2022-2032 (US$ million)
Figure 131 Asia Pacific Mesenchymal Stem Cells Market Share Forecast by Application, 2022 & 2032 (%)
Figure 132 China Mesenchymal Stem Cells Market Forecast, 2022-2032 (US$ million, AGR %)
Figure 133 Japan Mesenchymal Stem Cells Market Forecast, 2022-2032 (US$ million, AGR %)
Figure 134 India Mesenchymal Stem Cells Market Forecast, 2022-2032 (US$ million, AGR %)
Figure 135 Australia Mesenchymal Stem Cells Market Forecast, 2022-2032 (US$ million, AGR %)
Figure 136 Rest of Asia Pacific Mesenchymal Stem Cells Market Forecast, 2022-2032 (US$ million, AGR %)
Figure 137 Latin America Mesenchymal Stem Cells Market Attractiveness Index
Figure 138 Latin America Mesenchymal Stem Cells Market by Region, 2022, 2027 & 2032 (US$ million)
Figure 139 Latin America Mesenchymal Stem Cells Market Forecast by Country, 2022-2032 (US$ million)
Figure 140 Latin America Mesenchymal Stem Cells Market Share Forecast by Country, 2022 & 2032 (%)
Figure 141 Asia Pacific Mesenchymal Stem Cells Market Forecast by Type, 2022-2032 (US$ million)
Figure 142 Latin America Mesenchymal Stem Cells Market Share Forecast by Type, 2022 & 2032 (%)
Figure 143 Latin America Mesenchymal Stem Cells Market Forecast by Product, 2022-2032 (US$ million)
Figure 144 Latin America Mesenchymal Stem Cells Market Share Forecast by Product, 2022 & 2032 (%)
Figure 145 Latin America Mesenchymal Stem Cells Market Forecast by Source, 2022-2032 (US$ million)
Figure 146 Latin America Mesenchymal Stem Cells Market Share Forecast by Source, 2022 & 2032 (%)
Figure 147 Latin America Mesenchymal Stem Cells Market Forecast by Indication, 2022-2032 (US$ million)
Figure 148 Latin America Mesenchymal Stem Cells Market Share Forecast by Indication, 2022 & 2032 (%)
Figure 149 Latin America Mesenchymal Stem Cells Market Forecast by Application, 2022-2032 (US$ million)
Figure 150 Latin America Mesenchymal Stem Cells Market Share Forecast by Application, 2022 & 2032 (%)
Figure 151 Brazil Mesenchymal Stem Cells Market Forecast, 2022-2032 (US$ million, AGR %)
Figure 152 Mexico Mesenchymal Stem Cells Market Forecast, 2022-2032 (US$ million, AGR %)
Figure 153 Argentina Mesenchymal Stem Cells Market Forecast, 2022-2032 (US$ million, AGR %)
Figure 154 Rest of Latin America Mesenchymal Stem Cells Market Forecast, 2022-2032 (US$ million, AGR %)
Figure 155 Middle East & Africa Mesenchymal Stem Cells Market Attractiveness Index
Figure 156 Middle East & Africa Mesenchymal Stem Cells Market by Region, 2022, 2027 & 2032 (US$ million)
Figure 157 Middle East & Africa Mesenchymal Stem Cells Market Forecast by Country, 2022-2032 (US$ million)
Figure 158 Middle East & Africa Mesenchymal Stem Cells Market Share Forecast by Country, 2022 & 2032 (%)
Figure 159 Asia Pacific Mesenchymal Stem Cells Market Forecast by Type, 2022-2032 (US$ million)
Figure 160 Middle East & Africa Mesenchymal Stem Cells Market Share Forecast by Type, 2022 & 2032 (%)
Figure 161 Middle East & Africa Mesenchymal Stem Cells Market Forecast by Product, 2022-2032 (US$ million)
Figure 162 Middle East & Africa Mesenchymal Stem Cells Market Share Forecast by Product, 2022 & 2032 (%)
Figure 163 Middle East & Africa Mesenchymal Stem Cells Market Forecast by Source, 2022-2032 (US$ million)
Figure 164 Middle East & Africa Mesenchymal Stem Cells Market Share Forecast by Source, 2022 & 2032 (%)
Figure 165 Middle East & Africa Mesenchymal Stem Cells Market Forecast by Indication, 2022-2032 (US$ million)
Figure 166 Middle East & Africa Mesenchymal Stem Cells Market Share Forecast by Indication, 2022 & 2032 (%)
Figure 167 Middle East & Africa Mesenchymal Stem Cells Market Forecast by Application, 2022-2032 (US$ million)
Figure 168 Middle East & Africa Mesenchymal Stem Cells Market Share Forecast by Application, 2022 & 2032 (%)
Figure 169 Saudi Arabia Mesenchymal Stem Cells Market Forecast, 2022-2032 (US$ million, AGR %)
Figure 170 South Africa Mesenchymal Stem Cells Market Forecast, 2022-2032 (US$ million, AGR %)
Figure 171 Turkey Mesenchymal Stem Cells Market Forecast, 2022-2032 (US$ million, AGR %)
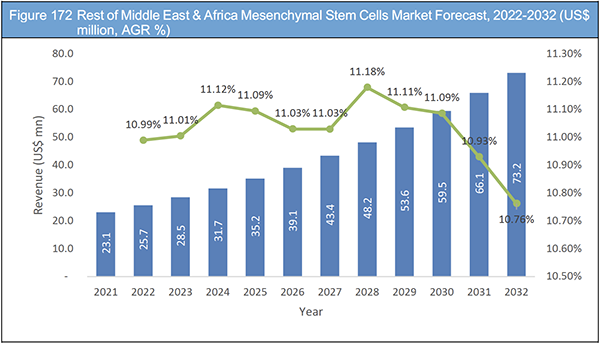
Figure 172 Rest of Middle East & Africa Mesenchymal Stem Cells Market Forecast, 2022-2032 (US$ million, AGR %)
Figure 173 Mesenchymal Stem Cells Market: Company Share Analysis, 2021
Figure 174 Thermo Fisher Scientific Inc.: Net Revenue, 2016-2021 (US$ million, AGR%)
Figure 175 Thermo Fisher Scientific Inc.: Regional Market Shares, 2021
Figure 176 Thermo Fisher Scientific Inc.: Gross Profit, 2016-2021 (US$ million, AGR%)
Figure 177 Thermo Fisher Scientific Inc.: R&D, 2016-2021 (US$ million, AGR%)
Figure 178 Merck KGaA: Net Revenue, 2016-2021 (US$ million, AGR%)
Figure 179 Merck KGaA: Regional Market Shares, 2021
Figure 180 Merck KGaA: Gross Profit, 2016-2021 (US$ million, AGR%)
Figure 181 Merck KGaA: R&D, 2016-2021 (US$ million, AGR%)
Figure 182 Lonza: Net Revenue, 2016-2021 (US$ million, AGR%)
Figure 183 Lonza: Regional Market Shares, 2021
Figure 184 Lonza: Gross Profit, 2016-2021 (US$ million, AGR%)
ページTOPに戻る
Summary
この調査レポートは世界の間葉系幹細胞市場を調査し、タイプ別、ソース別、適応症別、用途別、地域別に2022年から2032年までの予測結果を掲載しています。また関連企業情報を提供しています。
主な掲載内容(目次より抜粋)
-
レポート概要
-
エグゼクティブサマリー
-
市場概要
-
間葉系幹細胞市場分析:タイプ別
-
間葉系幹細胞市場分析:ソース別
-
間葉系幹細胞市場分析:適応症別
-
間葉系幹細胞市場分析:用途別
-
間葉系幹細胞市場分析:地域別
-
北米の間葉系幹細胞市場分析
-
欧州の間葉系幹細胞市場分析
-
アジア太平洋地域の間葉系幹細胞市場分析
-
ラテンアメリカの間葉系幹細胞市場分析
-
中東・アフリカの間葉系幹細胞市場分析
-
主要企業のプロフィール
Report Details
The Mesenchymal Stem Cells Market Report 2022-2032: This report will prove invaluable to leading firms striving for new revenue pockets if they wish to better understand the industry and its underlying dynamics. It will be useful for companies that would like to expand into different industries or to expand their existing operations in a new region.
Factors Such As Application In Various Therapy Areas and Rising Number of Clinical Trials are Driving the Market Growth
Some of the major factors propelling the mesenchymal stem cells market include wide application of Mesenchymal stem cells in a range of fields, including haematological disease, graft-versus-host disease, organ transplantation, diabetes, inflammatory diseases, and diseases in the liver, kidney, and lung, as well as cardiovascular, bone and cartilage, neurological, and autoimmune diseases. Increasing number of clinical trials in mesenchymal stem cell-based therapies is one of the major factors driving the market. The number of new reported phase I and II MSC clinical trials have expanded consistently over the past fifteen years and Increasing investment and funding for mesenchymal stem cell research and rising incidence of orthopaedic disorder and increase in cancer incidences are anticipated to support the global market growth
Challenges in Technology Transfer and Limited Expansion of Mesenchymal Stem Cells
Transferring of MSCs from bench to bedside is theoretically highly attainable, however, many failures have been reported in clinical trials, resulting in FDA rejection. Heterogeneity of MSCs from donors arise due to factors such as age, gender, genetic makeup and medical health condition. It has been also observed that there is difference in the differentiation capacities and the degree of stemness between mesenchymal stem cells isolated from different sources such as adipose tissue, bone marrow, muscles and umbilical cord. Inconsistency in further expansion capacities such as culture conditions, flasks / bioreactors passage number, oxygen levels, and cell surface modifications. Moreover MSCs also have the ability to differentiate into various cell types such as hepatocyte, neural cells and pancreatic islet cells. Hence, there are fair chances that in vitro induction of MSCs would not yield pure competent cells needed for the treatment of the disease.
What Questions Should You Ask before Buying a Market Research Report?
• How is the mesenchymal stem cells market evolving?
• What is driving and restraining the mesenchymal stem cells market?
• How will each mesenchymal stem cells submarket segment grow over the forecast period and how much revenue will these submarkets account for in 2032?
• How will the market shares for each mesenchymal stem cells submarket develop from 2022 to 2032?
• What will be the main driver for the overall market from 2022 to 2032?
• Will leading mesenchymal stem cells markets broadly follow the macroeconomic dynamics, or will individual national markets outperform others?
• How will the market shares of the national markets change by 2032 and which geographical region will lead the market in 2032?
• Who are the leading players and what are their prospects over the forecast period?
• What are the mesenchymal stem cells projects for these leading companies?
• How will the industry evolve during the period between 2022 and 2032? What are the implications of mesenchymal stem cells projects taking place now and over the next 10 years?
• Is there a greater need for product commercialisation to further scale the mesenchymal stem cells market?
• Where is the mesenchymal stem cells market heading and how can you ensure you are at the forefront of the market?
• What are the best investment options for new product and service lines?
• What are the key prospects for moving companies into a new growth path and C-suite?
You need to discover how this will impact the mesenchymal stem cells market today, and over the next 10 years:
• Our 282-page report provides 117 tables and 184 charts/graphs exclusively to you.
• The report highlights key lucrative areas in the industry so you can target them – NOW.
• It contains in-depth analysis of global, regional and national sales and growth.
• It highlights for you the key successful trends, changes and revenue projections made by your competitors.
This report tells you TODAY how the Mesenchymal Stem Cells market will develop in the next 10 years, and in line with the variations in COVID-19 economic recession and bounce. This market is more critical now than at any point over the last 10 years.
The report delivers exclusive COVID-19 variations and economic data specific to your market.
Forecasts to 2032 and other analyses reveal commercial prospects
• In addition to revenue forecasting to 2032, our new study provides you with recent results, growth rates, and market shares.
• You will find original analyses, with business outlooks and developments.
• Discover qualitative analyses (including market dynamics, drivers, opportunities, restraints and challenges), cost structure, impact of rising investment in mesenchymal stem cells and recent developments.
This report includes data analysis and invaluable insight into how COVID-19 will affect the industry and your company. Four COVID-19 recovery patterns and their impact, namely, “V”, “L”, “W” and “U” are discussed in this report.
Segments Covered in the Report
Type
• Products
– Cell & Cell Lines
– Kits Media & Reagents
– Others
• Service
Source
• Bone marrow
• Adipose Tissue
• Cord Blood
• Fetal Liver
• Lung
• Peripheral Blood
• Fallopian Tube
• Other Sources
Indication
• Bone & cartilage Repair
• Cardiovascular Disease
• Cancer
• GvHD
• Inflammatory & Immunological Diseases
• Liver Diseases
• Other Indication
Application
• Disease Modelling
• Drug Discovery & Development
• Stemcell Banking
• Tissue Engineering
• Toxicology Studies
• Others
In addition to the revenue predictions for the overall world market and segments, you will also find revenue forecasts for five regional and 17 leading national markets:
North America
• U.S.
• Canada
Europe
• Germany
• UK
• France
• Spain
• Italy
• Rest of Europe
Asia Pacific
• China
• Japan
• India
• Australia
• Rest of Asia Pacific
Latin America
• Brazil
• Mexico
• Argentina
• Rest of Latin America
MEA
• Saudi Arabia
• South Africa
• Turkey
• Rest of MEA
The report also includes profiles and for some of the leading companies in the Mesenchymal Stem Cells Market, 2022 to 2032, with a focus on this segment of these companies’ operations.
Leading companies and the potential for market growth
• Cell Application Inc.
• Celltex Therapeutics Corporation.
• Celprogen Inc.
• Cyagen Biosciences
• Cytori Therapeutics Inc. (Plus Therapeutics Inc.)
• Lonza
• Merck KGaA (Millipore Sigma)
• PromoCell GmbH
• STEMCELL Technologies Inc.
• Stemedica Cell Technologies Inc.
• Thermo Fischer Scientific Inc.
Overall global revenue for Mesenchymal Stem Cells Market, 2022 to 2032 in terms of value the market will surpass US$2.75 billion in 2022, our work calculates. We predict strong revenue growth through to 2032. Our work identifies which organizations hold the greatest potential. Discover their capabilities, progress, and commercial prospects, helping you stay ahead.
How will the Mesenchymal Stem Cells Market, 2022 to 2032 report help you?
In summary, our 280+ page report provides you with the following knowledge:
• Revenue forecasts to 2032 for Mesenchymal Stem Cells Market, 2022 to 2032 Market, with forecasts for Type, Source, Indication and Application, each forecast at a global and regional level – discover the industry’s prospects, finding the most lucrative places for investments and revenues.
• Revenue forecasts to 2032 for five regional and 17 key national markets – See forecasts for the Mesenchymal Stem Cells Market, 2022 to 2032 market in North America, Europe, Asia-Pacific and LATAM and MEA. Also forecasted is the market in the US, Canada, Mexico, Brazil, Germany, France, UK, Italy, China, India, Japan, and Australia among other prominent economies.
• Prospects for established firms and those seeking to enter the market – including company profiles for 11 of the major companies involved in the Mesenchymal Stem Cells Market, 2022 to 2032.
Find quantitative and qualitative analyses with independent predictions. Receive information that only our report contains, staying informed with invaluable business intelligence.
Information found nowhere else
With our new report, you are less likely to fall behind in knowledge or miss out on opportunities. See how our work could benefit your research, analyses, and decisions. Visiongain’s study is for everybody needing commercial analyses for the Mesenchymal Stem Cells Market, 2022 to 2032, market-leading companies. You will find data, trends and predictions.
ページTOPに戻る
Table of Contents
Table of Contents
1. Report Overview
1.1 Objectives of the Study
1.2 Introduction to Mesenchymal Stem Cells Market
1.3 What This Report Delivers
1.4 Why You Should Read This Report
1.5 Key Questions Answered By This Analytical Report Include:
1.6 Who is This Report For?
1.7 Methodology
1.7.1 Market Definitions
1.7.2 Market Evaluation & Forecasting Methodology
1.7.3 Data Validation
1.8 Frequently Asked Questions (FAQs)
1.9 Associated Visiongain Reports
1.10 About Visiongain
2 Executive Summary
3 Market Overview
3.1 Key Findings
3.2 Market Dynamics
3.2.1 Market Driving Factors
3.2.2 Market Restraining Factors
3.2.3 Market Opportunities
3.3 COVID-19 Impact Analysis
3.4 Porter’s Five Forces Analysis
3.4.1 Supplier Power
3.4.2 Buyer Power
3.4.3 Competitive Rivalry
3.4.4 Threat from Substitutes
3.4.5 Threat of New Entrants
3.5 PESTLE Analysis
4 Mesenchymal Stem Cells Market Analysis by Type
4.1 Key Findings
4.2 Type Segment Growth Prospects
4.3 Mesenchymal Stem Cells Market Size Estimation and Forecast by Type
4.4 Products
4.4.1 Market Forecast by Region, 2022-2032 (US$ Mn)
4.4.2 Market Share by Region, 2022 & 2032 (%)
4.5 Cell & Cell Lines
4.5.1 Market Forecast by Region, 2022-2032 (US$ Mn)
4.5.2 Market Share by Region, 2022-2032 (%)
4.6 Kits, Media & Reagents
4.6.1 Market Forecast by Region, 2022-2032 (US$ Mn)
4.6.2 Market Share by Region, 2022-2032 (%)
4.7 Others
4.7.1 Market Forecast by Region, 2022-2032 (US$ Mn)
4.7.2 Market Share by Region, 2022-2032 (%)
4.8 Services
4.8.1 Market Forecast by Region, 2022-2032 (US$ Mn)
4.8.2 Market Share by Region, 2022-2032 (%)
5 Mesenchymal Stem Cells Market Analysis by Source
5.1 Key Findings
5.2 Source Segment Growth Prospects
5.3 Mesenchymal Stem Cells Market Size Estimation and Forecast by Source
5.4 Bone Marrow
5.4.1 Market Forecast by Region, 2022-2032 (US$ Mn)
5.4.2 Market Share by Region, 2022 & 2032 (%)
5.5 Adipose Tissues
5.5.1 Market Forecast by Region, 2022-2032 (US$ Mn)
5.5.2 Market Share by Region, 2022 & 2032 (%)
5.6 Cord Blood
5.6.1 Market Forecast by Region, 2022-2032 (US$ Mn)
5.6.2 Market Share by Region, 2022 & 2032 (%)
5.7 Fetal Liver
5.7.1 Market Forecast by Region, 2022-2032 (US$ Mn)
5.7.2 Market Share by Region, 2022 & 2032 (%)
5.8 Lung
5.8.1 Market Forecast by Region, 2022-2032 (US$ Mn)
5.8.2 Market Share by Region, 2022 & 2032 (%)
5.9 Peripheral Blood
5.9.1 Market Forecast by Region, 2022-2032 (US$ Mn)
5.9.2 Market Share by Region, 2022 & 2032 (%)
5.10 Fallopian Tube
5.10.1 Market Forecast by Region, 2022-2032 (US$ Mn)
5.10.2 Market Share by Region, 2022 & 2032 (%)
5.11 Others
5.11.1 Market Forecast by Region, 2022-2032 (US$ Mn)
5.11.2 Market Share by Region, 2022-2032 (%)
6 Mesenchymal Stem Cells Market Analysis by Indication
6.1 Key Findings
6.2 Indication Segment Growth Prospects
6.3 Mesenchymal Stem Cells Market Size Estimation and Forecast by Indication
6.4 Bone And Cartilage Repair
6.4.1 Market Forecast by Region, 2022-2032 (US$ Mn)
6.4.2 Market Share by Region, 2022&2032 (%)
6.5 Cardiovascular Diseases
6.5.1 Market Forecast by Region, 2022-2032 (US$ Mn)
6.5.2 Market Share by Region, 2022-2032 (%)
6.6 Cancer
6.6.1 Market Forecast by Region, 2022-2032 (US$ Mn)
6.6.2 Market Share by Region, 2022 & 2032 (%)
6.7 GvHD
6.7.1 Market Forecast by Region, 2022-2032 (US$ Mn)
6.7.2 Market Share by Region, 2022 & 2032 (%)
6.8 Inflammatory And Immunological Diseases
6.8.1 Market Forecast by Region, 2022-2032 (US$ Mn)
6.8.2 Market Share by Region, 2022 & 2032 (%)
6.9 Liver Diseases
6.9.1 Market Forecast by Region, 2022-2032 (US$ Mn)
6.9.2 Market Share by Region, 2022 & 2032 (%)
6.10 Others
6.10.1 Market Forecast by Region, 2022-2032 (US$ Mn)
6.10.2 Market Share by Region, 2022 & 2032 (%)
7 Mesenchymal Stem Cells Market Analysis by Application
7.1 Key Findings
7.2 Application Segment Growth Prospects
7.3 Mesenchymal Stem Cells Market Size Estimation and Forecast by Application
7.4 Disease Modelling
7.4.1 Market Forecast by Region, 2022-2032 (US$ Mn)
7.4.2 Market Share by Region, 2022 & 2032 (%)
7.5 Drug Discovery & Development
7.5.1 Market Forecast by Region, 2022-2032 (US$ Mn)
7.5.2 Market Share by Region, 2022-2032 (%)
7.6 Stem Cell Banking
7.6.1 Market Forecast by Region, 2022-2032 (US$ Mn)
7.6.2 Market Share by Region, 2022 & 2032 (%)
7.7 Tissue Engineering
7.7.1 Market Forecast by Region, 2022-2032 (US$ Mn)
7.7.2 Market Share by Region, 2022 & 2032 (%)
7.8 Toxicology Studies
7.8.1 Market Forecast by Region, 2022-2032 (US$ Mn)
7.8.2 Market Share by Region, 2022 & 2032 (%)
7.9 Others
7.9.1 Market Forecast by Region, 2022-2032 (US$ Mn)
7.9.2 Market Share by Region, 2022-2032 (%)
8 Mesenchymal Stem Cells Market Analysis by Region
8.1 Key Findings
8.2 Regional Market Size Estimation and Forecast
9 North America Mesenchymal Stem Cells Market Analysis
9.1 Key Findings
9.2 North America Mesenchymal Stem Cells Market Attractiveness Index
9.3 Market Size by Country, 2022, 2027 & 2032 (US$ Mn)
9.4 Market Size Estimation and Forecast by Country, 2022-2032 (US$ Mn)
9.5 Market Size Estimation and Forecast by Type, 2022-2032 (US$ Mn)
9.5.1 Market Size by Products, 2022-2032 (US$ Mn)
9.6 Market Size Estimation and Forecast by Source, 2022-2032 (US$ Mn)
9.7 Market Size Estimation and Forecast by Indication, 2022-2032 (US$ Mn)
9.8 Market Size Estimation and Forecast by Application, 2022-2032 (US$ Mn)
9.9 U.S.
9.10 Canada
10 Europe Mesenchymal Stem Cells Market Analysis
10.1 Key Findings
10.2 Europe Mesenchymal Stem Cells Market Attractiveness Index
10.3 Market Size by Country, 2022, 2027 & 2032 (US$ Mn)
10.4 Market Size Estimation and Forecast by Country, 2022-2032 (US$ Mn)
10.5 Market Size Estimation and Forecast by Type, 2022-2032 (US$ Mn)
10.5.1 Market Size by Products, 2022-2032 (US$ Mn)
10.6 Market Size Estimation and Forecast by Source, 2022-2032 (US$ Mn)
10.7 Market Size Estimation and Forecast by Indication, 2022-2032 (US$ Mn)
10.8 Market Size Estimation and Forecast by Application, 2022-2032 (US$ Mn)
10.9 Germany
10.10 France
10.11 U.K.
10.12 Italy
10.13 Spain
10.14 Rest of Europe
11 Asia Pacific Mesenchymal Stem Cells Market Analysis
11.1 Key Findings
11.2 Asia Pacific Mesenchymal Stem Cells Market Attractiveness Index
11.3 Market Size by Country, 2022, 2027 & 2032 (US$ Mn)
11.4 Market Size Estimation and Forecast by Country, 2022-2032 (US$ Mn)
11.5 Market Size Estimation and Forecast by Type, 2022-2032 (US$ Mn)
11.5.1 Market Size by Products, 2022-2032 (US$ Mn)
11.6 Market Size Estimation and Forecast by Source, 2022-2032 (US$ Mn)
11.7 Market Size Estimation and Forecast by Indication, 2022-2032 (US$ Mn)
11.8 Market Size Estimation and Forecast by Application, 2022-2032 (US$ Mn)
11.9 China
11.10 Japan
11.11 India
11.12 Australia
11.13 Rest of Asia Pacific
12 Latin America Mesenchymal Stem Cells Market Analysis
12.1 Key Findings
12.2 Latin America Mesenchymal Stem Cells Market Attractiveness Index
12.3 Market Size by Country, 2022, 2027 & 2032 (US$ Mn)
12.4 Market Size Estimation and Forecast by Country, 2022-2032 (US$ Mn)
12.5 Market Size Estimation and Forecast by Type, 2022-2032 (US$ Mn)
12.5.1 Market Size by Products, 2022-2032 (US$ Mn)
12.6 Market Size Estimation and Forecast by Source, 2022-2032 (US$ Mn)
12.7 Market Size Estimation and Forecast by Indication, 2022-2032 (US$ Mn)
12.8 Market Size Estimation and Forecast by Application, 2022-2032 (US$ Mn)
12.9 Brazil
12.10 Mexico
12.11 Argentina
12.12 Rest of Latin America
13 Middle East & Africa Mesenchymal Stem Cells Market Analysis
13.1 Key Findings
13.2 Middle East & Africa Mesenchymal Stem Cells Market Attractiveness Index
13.3 Market Size by Country, 2022, 2027 & 2032 (US$ Mn)
13.4 Market Size Estimation and Forecast by Country, 2022-2032 (US$ Mn)
13.5 Market Size Estimation and Forecast by Type, 2022-2032 (US$ Mn)
13.5.1 Market Size by Products, 2022-2032 (US$ Mn)
13.6 Market Size Estimation and Forecast by Source, 2022-2032 (US$ Mn)
13.7 Market Size Estimation and Forecast by Indication, 2022-2032 (US$ Mn)
13.8 Market Size Estimation and Forecast by Application, 2022-2032 (US$ Mn)
13.9 Saudi Arabia
13.10 South Africa
13.11 Turkey
13.12 Rest of Middle East & Africa
14 Company Profiles
14.1 Company Share Analysis
14.2 Key Business Strategy Analysis
14.3 Thermo Fisher Scientific Inc.
14.3.1 Company Snapshot
14.3.2 Company Overview
14.3.3 Financial Analysis
14.3.4 Product Benchmarking
14.3.5 Strategic Outlook
14.4 Merck KGaA (Millipore Sigma)
14.4.1 Company Snapshot
14.4.2 Company Overview
14.4.3 Financial Analysis
14.4.4 Product Benchmarking
14.4.5 Strategic Outlook
14.5 STEMCELL Technologies Inc.
14.5.1 Company Snapshot
14.5.2 Company Overview
14.5.3 Product Benchmarking
14.5.4 Strategic Outlook
14.6 Cytori Therapeutics Inc. (Plus Therapeutics, Inc)
14.6.1 Company Snapshot
14.6.2 Company Overview
14.6.3 Product Benchmarking
14.7 Cyagen Biosciences
14.7.1 Company Snapshot
14.7.2 Company Overview
14.7.3 Product Benchmarking
14.7.4 Strategic Outlook
14.8 PromoCell GmbH
14.8.1 Company Snapshot
14.8.2 Company Overview
14.8.3 Product Benchmarking
14.9 Celprogen Inc.
14.9.1 Company Snapshot
14.9.2 Company Overview
14.9.3 Product Benchmarking
14.10 Stemedica Cell Technologies, Inc.
14.10.1 Company Snapshot
14.10.2 Company Overview
14.10.3 Product Benchmarking
14.10.4 Strategic Outlook
14.11 Cell Applications, Inc
14.11.1 Company Snapshot
14.11.2 Company Overview
14.11.3 Product Benchmarking
14.12 Lonza
14.12.1 Company Snapshot
14.12.2 Company Overview
14.12.3 Financial Analysis
14.12.4 Product Benchmarking
14.12.5 Strategic Outlook
14.13 Celltex Therapeutics Corporation
14.13.1 Company Snapshot
14.13.2 Company Overview
14.13.3 Product Benchmarking
14.13.4 Strategic Outlook
15 Conclusion and Recommendation
15.1 Concluding Remarks from Visiongain
15.2 Recommendations for Market Players
List of Tables
Table 1 Mesenchymal Stem Cells Market Snapshot, 2022 & 2032 (US$ billion, CAGR %)
Table 2 Mesenchymal Stem Cells Market, 2022-2032 (US$ million, AGR (%), CAGR(%)): “V” Shaped Recovery Scenario
Table 3 Mesenchymal Stem Cells Market, 2022-2032 (US$ million, AGR (%), CAGR(%)): “V” Shaped Recovery Scenario
Table 4 Mesenchymal Stem Cells Market, 2022-2032 (US$ million, AGR (%), CAGR(%)): “W” Shaped Recovery Scenario
Table 5 Mesenchymal Stem Cells Market, 2022-2032 (US$ million, AGR (%), CAGR(%)): “L” Shaped Recovery Scenario
Table 6 Mesenchymal Stem Cells Market Forecast by Type, 2022-2032 (US$ million, AGR %, CAGR %)
Table 7 Products Market Forecast by Region, 2022-2032 (US$ million, AGR %, CAGR %)
Table 8 Cell & Cell Lines Market Forecast by Region, 2022-2032 (US$ million, AGR %, CAGR %)
Table 9 Kits, Media & Reagent Market Forecast by Region, 2022-2032 (US$ million, AGR %, CAGR %)
Table 10 Others Market Forecast by Region, 2022-2032 (US$ million, AGR %, CAGR %)
Table 11 Services Market Forecast by Region, 2022-2032 (US$ million, AGR %, CAGR %)
Table 12 Mesenchymal Stem Cells Market Forecast by Source, 2022-2032 (US$ million, AGR %, CAGR %)
Table 13 Bone Marrow Market Forecast by Region, 2022-2032 (US$ million, AGR %, CAGR %)
Table 14 Adipose Tissues Market Forecast by Region, 2022-2032 (US$ million, AGR %, CAGR %)
Table 15 Cord Blood Market Forecast by Region, 2022-2032 (US$ million, AGR %, CAGR %)
Table 16 Fetal Liver Market Forecast by Region, 2022-2032 (US$ million, AGR %, CAGR %)
Table 17 Lung Market Forecast by Region, 2022-2032 (US$ million, AGR %, CAGR %)
Table 18 Peripheral Blood Market Forecast by Region, 2022-2032 (US$ million, AGR %, CAGR %)
Table 19 Fallopian Tube Market Forecast by Region, 2022-2032 (US$ million, AGR %, CAGR %)
Table 20 Others Market Forecast by Region, 2022-2032 (US$ million, AGR %, CAGR %)
Table 21 Mesenchymal Stem Cells Market Forecast by Indication, 2022-2032 (US$ million, AGR %, CAGR %)
Table 22 Bone And Cartilage Repair Market Forecast by Region, 2022-2032 (US$ million, AGR %, CAGR %)
Table 23 Cardiovascular Diseases Market Forecast by Region, 2022-2032 (US$ million, AGR %, CAGR %)
Table 24 Cancer Market Forecast by Region, 2022-2032 (US$ million, AGR %, CAGR %)
Table 25 GvHD Market Forecast by Region, 2022-2032 (US$ million, AGR %, CAGR %)
Table 26 Inflammatory And Immunological Diseases Market Forecast by Region, 2022-2032 (US$ million, AGR %, CAGR %)
Table 27 Liver Diseases Market Forecast by Region, 2022-2032 (US$ million, AGR %, CAGR %)
Table 28 Others Market Forecast by Region, 2022-2032 (US$ million, AGR %, CAGR %)
Table 29 Mesenchymal Stem Cells Market Forecast by Indication, 2022-2032 (US$ million, AGR %, CAGR %)
Table 30 Disease Modelling Market Forecast by Region, 2022-2032 (US$ million, AGR %, CAGR %)
Table 31 Drug Development & Discovery Market Forecast by Region, 2022-2032 (US$ million, AGR %, CAGR %)
Table 32 Stem Cell Banking Market Forecast by Region, 2022-2032 (US$ million, AGR %, CAGR %)
Table 33 Tissue Engineering Market Forecast by Region, 2022-2032 (US$ million, AGR %, CAGR %)
Table 34 Toxicology Studies Market Forecast by Region, 2022-2032 (US$ million, AGR %, CAGR %)
Table 35 Others Market Forecast by Region, 2022-2032 (US$ million, AGR %, CAGR %)
Table 36 Mesenchymal Stem Cells Market by Region, 2022-2032 (US$ million, AGR (%), CAGR (%))
Table 37 North America Mesenchymal Stem Cells Market Forecast by Country, 2022-2032 (US$ million, AGR %, CAGR %)
Table 38 North America Mesenchymal Stem Cells Market Forecast by Type, 2022-2032 (US$ million, AGR %, CAGR %)
Table 39 North America Mesenchymal Stem Cells Market Forecast by Product, 2022-2032 (US$ million, AGR %, CAGR %)
Table 40 North America Mesenchymal Stem Cells Market Forecast by Source, 2022-2032 (US$ million, AGR %, CAGR %)
Table 41 North America Mesenchymal Stem Cell Market Forecast by Indication, 2022-2032 (US$ million, AGR %, CAGR %)
Table 42 North America Mesenchymal Stem Cell Market Forecast by Application, 2022-2032 (US$ million, AGR %, CAGR %)
Table 43 U.S. Mesenchymal Stem Cells Market Forecast, 2022-2032 (US$ million, AGR %, CAGR %)
Table 44 Canada Mesenchymal Stem Cells Market Forecast, 2022-2032 (US$ million, AGR %, CAGR %)
Table 45 Europe Mesenchymal Stem Cells Market by Country, 2022-2032 (US$ million, AGR (%), CAGR (%))
Table 46 Europe Mesenchymal Stem Cells Market Forecast by Type, 2022-2032 (US$ million, AGR %, CAGR %)
Table 47 Europe Mesenchymal Stem Cells Market Forecast by Product, 2022-2032 (US$ million, AGR %, CAGR %)
Table 48 Europe Mesenchymal Stem Cells Market Forecast by Source, 2022-2032 (US$ million, AGR %, CAGR %)
Table 49 Europe Mesenchymal Stem Cell Market Forecast by Indication, 2022-2032 (US$ million, AGR %, CAGR %)
Table 50 Europe Mesenchymal Stem Cell Market Forecast by Application, 2022-2032 (US$ million, AGR %, CAGR %)
Table 51 Germany Mesenchymal Stem Cells Market Forecast, 2022-2032 (US$ million, AGR %, CAGR %)
Table 52 France Mesenchymal Stem Cells Market Forecast, 2022-2032 (US$ million, AGR %, CAGR %)
Table 53 U.K. Mesenchymal Stem Cells Market Forecast, 2022-2032 (US$ million, AGR %, CAGR %)
Table 54 Italy Mesenchymal Stem Cells Market Forecast, 2022-2032 (US$ million, AGR %, CAGR %)
Table 55 Spain Mesenchymal Stem Cells Market Forecast, 2022-2032 (US$ million, AGR %, CAGR %)
Table 56 Rest of Europe Mesenchymal Stem Cells Market Forecast, 2022-2032 (US$ million, AGR %, CAGR %)
Table 57 Asia Pacific Mesenchymal Stem Cells Market by Country, 2022-2032 (US$ million, AGR (%), CAGR (%))
Table 58 Asia Pacific Mesenchymal Stem Cells Market Forecast by Type, 2022-2032 (US$ million, AGR %, CAGR %)
Table 59 Asia Pacific Mesenchymal Stem Cells Market Forecast by Product, 2022-2032 (US$ million, AGR %, CAGR %)
Table 60 Asia Pacific Mesenchymal Stem Cells Market Forecast by Source, 2022-2032 (US$ million, AGR %, CAGR %)
Table 61 Asia Pacific Mesenchymal Stem Cell Market Forecast by Indication, 2022-2032 (US$ million, AGR %, CAGR %)
Table 62 Asia Pacific Mesenchymal Stem Cell Market Forecast by Application, 2022-2032 (US$ million, AGR %, CAGR %)
Table 63 China Mesenchymal Stem Cells Market Forecast, 2022-2032 (US$ million, AGR %, CAGR %)
Table 64 Japan Mesenchymal Stem Cells Market Forecast, 2022-2032 (US$ million, AGR %, CAGR %)
Table 65 India Mesenchymal Stem Cells Market Forecast, 2022-2032 (US$ million, AGR %, CAGR %)
Table 66 Australia Mesenchymal Stem Cells Market Forecast, 2022-2032 (US$ million, AGR %, CAGR %)
Table 67 Rest of Asia Pacific Mesenchymal Stem Cells Market Forecast, 2022-2032 (US$ million, AGR %, CAGR %)
Table 68 Latin America Mesenchymal Stem Cells Market by Country, 2022-2032 (US$ million, AGR (%), CAGR (%))
Table 69 Latin America Mesenchymal Stem Cells Market Forecast by Type, 2022-2032 (US$ million, AGR %, CAGR %)
Table 70 Latin America Mesenchymal Stem Cells Market Forecast by Product, 2022-2032 (US$ million, AGR %, CAGR %)
Table 71 Latin America Mesenchymal Stem Cells Market Forecast by Source, 2022-2032 (US$ million, AGR %, CAGR %)
Table 72 Latin America Mesenchymal Stem Cell Market Forecast by Indication, 2022-2032 (US$ million, AGR %, CAGR %)
Table 73 Latin America Mesenchymal Stem Cell Market Forecast by Application, 2022-2032 (US$ million, AGR %, CAGR %)
Table 74 Brazil Mesenchymal Stem Cells Market Forecast, 2022-2032 (US$ million, AGR %, CAGR %)
Table 75 Mexico Mesenchymal Stem Cells Market Forecast, 2022-2032 (US$ million, AGR %, CAGR %)
Table 76 Argentina Mesenchymal Stem Cells Market Forecast, 2022-2032 (US$ million, AGR %, CAGR %)
Table 77 Rest of Latin America Mesenchymal Stem Cells Market Forecast, 2022-2032 (US$ million, AGR %, CAGR %)
Table 78 Middle East & Africa Mesenchymal Stem Cells Market by Country, 2022-2032 (US$ million, AGR (%), CAGR (%))
Table 79 Middle East & Africa Mesenchymal Stem Cells Market Forecast by Type, 2022-2032 (US$ million, AGR %, CAGR %)
Table 80 Middle East & Africa Mesenchymal Stem Cells Market Forecast by Product, 2022-2032 (US$ million, AGR %, CAGR %)
Table 81 Middle East & Africa Mesenchymal Stem Cells Market Forecast by Source, 2022-2032 (US$ million, AGR %, CAGR %)
Table 82 Middle East & Africa Mesenchymal Stem Cell Market Forecast by Indication, 2022-2032 (US$ million, AGR %, CAGR %)
Table 83 Middle East & Africa Mesenchymal Stem Cell Market Forecast by Application, 2022-2032 (US$ million, AGR %, CAGR %)
Table 84 Saudi Arabia Mesenchymal Stem Cells Market Forecast, 2022-2032 (US$ million, AGR %, CAGR %)
Table 85 South Africa Mesenchymal Stem Cells Market Forecast, 2022-2032 (US$ million, AGR %, CAGR %)
Table 86 Turkey Mesenchymal Stem Cells Market Forecast, 2022-2032 (US$ million, AGR %, CAGR %)
Table 87 Rest of Middle East & Africa Mesenchymal Stem Cells Market Forecast, 2022-2032 (US$ million, AGR %, CAGR %)
Table 88 Key Business Strategies Adopted by Key Players in Mesenchymal Stem Cells Market
Table 89 Thermo Fisher Scientific Inc.: Key Details, (CEO, HQ, Revenue, Founded, No. of Employees, Company Type, Website, Business Segment)
Table 90 Thermo Fisher Scientific Inc.: Product Benchmarking
Table 91 Thermo Fisher Scientific Inc.: Strategic Outlook
Table 92 Merck KGaA: Key Details, (CEO, HQ, Revenue, Founded, No. of Employees, Company Type, Website, Business Segment)
Table 93 Merck KGaA: Product Benchmarking
Table 94 Merck KGaA: Strategic Outlook
Table 95 STEMCELL Technologies Inc: Key Details, (CEO, HQ, Revenue, Founded, No. of Employees, Company Type, Website, Business Segment)
Table 96 STEMCELL Technologies: Product Benchmarking
Table 97 STEMCELL Technologies: Strategic Outlook
Table 98 Cytori Therapeutics Inc.: Key Details, (CEO, HQ, Revenue, Founded, No. of Employees, Company Type, Website, Business Segment)
Table 99 Cytori Therapeutics Inc: Product Benchmarking
Table 100 Cyagen Biosciences: Key Details, (CEO, HQ, Revenue, Founded, No. of Employees, Company Type, Website, Business Segment)
Table 101 Cyagen Biosciences: Product Benchmarking
Table 102 Cyagen Biosciences: Strategic Outlook
Table 103 PromoCell GmbH: Key Details, (CEO, HQ, Revenue, Founded, No. of Employees, Company Type, Website, Business Segment)
Table 104 PromoCell GmbH: Product Benchmarking
Table 105 Celprogen Inc.: Key Details, (CEO, HQ, Revenue, Founded, No. of Employees, Company Type, Website, Business Segment)
Table 106 Celprogen Inc: Product Benchmarking
Table 107 Stemedica Cell Technologies, Inc.: Key Details, (CEO, HQ, Revenue, Founded, No. of Employees, Company Type, Website, Business Segment)
Table 108 Stemedica Cell Technologies, Inc: Product Benchmarking
Table 109 Stemedica Cell Technologies, Inc: Strategic Outlook
Table 110 Cell Applications, Inc.: Key Details, (CEO, HQ, Revenue, Founded, No. of Employees, Company Type, Website, Business Segment)
Table 111 Cell Applications, Inc: Product Benchmarking
Table 112 Lonza: Key Details, (CEO, HQ, Revenue, Founded, No. of Employees, Company Type, Website, Business Segment)
Table 113 Lonza: Product Benchmarking
Table 114 Lonza: Strategic Outlook
Table 115 Celltex Therapeutics Corporation: Key Details, (CEO, HQ, Revenue, Founded, No. of Employees, Company Type, Website, Business Segment)
Table 116 Celltex Therapeutics Corporation: Product Benchmarking
Table 117 Celltex Therapeutics Corporation: Strategic Outlook
List of Figures
Figure 1 Mesenchymal Stem Cells Market Segmentation
Figure 2 Mesenchymal Stem Cells Market Forecast by Region: Market Attractiveness Index
Figure 3 Mesenchymal Stem Cells Market by Type: Market Attractiveness Index
Figure 4 Mesenchymal Stem Cells Market by Source: Market Attractiveness Index
Figure 5 Mesenchymal Stem Cells Market by Indication: Market Attractiveness Index
Figure 6 Mesenchymal Stem Cells Market by Application: Market Attractiveness Index
Figure 7 Mesenchymal Stem Cells Market: Market Dynamics
Figure 8 Mesenchymal Stem Cells Market, 2022-2032 Covid-19 Impact Analysis
Figure 9 Mesenchymal Stem Cells Market, 2022-2032 (US$ million, AGR (%), CAGR (%)): “V” Shaped Recovery
Figure 10 Mesenchymal Stem Cells Market, 2022-2032 (US$ million, AGR (%), CAGR (%)): “U” Shaped Recovery
Figure 11 Mesenchymal Stem Cells Market by Region, 2022-2032 (US$ million, AGR (%), CAGR (%)): “W” Shaped Recovery
Figure 12 Mesenchymal Stem Cells Market, 2022-2032 (US$ million, AGR (%), CAGR (%)): “L” Shaped Recovery
Figure 13 Mesenchymal Stem Cells Market: Porter’s Five Forces Analysis
Figure 14 Mesenchymal Stem Cells Market: PESTLE Analysis
Figure 15 Mesenchymal Stem Cells Market by Type Growth Prospects
Figure 16 Mesenchymal Stem Cells Market Forecast by Type, 2022-2032 (US$ million, AGR %)
Figure 17 Mesenchymal Stem Cells Market Share Forecast by Type, 2022, 2027, 2032 (%)
Figure 18 Products Market Forecast by Region, 2022-2032 (US$ million)
Figure 19 Products Market Share Forecast by Region, 2022 & 2032 (%)
Figure 20 Cell & Cell Lines Market Forecast by Region, 2022-2032 (US$ million)
Figure 21 Cell & Cell Lines Market Share Forecast by Region, 2022 & 2032 (%)
Figure 22 Kits, Media & Reagent Market Forecast by Region, 2022-2032 (US$ million)
Figure 23 Kits, Media & Reagent Market Share Forecast by Region, 2022 & 2032 (%)
Figure 24 Others Market Forecast by Region, 2022-2032 (US$ million)
Figure 25 Others Market Share Forecast by Region, 2022-2032 (%)
Figure 26 Services Market Forecast by Region, 2022-2032 (US$ million)
Figure 27 Services Market Share Forecast by Region, 2022 & 2032 (%)
Figure 28 Mesenchymal Stem Cells Market by Source Growth Prospects
Figure 29 Mesenchymal Stem Cells Market Forecast by Source, 2022-2032 (US$ million, AGR %)
Figure 30 Mesenchymal Stem Cells Market Share Forecast by Source, 2022, 2027, 2032 (%)
Figure 31 Bone Marrow Market Forecast by Region, 2022-2032 (US$ million)
Figure 32 Bone Marrow Market Share Forecast by Region, 2022 & 2032 (%)
Figure 33 Adipose Tissues Market Forecast by Region, 2022-2032 (US$ million)
Figure 34 Adipose Tissues Market Share Forecast by Region, 2022 & 2032 (%)
Figure 35 Cord Blood Market Forecast by Region, 2022-2032 (US$ million)
Figure 36 Cord Blood Market Share Forecast by Region, 2022 & 2032 (%)
Figure 37 Fetal Liver Market Forecast by Region, 2022-2032 (US$ million)
Figure 38 Fetal Liver Market Share Forecast by Region, 2022 & 2032 (%)
Figure 39 Lung Market Forecast by Region, 2022-2032 (US$ million)
Figure 40 Lung Market Share Forecast by Region, 2022 & 2032 (%)
Figure 41 Peripheral Blood Market Forecast by Region, 2022-2032 (US$ million)
Figure 42 Peripheral Blood Market Share Forecast by Region, 2022 & 2032 (%)
Figure 43 Fallopian Tube Market Forecast by Region, 2022-2032 (US$ million)
Figure 44 Fallopian Tube Market Share Forecast by Region, 2022 & 2032 (%)
Figure 45 Others Market Forecast by Region, 2022-2032 (US$ million)
Figure 46 Bone Marrow Market Share Forecast by Region, 2022-2032 (%)
Figure 47 Mesenchymal Stem Cells Market by Indication Growth Prospects
Figure 48 Mesenchymal Stem Cells Market Forecast by Indication, 2022-2032 (US$ million, AGR %)
Figure 49 Mesenchymal Stem Cells Market Share Forecast by Indication, 2022, 2027, 2032 (%)
Figure 50 Bone And Cartilage Repair Market Forecast by Region, 2022-2032 (US$ million)
Figure 51 Bone And Cartilage Repair Market Share Forecast by Region, 2022 & 2032 (%)
Figure 52 Cardiovascular Diseases Market Forecast by Region, 2022-2032 (US$ million)
Figure 53 Cardiovascular Diseases Market Share Forecast by Region, 2022-2032 (%)
Figure 54 Cancer Market Forecast by Region, 2022 & 2032 (US$ million)
Figure 55 Cancer Market Share Forecast by Region, 2022 & 2032 (%)
Figure 56 GvHD Market Forecast by Region, 2022-2032 (US$ million)
Figure 57 GvHD Market Share Forecast by Region, 2022 & 2032 (%)
Figure 58 Inflammatory And Immunological Diseases Market Forecast by Region, 2022-2032 (US$ million)
Figure 59 Inflammatory And Immunological Diseases Market Share Forecast by Region, 2022 & 2032 (%)
Figure 60 Liver Diseases Market Forecast by Region, 2022-2032 (US$ million)
Figure 61 Liver Diseases Market Share Forecast by Region, 2022 & 2032 (%)
Figure 62 Others Market Forecast by Region, 2022-2032 (US$ million)
Figure 63 Others Market Share Forecast by Region, 2022 & 2032 (%)
Figure 64 Mesenchymal Stem Cells Market by Application Growth Prospects
Figure 65 Mesenchymal Stem Cells Market Forecast by Application, 2022-2032 (US$ million, AGR %)
Figure 66 Mesenchymal Stem Cells Market Share Forecast by Application, 2022, 2027, 2032 (%)
Figure 67 Disease Modelling Market Forecast by Region, 2022-2032 (US$ million)
Figure 68 Disease Modelling Repair Market Share Forecast by Region, 2022 & 2032 (%)
Figure 69 Drug Discovery & Development Market Forecast by Region, 2022-2032 (US$ million)
Figure 70 Drug Development & Discovery Market Share Forecast by Region, 2022-2032 (%)
Figure 71 Stem Cell Banking Market Forecast by Region, 2022-2032 (US$ million)
Figure 72 Stem Cell Banking Market Share Forecast by Region, 2022 & 2032 (%)
Figure 73 Tissue Engineering Market Forecast by Region, 2022-2032 (US$ million)
Figure 74 Tissue Engineering Market Share Forecast by Region, 2022 & 2032 (%)
Figure 75 Toxicology Studies Market Forecast by Region, 2022-2032 (US$ million)
Figure 76 Toxicology Studies Market Share Forecast by Region, 2022 & 2032 (%)
Figure 77 Others Market Forecast by Region, 2022-2032 (US$ million)
Figure 78 Others Market Share Forecast by Region, 2022-2032 (%)
Figure 79 Mesenchymal Stem Cells Market Forecast by Region 2022, 2027, 2032 (Revenue, CAGR%)
Figure 80 Mesenchymal Stem Cells Market Share Forecast by Region 2022, 2027, 2032(%)
Figure 81 Mesenchymal Stem Cells Market by Region, 2022-2032 (US$ million, AGR (%))
Figure 82 North America Mesenchymal Stem Cells Market Attractiveness Index
Figure 83 North America Mesenchymal Stem Cells Market by Region, 2022, 2027 & 2032 (US$ million)
Figure 84 North America Mesenchymal Stem Cells Market Forecast by Country, 2022-2032 (US$ million)
Figure 85 North America Mesenchymal Stem Cells Market Share Forecast by Country, 2022 & 2032 (%)
Figure 86 North America Mesenchymal Stem Cells Market Forecast by Type, 2022-2032 (US$ million)
Figure 87 North America Mesenchymal Stem Cells Market Share Forecast by Type, 2022 & 2032 (%)
Figure 88 North America Mesenchymal Stem Cells Market Forecast by Product, 2022-2032 (US$ million)
Figure 89 North America Mesenchymal Stem Cells Market Share Forecast by Product, 2022 & 2032 (%)
Figure 90 North America Mesenchymal Stem Cells Market Forecast by Technology, 2022-2032 (US$ million)
Figure 91 North America Mesenchymal Stem Cells Market Share Forecast by Source, 2022 & 2032 (%)
Figure 92 North America Mesenchymal Stem Cells Market Forecast by Indication, 2022-2032 (US$ million)
Figure 93 North America Mesenchymal Stem Cells Market Share Forecast by Indication, 2022 & 2032 (%)
Figure 94 North America Mesenchymal Stem Cells Market Forecast by Application, 2022-2032 (US$ million)
Figure 95 North America Mesenchymal Stem Cells Market Share Forecast by Application, 2022 & 2032 (%)
Figure 96 U.S. Mesenchymal Stem Cells Market Forecast, 2022-2032 (US$ million, AGR %)
Figure 97 Canada Mesenchymal Stem Cells Market Forecast, 2022-2032 (US$ million, AGR %)
Figure 98 Europe Mesenchymal Stem Cells Market Attractiveness Index
Figure 99 Europe Mesenchymal Stem Cells Market by Region, 2022, 2027 & 2032 (US$ million)
Figure 100 Europe Mesenchymal Stem Cells Market Forecast by Country, 2022-2032 (US$ million)
Figure 101 Europe Mesenchymal Stem Cells Market Share Forecast by Country, 2022 & 2032 (%)
Figure 102 Europe Mesenchymal Stem Cells Market Forecast by Type, 2022-2032 (US$ million)
Figure 103 Europe Mesenchymal Stem Cells Market Share Forecast by Type, 2022 & 2032 (%)
Figure 104 Europe Mesenchymal Stem Cells Market Forecast by Product, 2022-2032 (US$ million)
Figure 105 Europe Mesenchymal Stem Cells Market Share Forecast by Product, 2022 & 2032 (%)
Figure 106 Europe Mesenchymal Stem Cells Market Forecast by Source, 2022-2032 (US$ million)
Figure 107 Europe Mesenchymal Stem Cells Market Share Forecast by Source, 2022 & 2032 (%)
Figure 108 Europe Mesenchymal Stem Cells Market Forecast by Indication, 2022-2032 (US$ million)
Figure 109 Europe Mesenchymal Stem Cells Market Share Forecast by Indication, 2022 & 2032 (%)
Figure 110 Europe Mesenchymal Stem Cells Market Forecast by Application, 2022-2032 (US$ million)
Figure 111 Europe Mesenchymal Stem Cells Market Share Forecast by Application, 2022 & 2032 (%)
Figure 112 Germany Mesenchymal Stem Cells Market Forecast, 2022-2032 (US$ million, AGR %)
Figure 113 France Mesenchymal Stem Cells Market Forecast, 2022-2032 (US$ million, AGR %)
Figure 114 U.K. Mesenchymal Stem Cells Market Forecast, 2022-2032 (US$ million, AGR %)
Figure 115 Italy Mesenchymal Stem Cells Market Forecast, 2022-2032 (US$ million, AGR %)
Figure 116 Spain Mesenchymal Stem Cells Market Forecast, 2022-2032 (US$ million, AGR %)
Figure 117 Rest of Europe Mesenchymal Stem Cells Market Forecast, 2022-2032 (US$ million, AGR %)
Figure 118 Asia Pacific Mesenchymal Stem Cells Market Attractiveness Index
Figure 119 Asia Pacific Mesenchymal Stem Cells Market by Region, 2022, 2027 & 2032 (US$ million)
Figure 120 Asia Pacific Mesenchymal Stem Cells Market Forecast by Country, 2022-2032 (US$ million)
Figure 121 Asia Pacific Mesenchymal Stem Cells Market Share Forecast by Country, 2022 & 2032 (%)
Figure 122 Asia Pacific Mesenchymal Stem Cells Market Forecast by Type, 2022-2032 (US$ million)
Figure 123 Asia Pacific Mesenchymal Stem Cells Market Share Forecast by Type, 2022 & 2032 (%)
Figure 124 Asia Pacific Mesenchymal Stem Cells Market Forecast by Product, 2022-2032 (US$ million)
Figure 125 Asia Pacific Mesenchymal Stem Cells Market Share Forecast by Product, 2022 & 2032 (%)
Figure 126 Asia Pacific Mesenchymal Stem Cells Market Forecast by Source, 2022-2032 (US$ million)
Figure 127 Asia Pacific Mesenchymal Stem Cells Market Share Forecast by Source, 2022 & 2032 (%)
Figure 128 Asia Pacific Mesenchymal Stem Cells Market Forecast by Indication, 2022-2032 (US$ million)
Figure 129 Asia Pacific Mesenchymal Stem Cells Market Share Forecast by Indication, 2022 & 2032 (%)
Figure 130 Asia Pacific Mesenchymal Stem Cells Market Forecast by Application, 2022-2032 (US$ million)
Figure 131 Asia Pacific Mesenchymal Stem Cells Market Share Forecast by Application, 2022 & 2032 (%)
Figure 132 China Mesenchymal Stem Cells Market Forecast, 2022-2032 (US$ million, AGR %)
Figure 133 Japan Mesenchymal Stem Cells Market Forecast, 2022-2032 (US$ million, AGR %)
Figure 134 India Mesenchymal Stem Cells Market Forecast, 2022-2032 (US$ million, AGR %)
Figure 135 Australia Mesenchymal Stem Cells Market Forecast, 2022-2032 (US$ million, AGR %)
Figure 136 Rest of Asia Pacific Mesenchymal Stem Cells Market Forecast, 2022-2032 (US$ million, AGR %)
Figure 137 Latin America Mesenchymal Stem Cells Market Attractiveness Index
Figure 138 Latin America Mesenchymal Stem Cells Market by Region, 2022, 2027 & 2032 (US$ million)
Figure 139 Latin America Mesenchymal Stem Cells Market Forecast by Country, 2022-2032 (US$ million)
Figure 140 Latin America Mesenchymal Stem Cells Market Share Forecast by Country, 2022 & 2032 (%)
Figure 141 Asia Pacific Mesenchymal Stem Cells Market Forecast by Type, 2022-2032 (US$ million)
Figure 142 Latin America Mesenchymal Stem Cells Market Share Forecast by Type, 2022 & 2032 (%)
Figure 143 Latin America Mesenchymal Stem Cells Market Forecast by Product, 2022-2032 (US$ million)
Figure 144 Latin America Mesenchymal Stem Cells Market Share Forecast by Product, 2022 & 2032 (%)
Figure 145 Latin America Mesenchymal Stem Cells Market Forecast by Source, 2022-2032 (US$ million)
Figure 146 Latin America Mesenchymal Stem Cells Market Share Forecast by Source, 2022 & 2032 (%)
Figure 147 Latin America Mesenchymal Stem Cells Market Forecast by Indication, 2022-2032 (US$ million)
Figure 148 Latin America Mesenchymal Stem Cells Market Share Forecast by Indication, 2022 & 2032 (%)
Figure 149 Latin America Mesenchymal Stem Cells Market Forecast by Application, 2022-2032 (US$ million)
Figure 150 Latin America Mesenchymal Stem Cells Market Share Forecast by Application, 2022 & 2032 (%)
Figure 151 Brazil Mesenchymal Stem Cells Market Forecast, 2022-2032 (US$ million, AGR %)
Figure 152 Mexico Mesenchymal Stem Cells Market Forecast, 2022-2032 (US$ million, AGR %)
Figure 153 Argentina Mesenchymal Stem Cells Market Forecast, 2022-2032 (US$ million, AGR %)
Figure 154 Rest of Latin America Mesenchymal Stem Cells Market Forecast, 2022-2032 (US$ million, AGR %)
Figure 155 Middle East & Africa Mesenchymal Stem Cells Market Attractiveness Index
Figure 156 Middle East & Africa Mesenchymal Stem Cells Market by Region, 2022, 2027 & 2032 (US$ million)
Figure 157 Middle East & Africa Mesenchymal Stem Cells Market Forecast by Country, 2022-2032 (US$ million)
Figure 158 Middle East & Africa Mesenchymal Stem Cells Market Share Forecast by Country, 2022 & 2032 (%)
Figure 159 Asia Pacific Mesenchymal Stem Cells Market Forecast by Type, 2022-2032 (US$ million)
Figure 160 Middle East & Africa Mesenchymal Stem Cells Market Share Forecast by Type, 2022 & 2032 (%)
Figure 161 Middle East & Africa Mesenchymal Stem Cells Market Forecast by Product, 2022-2032 (US$ million)
Figure 162 Middle East & Africa Mesenchymal Stem Cells Market Share Forecast by Product, 2022 & 2032 (%)
Figure 163 Middle East & Africa Mesenchymal Stem Cells Market Forecast by Source, 2022-2032 (US$ million)
Figure 164 Middle East & Africa Mesenchymal Stem Cells Market Share Forecast by Source, 2022 & 2032 (%)
Figure 165 Middle East & Africa Mesenchymal Stem Cells Market Forecast by Indication, 2022-2032 (US$ million)
Figure 166 Middle East & Africa Mesenchymal Stem Cells Market Share Forecast by Indication, 2022 & 2032 (%)
Figure 167 Middle East & Africa Mesenchymal Stem Cells Market Forecast by Application, 2022-2032 (US$ million)
Figure 168 Middle East & Africa Mesenchymal Stem Cells Market Share Forecast by Application, 2022 & 2032 (%)
Figure 169 Saudi Arabia Mesenchymal Stem Cells Market Forecast, 2022-2032 (US$ million, AGR %)
Figure 170 South Africa Mesenchymal Stem Cells Market Forecast, 2022-2032 (US$ million, AGR %)
Figure 171 Turkey Mesenchymal Stem Cells Market Forecast, 2022-2032 (US$ million, AGR %)
Figure 172 Rest of Middle East & Africa Mesenchymal Stem Cells Market Forecast, 2022-2032 (US$ million, AGR %)
Figure 173 Mesenchymal Stem Cells Market: Company Share Analysis, 2021
Figure 174 Thermo Fisher Scientific Inc.: Net Revenue, 2016-2021 (US$ million, AGR%)
Figure 175 Thermo Fisher Scientific Inc.: Regional Market Shares, 2021
Figure 176 Thermo Fisher Scientific Inc.: Gross Profit, 2016-2021 (US$ million, AGR%)
Figure 177 Thermo Fisher Scientific Inc.: R&D, 2016-2021 (US$ million, AGR%)
Figure 178 Merck KGaA: Net Revenue, 2016-2021 (US$ million, AGR%)
Figure 179 Merck KGaA: Regional Market Shares, 2021
Figure 180 Merck KGaA: Gross Profit, 2016-2021 (US$ million, AGR%)
Figure 181 Merck KGaA: R&D, 2016-2021 (US$ million, AGR%)
Figure 182 Lonza: Net Revenue, 2016-2021 (US$ million, AGR%)
Figure 183 Lonza: Regional Market Shares, 2021
Figure 184 Lonza: Gross Profit, 2016-2021 (US$ million, AGR%)
ページTOPに戻る
よくあるご質問
Visiongain社はどのような調査会社ですか?
英国の調査会社ヴィジョンゲイン社(Visiongain)は、通信とエネルギーのほか、自動車や化学・医薬品、金属など、広範な市場を対象に調査を行っています。自動車市場については、市場全般に関する調査のほ... もっと見る
調査レポートの納品までの日数はどの程度ですか?
在庫のあるものは速納となりますが、平均的には 3-4日と見て下さい。
但し、一部の調査レポートでは、発注を受けた段階で内容更新をして納品をする場合もあります。
発注をする前のお問合せをお願いします。
注文の手続きはどのようになっていますか?
1)お客様からの御問い合わせをいただきます。
2)見積書やサンプルの提示をいたします。
3)お客様指定、もしくは弊社の発注書をメール添付にて発送してください。
4)データリソース社からレポート発行元の調査会社へ納品手配します。
5) 調査会社からお客様へ納品されます。最近は、pdfにてのメール納品が大半です。
お支払方法の方法はどのようになっていますか?
納品と同時にデータリソース社よりお客様へ請求書(必要に応じて納品書も)を発送いたします。
お客様よりデータリソース社へ(通常は円払い)の御振り込みをお願いします。
請求書は、納品日の日付で発行しますので、翌月最終営業日までの当社指定口座への振込みをお願いします。振込み手数料は御社負担にてお願いします。
お客様の御支払い条件が60日以上の場合は御相談ください。
尚、初めてのお取引先や個人の場合、前払いをお願いすることもあります。ご了承のほど、お願いします。
データリソース社はどのような会社ですか?
当社は、世界各国の主要調査会社・レポート出版社と提携し、世界各国の市場調査レポートや技術動向レポートなどを日本国内の企業・公官庁及び教育研究機関に提供しております。
世界各国の「市場・技術・法規制などの」実情を調査・収集される時には、データリソース社にご相談ください。
お客様の御要望にあったデータや情報を抽出する為のレポート紹介や調査のアドバイスも致します。
|
|


