合成生物学市場レポート:2022-2032
Synthetic Biology Market Report 2022-2032
レポート詳細
合成生物学市場レポート 2022-2032 :本レポートは、新たな収益の柱を目指すリーディングカンパニーが、業界とその背景にあるダイナミクスをより深く理解する上で、非常に有益なものとな... もっと見る
※上記価格は部署ライセンス(Departmental licence)価格です。
その他の価格についてはデータリソースまでお問合せください。
日本語のページは自動翻訳を利用し作成しています。
実際のレポートは英文のみでご納品いたします。

|

|
サマリー
レポート詳細
合成生物学市場レポート 2022-2032:本レポートは、新たな収益の柱を目指すリーディングカンパニーが、業界とその背景にあるダイナミクスをより深く理解する上で、非常に有益なものとなるでしょう。また、異業種への進出や新地域での既存事業の拡大を目指す企業にとっても有用なレポートです。
バイオ・医薬事業におけるR&Dの拡大
バイオテクノロジーや医薬品の研究開発における合成生物学の需要の高まりは、この産業の成長につながります。例えば、国際製薬団体連合会(IFPMA)によると、医薬品の研究開発型ビジネスでは、毎年約1498億米ドルがR&Dに費やされています。疾患メカニズムの解明、創薬プラットフォーム、創薬標的の同定、治療薬送達、治療法、医薬品製造のための生物と人工ネットワークは、治療分野への合成生物学の貢献の一例です。合成生物学産業は、医薬品への応用需要の高まりにより、近い将来、大きく成長する可能性があります。
環境安全性の問題は、合成生物学の導入を一定程度まで制限する可能性がある
合成生物学では、研究などで意図的または非意図的に合成生物を環境中に導入することが、バイオセーフティ上の大きな問題となる。合成細菌は変異したり、環境中の他の種と相互作用したりして、交雑や生物学的エラーを引き起こす可能性がある。これは、野生生物の環境を脅かす可能性がある。また、抗生物質に耐性を持つスーパーバグの出現も、バイオセーフティに関する重要な懸念事項のひとつです。近年、欧州連合(EU)は、植物の成長やバイオレメディエーションのために意図的に放出された遺伝子組み換え細菌の環境への影響を調査する多くの調査研究に資金を提供しています。しかし、合成生物学に関連するバイオセーフティ、バイオセキュリティ、倫理的なリスクは、ビジネスの成長を阻害する可能性があります。
マーケットリサーチレポートを購入する前に、どのような質問をすべきでしょうか?
- 合成生物学市場はどのように進化しているのか?
- 合成生物学市場の推進要因と抑制要因は何か?
- 各合成生物学サブマーケットセグメントは予測期間中にどのように成長し、2032年にどれくらいの売上を占めるようになるのか?
- 2022年から2032年にかけて、各合成生物学サブマーケットの市場シェアはどのように推移するのか?
- 2022年から2032年にかけて、市場全体の主なドライバーは何になるのでしょうか?
- 合成生物学の主要市場はマクロ経済のダイナミクスに概ね追随するのか、それとも個々の国別市場が他を凌駕するのか?
- 2032年までに各国市場のシェアはどのように変化し、どの地域が2032年の市場をリードするのか?
- 主要プレイヤーは誰か、また予測期間中の展望は?
- これらのリーディング企業の合成生物学プロジェクトは?
- 2020年から2032年の間に、業界はどのように進化するのか?現在および今後 10 年間に行われる合成生物学プロジェクトはどのような意味を持つのか?
- 合成生物学市場の規模をさらに拡大するために、製品の商業化の必要性は高まっているのでしょうか。
- 合成生物学市場の方向性と、市場の最前線に立つためにはどうすればよいか?
- 新製品やサービスラインに対する最適な投資方法とは?
- 企業を新たな成長軌道に乗せ、C-suiteに移行させるための重要な展望とは?
このことが、現在、そして今後10年間の合成生物学市場にどのような影響を与えるかを見極める必要があります。
- 745ページにわたる本レポートでは、355の表と710のグラフを独占的に提供します。
- このレポートでは、業界における主要な収益性の高い分野をハイライトしているため、今すぐターゲットを絞ることができます。
- 世界、地域、国別の売上高と成長率を詳細に分析しています。
- 競合他社が成功した主なトレンド、変化、収益予測をハイライトしています。
本レポートは次のことを教えてくれます。合成生物学市場が今後10年間にどのように発展していくのか、またCOVID-19の景気後退や景気回復の変動に伴ってどのように変化していくのか。この市場は、過去10年間のどの時点よりも、今が重要なのです。
レポートでは、COVID-19のバリエーションや経済データなど、お客様の市場に特化した独自の情報をお届けしています。
2032年までの予測やその他の分析により、商業的な展望が見えてくる
- 2032年までの収益予測に加え、直近の実績、成長率、市場シェアもご覧いただけます。
- ビジネスの展望や展開など、独自の分析もご覧いただけます。
- 定性的分析(市場力学、促進要因、機会、阻害要因、課題など)、コスト構造、合成生物学価格上昇の影響、最近の動向などをご覧いただけます。
本レポートでは、COVID-19が業界と貴社にどのような影響を与えるかについて、データ分析と貴重な洞察を掲載しています。本レポートでは、COVID-19の4つの回収パターンとその影響、すなわち「V」、「L」、「W」、「U」について論じています。
報告書の対象セグメント
製品タイプ別の展望
- オリゴヌクレオチド・合成DNA
- 酵素
- クローニング技術キット
- 合成細胞
- 合成遺伝子
- 合成クローン
- シャーシ生物
- 異種核酸
- その他の製品タイプ
技術別の展望
- 遺伝子合成
- ゲノムエンジニアリング
- 塩基配列決定
- バイオインフォマティクス
- クローニング
- 部位特異的変異導入
- 計測・モデリング
- マイクロ流体工学
- ナノテクノロジー
- その他の技術
用途別の展望
・医療・製薬分野
- 創薬・治療(がん検出・診断、その他創薬・治療用途)
- 人工組織・組織再生(生体合成、幹細胞制御、その他の人工組織・組織再生用途)
・産業応用分野
- バイオ燃料・再生可能エネルギー
- 産業用酵素(繊維産業、製紙産業、その他産業分野)
- バイオマテリアル・グリーンケミカル
・食品・農業
・環境分野
- バイオレメディエーション
- バイオセンシング
・その他の用途
事業
- 前臨床
- 臨床
- 商業
- その他の事業
世界市場全体およびセグメントの収益予測に加え、4地域および20の主要国市場の収益予測も掲載しています。
北米
- 米国
- カナダ
欧州
- ドイツ
- フランス
- 英国
- イタリア
- スペイン
- その他の欧州
アジア太平洋
- 中国
- 日本
- インド
- オーストラリア
- 韓国
- その他のアジア太平洋地域
ラテンアメリカ
- ブラジル
- メキシコ
- アルゼンチン
- その他のラテンアメリカ地域
中東・アフリカ
- トルコ
- サウジアラビア
- 南アフリカ
- UAE
- エジプト
- その他の中東・アフリカ地域
合成生物学市場の主要企業のプロファイルと2022年から2032年まで、これらの企業の事業のこのセグメントに焦点を当てたものも含まれています。
主要企業と市場成長の可能性
・ Amyris Inc.
・ Agilent Technologies Inc.
・ Codexis, Inc.
・ Danaher Corporation
・ ElevateBio
・ Genscript Biotech Corporation
・ Ginkgo Bioworks
・ GRO Biosciences
・ Merck KGaA
・ New England Biolabs
・ Precigen Inc.
・ Synthetic Genomics (Viridos)
・ Synlogic
・ Twist Bioscience Corp.
・ Thermo Fisher Scientific Inc.
合成生物学市場の世界全体の収益、2022年から2032年まで、金額ベースで2022年に169億米ドルを超えると、我々の仕事は計算しています。2032年までの間に収益が大きく伸びると予測している。弊社では、最も大きな可能性を秘めた組織を特定しています。彼らの能力、進歩、商業的展望を知ることで、一歩先を行くことができます。
合成生物学市場、2022年から2032年までのレポートはどのように役立つのでしょうか?
740ページを超えるレポートでは、要約すると以下のような知識を得ることができます。
- 合成生物学市場の2032年までの収益予測、製品タイプ、技術、用途の各予測を世界と地域レベルで掲載 - 業界の展望を見出し、投資と収益に最も有利な場所を見つけることができます。
- 5つの地域と20の主要国市場の2032年までの収益予測 - 北米、ヨーロッパ、アジア太平洋、ラテンアメリカ、MEAの合成生物学市場、2022年から2032年の市場予測をご覧ください。また、米国、カナダ、ブラジル、ドイツ、フランス、英国、イタリア、スペイン、中国、日本、インド、オーストラリア、韓国、ブラジル、メキシコ、アルゼンチン、トルコ、サウジアラビア、南アフリカ、UAE、エジプトなどの主要経済圏の市場も予測されています。
- 既存企業と市場参入を目指す企業の展望 - 合成生物学市場に関与する主要企業15社の企業プロファイルを含む、2022年から2032年までの展望。
定量的・定性的な分析と独自の予測をご覧いただけます。私たちのレポートだけが持つ情報を入手し、貴重なビジネスインテリジェンスを得ることができます。
他にはない情報
私たちの新しいレポートがあれば、知識の遅れを取り戻し、チャンスを逃す可能性が低くなります。私たちの研究が貴社の研究、分析、意思決定にどのように役立つかをご覧ください。Visiongainの研究は、合成生物学市場、2022年から2032年、市場をリードする企業のための商業分析を必要とするすべての人のためのものです。データ、トレンド、予測を見ることができます。
ページTOPに戻る
目次
目次
1.レポートの概要
1.1 研究の目的
1.2 合成生物学市場の紹介
1.3 本レポートが提供するもの
1.4 本レポートを読むべき理由
1.5 本分析レポートが回答する主な質問には以下が含まれます。
1.6 本レポートは誰のためのものなのか?
1.7 方法論
1.7.1 市場の定義
1.7.2 市場評価・予測手法
1.7.3 データの検証
1.8 よくある質問と回答(FAQ)
1.9 関連するVisiongainレポート
1.10 Visiongainについて
2 エグゼクティブサマリー
3 プレミアムインサイト
3.1 地域別スナップショット合成生物学の世界市場
3.2 製品タイプ別セグメント市場魅力度指数
3.3 技術セグメント:市場魅力度指標
3.4 アプリケーションセグメント市場魅力度指標
4 市場の概要
4.1 主要な調査結果
4.2 マーケットダイナミクス
4.2.1 市場の推進要因
4.2.2 市場の抑制要因
4.2.3 市場機会
4.3 COVID-19影響度分析
4.4 ポーターのファイブフォース分析
4.4.1 サプライヤーパワー
4.4.2 バイヤーパワー
4.4.3 競争相手との競合
4.4.4 代替品による脅威
4.4.5 新規参入者の脅威
4.5 状況分析
4.5.1 政治的要因-合成生物学分野を後押しする国際的な政治協力
4.5.2 経済的要因-合成生物学産業発展への投資懸念の増加
4.5.3 社会的要因:技術に対する意識の高まりによる合成生物学の導入の増加
4.5.4 技術面:技術導入のための強力なR&Dインフラの必要性
4.5.5 法的規制 - 厳しい規制の枠組みが課題を生む可能性
4.5.6 環境 - 環境安全性への懸念が事業拡大に影響
5 世界の合成生物学市場分析:製品タイプ別
5.1 主な調査結果
5.2 製品タイプ別成長展望
5.3 合成生物学の製品タイプ別世界市場シェア(2022年&2032年
5.4 オリゴヌクレオチド&合成DNA
5.4.1 オリゴヌクレオチド&合成DNAの地域別市場予測(2022年~2032年)(10億米ドル)
5.4.2 オリゴヌクレオチド&合成DNAの地域別市場シェア、2022年~2032年(%)
5.5 酵素
5.5.1 酵素の地域別市場予測、2022年~2032年(10億米ドル)
5.5.2 酵素の地域別市場シェア、2022年〜2032年(%)
5.6 クローニング技術キット
5.6.1 クローニング技術キットの地域別市場予測、2022年~2032年(10億米ドル)
5.6.2 クローニング技術キット地域別市場シェア、2022年〜2032年(%)
5.7 合成細胞
5.7.1 合成細胞の地域別市場予測、2022年~2032年(10億米ドル)
5.7.2 合成細胞の地域別市場シェア、2022年〜2032年(%)
5.8 合成遺伝子
5.8.1 合成遺伝子の地域別市場予測、2022年~2032年(10億米ドル)
5.8.2 合成遺伝子の地域別市場シェア、2022年〜2032年(%)
5.9 合成クローン
5.9.1 合成クローンの地域別市場予測、2022-2032年(10億米ドル)
5.9.2 合成クローンの地域別市場シェア、2022年〜2032年(%)
5.10 シャーシー・オーガニズム
5.10.1 シャーシ型生物の地域別市場予測、2022年〜2032年(10億米ドル)
5.10.2 シャシー・オーガニズムの地域別市場シェア、2022-2032年(%)
5.11 ゼノ核酸
5.11.1 ゼノ核酸の地域別市場予測、2022-2032年 (10億米ドル)
5.11.2 ゼノ核酸の地域別市場シェア、2022年〜2032年(%)
5.12 その他の製品タイプ
5.12.1 その他の製品タイプの地域別市場予測, 2022-2032年 (10億米ドル)
5.12.2 その他の製品タイプ地域別市場シェア, 2022-2032年 (%)
5.13 合成生物学の世界市場規模予測・製品タイプ別予測
6 世界の合成生物学市場分析:技術別
6.1 主な調査結果
6.2 技術別成長展望
6.3 合成生物学の技術別世界市場シェア(2022年&2032年)
6.4 遺伝子合成
6.4.1 遺伝子合成の地域別市場予測、2022年~2032年(10億米ドル)
6.4.2 遺伝子合成の地域別市場シェア、2022年~2032年(%)
6.5 ゲノムエンジニアリング
6.5.1 ゲノムエンジニアリングの地域別市場予測, 2022-2032年(10億米ドル)
6.5.2 ゲノムエンジニアリングの地域別市場シェア、2022年〜2032年(%)
6.6 シーケンス
6.6.1 シーケンシングの地域別市場予測, 2022-2032年 (10億米ドル)
6.6.2 シーケンス地域別市場シェア、2022年~2032年(%)
6.7 バイオインフォマティクス
6.7.1 バイオインフォマティクス地域別市場予測、2022年〜2032年(10億米ドル)
6.7.2 バイオインフォマティクス地域別市場シェア、2022年〜2032年(%)
6.8 クローニング
6.8.1 クローニングの地域別市場予測、2022年〜2032年(10億米ドル)
6.8.2 クローニングの地域別市場シェア、2022年〜2032年(%)
6.9 サイトディレクテッドミュータジェネシス
6.9.1 部位特異的変異導入法の地域別市場予測、2022年~2032年(10億米ドル)
6.9.2 サイトディレクテッドミュータジェネシスの地域別市場シェア、2022年~2032年(%)
6.10 測定とモデリング
6.10.1 測定・モデリング市場地域別予測, 2022-2032年 (10億米ドル)
6.10.2 計測・モデリング地域別市場シェア、2022-2032年(%)
6.11 マイクロフルイディクス
6.11.1 マイクロフルイディクス地域別市場予測, 2022-2032年 (10億米ドル)
6.11.2 マイクロフルイディクス地域別市場シェア、2022年〜2032年(%)
6.12 ナノテクノロジー
6.12.1 ナノテクノロジーの地域別市場予測、2022年~2032年(10億米ドル)
6.12.2 ナノテクノロジー地域別市場シェア、2022-2032年(%)
6.13 その他のテクノロジー
6.13.1 その他テクノロジーの地域別市場予測, 2022-2032年 (10億米ドル)
6.13.2 その他のテクノロジーの地域別市場シェア, 2022-2032 (%)
6.14 合成生物学の世界市場規模予測・技術別予測
7 世界の合成生物学市場分析:用途別
7.1 主な調査結果
7.2 アプリケーション別成長展望
7.3 合成生物学のアプリケーション別世界市場シェア(2022年&2032年)
7.4 医療・医薬品用途
7.4.1 医療・医薬品用途の地域別市場予測(2022年~2032年)(10億米ドル)
7.4.2 医療・医薬品用途の地域別市場シェア(2022年~2032年)(%)
7.4.3 創薬・治療薬分野
7.4.4 人工組織・組織再生分野
7.5 産業用途
7.5.1 産業用途の地域別市場予測(2022年~2032年)(億米ドル)
7.5.2 産業用途の地域別市場シェア、2022-2032年(%)
7.5.3 バイオ燃料と再生可能エネルギー
7.5.4 産業用酵素
7.5.5 バイオマテリアル&グリーンケミカル
7.6 食品・農業
7.6.1 食品・農業の地域別市場予測、2022年〜2032年(10億米ドル)
7.6.2 食品・農業の地域別市場シェア、2022-2032 (%)
7.7 環境分野
7.7.1 環境アプリケーションの地域別市場予測(2022年〜2032年、10億米ドル)
7.7.2 環境アプリケーションの地域別市場シェア、2022年〜2032年(%)
7.7.3 バイオレメディエーション
7.7.4 バイオセンシング
7.8 その他のアプリケーション
7.8.1 その他のアプリケーションの地域別市場予測, 2022-2032年 (10億米ドル)
7.8.2 その他のアプリケーションの地域別市場シェア, 2022-2032年(%)
7.9 世界の合成生物学の用途別市場規模の推定と予測
8 世界の合成生物学市場分析:地域別
8.1 主な調査結果
8.2 地域別市場規模の推定と予測
9 北米の合成生物学市場分析
9.1 主な調査結果
9.2 北米合成生物学市場の魅力度指数
9.3 北米合成生物学国別市場、2022年、2027年&2032年(10億米ドル)
9.4 北米合成生物学市場の国別市場規模予測・予想
9.5 北米の合成生物学市場の製品タイプ別市場規模予測・予想
9.6 北米合成生物学の技術別市場規模予測・予想
9.7 北米合成生物学市場の用途別市場規模予測・予想
9.8 医療・医薬用途
9.8.1 北米合成生物学市場規模予測・予測:医療・製薬用途別
9.8.2 創薬・治療薬分野
9.8.3 人工組織・組織再生分野
9.9 産業分野への応用
9.9.1 北米合成生物学市場規模予測・予測:産業用途別
9.9.2 産業用酵素
9.10 環境分野への応用
9.10.1 北米における合成生物学の環境分野別市場規模の推定と予測
9.11 米国
9.11.1 米国の合成生物学市場:製品タイプ別
9.11.2 米国の合成生物学市場:技術別
9.11.3 米国の合成生物学市場:用途別
9.11.4 医療・製薬分野
9.11.5 産業分野
9.11.6 環境分野への応用
9.12 カナダ
9.12.1 カナダの合成生物学市場:製品タイプ別
9.12.2 カナダの合成生物学市場:技術別
9.12.3 カナダの合成生物学市場:用途別
9.12.4 医療・製薬分野
9.12.5 産業分野への応用
9.12.6 環境分野への応用
10 欧州の合成生物学市場分析
10.1 主な調査結果
10.2 欧州合成生物学市場の魅力度指数
10.3 欧州合成生物学国別市場、2022年、2027年&2032年(10億米ドル)
10.4 欧州合成生物学市場の国別市場規模予測・予想
10.5 欧州の合成生物学の製品タイプ別市場規模予測・予測
10.6 欧州の合成生物学の市場規模予測・技術別予測
10.7 欧州の合成生物学の市場規模予測・用途別予測
10.8 医療・医薬用途
10.8.1 欧州合成生物学市場規模予測・予測:医療・製薬用途別
10.8.2 創薬・治療薬分野
10.8.3 人工組織・組織再生分野
10.9 産業分野への応用
10.9.1 欧州の合成生物学市場規模予測・予測:産業用途別
10.9.2 産業用酵素
10.10 環境分野への応用
10.10.1 欧州の合成生物学市場規模予測・環境用途別予測
10.11 ドイツ
10.11.1 ドイツの合成生物学市場:製品タイプ別
10.11.2 ドイツの合成生物学市場:技術別
10.11.3 ドイツの合成生物学市場:用途別
10.11.4 医療・製薬分野
10.11.5 産業分野への応用
10.11.6 環境分野への応用
10.12 フランス
10.12.1 フランス合成生物学市場:製品タイプ別
10.12.2 フランス合成生物学市場:技術別
10.12.3 フランス合成生物学市場:用途別
10.12.4 医療・製薬分野
10.12.5 産業分野への応用
10.12.6 環境分野への応用
10.13 イギリス
10.13.1 イギリスの合成生物学市場:製品タイプ別
10.13.2 イギリスの合成生物学市場:技術別
10.13.3 英国の合成生物学市場:用途別
10.13.4 医療・製薬分野
10.13.5 産業分野への応用
10.13.6 環境分野への応用
10.14 イタリア
10.14.1 イタリア合成生物学市場:製品タイプ別
10.14.2 イタリア合成生物学市場:技術別
10.14.3 イタリアの合成生物学市場:用途別
10.14.4 医療・製薬分野
10.14.5 産業分野への応用
10.14.6 環境分野への応用
10.15 スペイン
10.15.1 スペインの合成生物学市場:製品タイプ別
10.15.2 スペインの合成生物学市場:技術別
10.15.3 スペインの合成生物学市場:用途別
10.15.4 医療・製薬分野
10.15.5 産業分野への応用
10.15.6 環境分野への応用
10.16 その他の地域
10.16.1 欧州の合成生物学市場:製品タイプ別
10.16.2 欧州の合成生物学市場:技術別
10.16.3 欧州の残りの合成生物学市場:用途別
10.16.4 医療・製薬分野
10.16.5 産業分野への応用
10.16.6 環境分野への応用
11 アジア太平洋地域の合成生物学市場分析
11.1 主な調査結果
11.2 アジア太平洋地域の合成生物学市場の魅力度指数
11.3 アジア太平洋地域の合成生物学市場の国別推移、2022年、2027年&2032年(10億米ドル)
11.4 アジア太平洋地域の合成生物学市場の国別市場規模予測・予想
11.5 アジア太平洋地域の合成生物学市場の製品タイプ別市場規模予測・予測
11.6 アジア太平洋地域の合成生物学市場の技術別市場規模予測・予想
11.7 アジア太平洋地域の合成生物学市場の用途別市場規模予測・予測
11.7.1 医療・医薬品用途
11.7.2 創薬・治療分野
11.7.3 人工組織・組織再生分野
11.8 産業分野への応用
11.8.1 アジア太平洋地域の産業用途別合成生物学市場規模予測・予測
11.8.2 産業用酵素
11.9 環境分野への応用
11.9.1 アジア太平洋地域の合成生物学市場の環境用途別市場規模の推定と予測
11.10 中国
11.10.1 中国の合成生物学市場:製品タイプ別
11.10.2 中国の合成生物学市場:技術別
11.10.3 中国合成生物学市場:用途別
11.10.4 医療・製薬分野
11.10.5 産業分野への応用
11.10.6 環境分野への応用
11.11 日本
11.11.1 日本における合成生物学市場:製品タイプ別
11.11.2 合成生物学の日本市場:技術別
11.11.3 日本合成生物学市場:用途別
11.11.4 医療・製薬分野
11.11.5 産業分野
11.11.6 環境分野への応用
11.12 インド
11.12.1 インドの合成生物学市場:製品タイプ別
11.12.2 インドの合成生物学市場:技術別
11.12.3 インドの合成生物学市場:用途別
11.12.4 医療・製薬分野
11.12.5 産業分野への応用
11.12.6 環境分野への応用
11.13 オーストラリア
11.13.1 オーストラリアの合成生物学市場:製品タイプ別
11.13.2 オーストラリアの合成生物学市場:技術別
11.13.3 オーストラリアの合成生物学市場:用途別
11.13.4 医療・製薬分野
11.13.5 産業分野への応用
11.13.6 環境分野への応用
11.14 韓国
11.14.1 韓国の合成生物学市場:製品タイプ別
11.14.2 韓国の合成生物学市場:技術別
11.14.3 韓国の合成生物学市場:用途別
11.14.4 医療・製薬分野
11.14.5 産業分野への応用
11.14.6 環境分野への応用
11.15 アジア太平洋地域のその他の地域
11.15.1 アジア太平洋地域の合成生物学市場:製品タイプ別
11.15.2 その他のアジア太平洋地域の合成生物学市場:技術別
11.15.3 アジア太平洋地域の残りの合成生物学市場:用途別
11.15.4 医療・製薬分野
11.15.5 産業分野への応用
11.15.6 環境分野への応用
12 ラテンアメリカの合成生物学市場分析
12.1 主な調査結果
12.2 ラテンアメリカの合成生物学市場の魅力度指数
12.3 ラテンアメリカの合成生物学市場の国別推移(2022年、2027年&2032年)(10億米ドル)
12.4 ラテンアメリカの合成生物学市場の国別市場規模予測・予想
12.5 ラテンアメリカの合成生物学市場の製品タイプ別市場規模予測・予想
12.6 ラテンアメリカの合成生物学市場の技術別市場規模予測・予想
12.7 ラテンアメリカの合成生物学市場の用途別市場規模予測・予想
12.8 医療・医薬用途
12.8.1 ラテンアメリカの合成生物学市場の医療・製薬用途別市場規模の推定と予測
12.8.2 創薬・治療薬分野
12.8.3 人工組織・組織再生分野
12.9 産業分野への応用
12.9.1 ラテンアメリカの合成生物学市場規模予測・予測:産業分野別
12.9.2 産業用酵素
12.10 環境分野への応用
12.10.1 ラテンアメリカの合成生物学市場規模予測・予測:環境用途別
12.11 ブラジル
12.11.1 ブラジルの合成生物学市場:製品タイプ別
12.11.2 ブラジル合成生物学市場:技術別
12.11.3 ブラジルの合成生物学市場:用途別
12.11.4 医療・製薬分野
12.11.5 産業分野への応用
12.11.6 環境分野への応用
12.12 メキシコ
12.12.1 メキシコの合成生物学市場:製品タイプ別
12.12.2 メキシコの合成生物学市場:技術別
12.12.3 メキシコの合成生物学市場:用途別
12.12.4 医療・製薬分野
12.12.5 産業分野への応用
12.12.6 環境分野への応用
12.13 アルゼンチン
12.13.1 アルゼンチン合成生物学市場:製品タイプ別
12.13.2 アルゼンチン合成生物学市場:技術別
12.13.3 アルゼンチン合成生物学市場:用途別
12.13.4 医療・製薬分野
12.13.5 産業分野への応用
12.13.6 環境分野への応用
12.14 ラテンアメリカのその他の地域
12.14.1 ラテンアメリカのその他の地域:合成生物学市場:製品タイプ別
12.14.2 ラテンアメリカのその他の地域 合成生物学市場:技術別
12.14.3 ラテンアメリカの他の合成生物学市場:用途別
12.14.4 医療・製薬分野
12.14.5 産業分野への応用
12.14.6 環境分野への応用
13 MEAの合成生物学市場分析
13.1 主な調査結果
13.2 MEA合成生物学市場の魅力度指数
13.3 MEAの合成生物学市場の国別推移(2022年、2027年&2032年)(10億米ドル)
13.4 MEA合成生物学市場の国別市場規模予測・予想
13.5 MEAの合成生物学の製品タイプ別市場規模予測・予想
13.6 MEAの合成生物学の市場規模予測・技術別予測
13.7 MEA合成生物学の用途別市場規模予測・予想
13.8 医療・医薬品用途
13.8.1 MEA合成生物学の医療・製薬用途別市場規模の推定と予測
13.8.2 創薬・治療薬分野
13.8.3 人工組織・組織再生分野
13.9 産業分野への応用
13.9.1 産業用途別のMEA合成生物学市場規模の推定と予測
13.9.2 産業用酵素
13.10 環境分野への応用
13.10.1 MEA合成生物学の環境用途別市場規模予測・予測
13.11 トルコ
13.11.1 トルコの合成生物学市場:製品タイプ別
13.11.2 トルコ 合成生物学市場:技術別
13.11.3 トルコの合成生物学市場:用途別
13.11.4 医療・製薬分野
13.11.5 産業分野への応用
13.11.6 環境分野への応用
13.12 サウジアラビア
13.12.1 サウジアラビアの合成生物学市場:製品タイプ別
13.12.2 サウジアラビアの合成生物学市場:技術別
13.12.3 サウジアラビアの合成生物学市場:用途別
13.12.4 医療・製薬分野
13.12.5 産業分野への応用
13.12.6 環境分野への応用
13.13 南アフリカ
13.13.1 南アフリカの合成生物学市場:製品タイプ別
13.13.2 南アフリカの合成生物学市場:技術別
13.13.3 南アフリカの合成生物学市場:用途別
13.13.4 医療・製薬分野
13.13.5 産業分野への応用
13.13.6 環境分野への応用
13.14 アラブ首長国連邦
13.14.1 UAEの合成生物学市場:製品タイプ別
13.14.2 UAEの合成生物学市場:技術別
13.14.3 UAEの合成生物学市場:用途別
13.14.4 医療・製薬分野
13.14.5 産業分野への応用
13.14.6 環境分野への応用
13.15 エジプト
13.15.1 エジプトの合成生物学市場:製品タイプ別
13.15.2 エジプトの合成生物学市場:技術別
13.15.3 エジプトの合成生物学市場:用途別
13.15.4 医療・製薬分野
13.15.5 産業分野への応用
13.15.6 環境分野への応用
13.16 MEAのその他の地域
13.16.1 MEA諸国の合成生物学市場(製品タイプ別
13.16.2 MEAの他の地域の合成生物学市場(技術別
13.16.3 MEAの他の地域の合成生物学市場(用途別
13.16.4 医療・製薬分野
13.16.5 産業分野
13.16.6 環境分野への応用
14 競合他社の状況
14.1 企業シェア分析
14.2 企業プロフィール
14.2.1 サーモフィッシャーサイエンティフィック
14.2.2 アジレント・テクノロジー
14.2.3 メルクKGaA
14.2.4 ジェンスクリプトバイオテック株式会社
14.2.5 Precigen Inc.
14.2.6 シンセティック・ジェノミクス(ビリドス)社
14.2.7 イチョウ・バイオワークス
14.2.8 ニューイングランド・バイオラブズ
14.2.9 ダナハーコーポレーション
14.2.10 ツイスト・バイオサイエンス・コーポレーション
14.2.11 コーデクシス
14.2.12 Amyris, Inc.
14.2.13 GROバイオサイエンシズ
14.2.14 シンロジック
14.2.15 エレベートバイオ
15 結論と提言
15.1 ヴィジョンゲインからの結論
15.2 市場関係者への提言
表の一覧
Table 1 Global Synthetic Biology Market Snapshot, 2022 & 2032 (US$ billion, CAGR %)
Table 2 Global Synthetic Biology Market Forecast by Region, 2022-2032 (US$ billion, AGR%, CAGR%): “V” Shaped Recovery
Table 3 Global Synthetic Biology Market Forecast by Region, 2022-2032 (US$ billion, AGR%, CAGR%): “U” Shaped Recovery
Table 4 Global Synthetic Biology Market Forecast by Region, 2022-2032 (US$ billion, AGR%, CAGR%): “W” Shaped Recovery
Table 5 Global Synthetic Biology Market Forecast by Region, 2022-2032 (US$ billion, AGR%, CAGR%): “L” Shaped Recovery
Table 6 Oligonucleotides & Synthetic DNA Market by Region Forecast, 2022-2032 (US$ billion, AGR%, CAGR%)
Table 7 Enzymes Market by Region Forecast, 2022-2032 (US$ billion, AGR%, CAGR%)
Table 8 Cloning Technology Kits Market by Region Forecast, 2022-2032 (US$ billion, AGR%, CAGR%)
Table 9 Synthetic Cells Market by Region Forecast, 2022-2032 (US$ billion, AGR%, CAGR%)
Table 10 Synthetic Genes Market by Region Forecast, 2022-2032 (US$ billion, AGR%, CAGR%)
Table 11 Synthetic Clones Market by Region Forecast, 2022-2032 (US$ billion, AGR%, CAGR%)
Table 12 Chassis Organisms Market by Region Forecast, 2022-2032 (US$ billion, AGR%, CAGR%)
Table 13 Xeno-Nucleic Acids Market by Region Forecast, 2022-2032 (US$ billion, AGR%, CAGR%)
Table 14 Other Product Types Regions Market by Region Forecast, 2022-2032 (US$ billion, AGR%, CAGR%)
Table 15 Global Synthetic Biology Market Forecast by Product Type, 2022-2032 (US$ billion, AGR%, CAGR%)
Table 16 Gene Synthesis Market Forecast by Region, 2022-2032 (US$ billion, AGR%, CAGR%)
Table 17 Genome Engineering Market Forecast by Region, 2022-2032 (US$ billion, AGR%, CAGR%)
Table 18 Sequencing Market Forecast by Region, 2022-2032 (US$ billion, AGR%, CAGR%)
Table 19 Bioinformatics Market Forecast by Region, 2022-2032 (US$ billion, AGR%, CAGR%)
Table 20 Cloning Market Forecast by Region, 2022-2032 (US$ billion, AGR%, CAGR%)
Table 21 Site-Directed Mutagenesis Market Forecast by Region, 2022-2032 (US$ billion, AGR%, CAGR%)
Table 22 Measurement & Modelling Market Forecast by Region, 2022-2032 (US$ billion, AGR%, CAGR%)
Table 23 Microfluidics Market Forecast by Region, 2022-2032 (US$ billion, AGR%, CAGR%)
Table 24 Nanotechnology Market Forecast by Region, 2022-2032 (US$ billion, AGR%, CAGR%)
Table 25 Other Technologies Market Forecast by Region, 2022-2032 (US$ billion, AGR%, CAGR%)
Table 26 Global Synthetic Biology Market by Technology Forecast, 2022-2032 (US$ billion, AGR%, CAGR%)
Table 27 Medical & Pharmaceutical Applications Market Forecast by Region, 2022-2032 (US$ billion, AGR%, CAGR%)
Table 28 Drug Discovery and Therapeutics Market Forecast by Region, 2022-2032 (US$ billion, AGR%, CAGR%)
Table 29 Cancer Detection & Diagnostics Market Forecast by Region, 2022-2032 (US$ billion, AGR%, CAGR%)
Table 30 Other Drug Discovery and Therapeutic Applications Market Forecast by Region, 2022-2032 (US$ billion, AGR%, CAGR%)
Table 31 Artificial Tissue & Tissue Regeneration Market Forecast by Region, 2022-2032 (US$ billion, AGR%, CAGR%)
Table 32 Bio-Synthesis Market Forecast by Region, 2022-2032 (US$ billion, AGR%, CAGR%)
Table 33 Stem Cell Regulation Market Forecast by Region, 2022-2032 (US$ billion, AGR%, CAGR%)
Table 34 Other Artificial Tissue and Tissue Regeneration Applications Market Forecast by Region, 2022-2032 (US$ billion, AGR%, CAGR%)
Table 35 Industrial Applications Market Forecast by Region, 2022-2032 (US$ billion, AGR%, CAGR%)
Table 36 Biofuel and Renewable Energy Market Forecast by Region, 2022-2032 (US$ billion, AGR%, CAGR%)
Table 37 Industrial Enzymes Market Forecast by Region, 2022-2032 (US$ billion, AGR%, CAGR%)
Table 38 Textile Industry Market Forecast by Region, 2022-2032 (US$ billion, AGR%, CAGR%)
Table 39 Paper Industry Market Forecast by Region, 2022-2032 (US$ billion, AGR%, CAGR%)
Table 40 Other Industries Market Forecast by Region, 2022-2032 (US$ billion, AGR%, CAGR%)
Table 41 Biomaterials & Green Chemicals Market Forecast by Region, 2022-2032 (US$ billion, AGR%, CAGR%)
Table 42 Food & Agriculture Market Forecast by Region, 2022-2032 (US$ billion, AGR%, CAGR%)
Table 43 Environmental Applications Market Forecast by Region, 2022-2032 (US$ billion, AGR%, CAGR%)
Table 44 Bioremediation Market Forecast by Region, 2022-2032 (US$ billion, AGR%, CAGR%)
Table 45 Biosensing Market Forecast by Region, 2022-2032 (US$ billion, AGR%, CAGR%)
Table 46 Other Applications Market Forecast by Region, 2022-2032 (US$ billion, AGR%, CAGR%)
Table 47 Global Synthetic Biology Market Forecast by Application, 2022-2032 (US$ billion, AGR%, CAGR%)
Table 48 Global Synthetic Biology Market by Region Forecast, 2022-2032 (US$ billion, AGR%, CAGR%)
Table 49 North America Synthetic Biology Market Forecast by Country, 2022-2032 (US$ billion, AGR%, CAGR%)
Table 50 North America Synthetic Biology Market Forecast by Product Type, 2022-2032 (US$ billion, AGR%, CAGR%)
Table 51 North America Synthetic Biology Market Forecast by Technology, 2022-2032 (US$ billion, AGR%, CAGR%)
Table 52 North America Synthetic Biology Market Forecast by Application, 2022-2032 (US$ billion, AGR%, CAGR%)
Table 53 North America Synthetic Biology Market Forecast by Medical & Pharmaceutical Applications, 2022-2032 (US$ billion, AGR%, CAGR%)
Table 54 North America Synthetic Biology Market Forecast by Drug Discovery and Therapeutics, 2022-2032 (US$ billion, AGR%, CAGR%)
Table 55 North America Synthetic Biology Market Forecast by Artificial Tissue & Tissue Regeneration, 2022-2032 (US$ billion, AGR%, CAGR%)
Table 56 North America Synthetic Biology Market Forecast by Industrial Applications, 2022-2032 (US$ billion, AGR%, CAGR%)
Table 57 North America Synthetic Biology Market Forecast by Industrial Enzymes, 2022-2032 (US$ billion, AGR%, CAGR%)
Table 58 North America Synthetic Biology Market Forecast by Environmental Applications, 2022-2032 (US$ billion, AGR%, CAGR%)
Table 59 U.S. Synthetic Biology Market Forecast, 2022-2032 (US$ billion, AGR%, CAGR%)
Table 60 U.S. Synthetic Biology Market Forecast by Product Type, 2022-2032 (US$ billion, AGR%, CAGR%)
Table 61 U.S. Synthetic Biology Market Forecast by Technology, 2022-2032 (US$ billion, AGR%, CAGR%)
Table 62 U.S. Synthetic Biology Market Forecast by Application, 2022-2032 (US$ billion, AGR%, CAGR%)
Table 63 U.S. Synthetic Biology Market Forecast by Medical & Pharmaceutical Applications, 2022-2032 (US$ billion, AGR%, CAGR%)
Table 64 U.S. Synthetic Biology Market Forecast by Drug Discovery and Therapeutics, 2022-2032 (US$ billion, AGR%, CAGR%)
Table 65 U.S. Synthetic Biology Market Forecast by Artificial Tissue & Tissue Regeneration, 2022-2032 (US$ billion, AGR%, CAGR%)
Table 66 U.S. Synthetic Biology Market Forecast by Industrial Applications, 2022-2032 (US$ billion, AGR%, CAGR%)
Table 67 U.S. Synthetic Biology Market Forecast by Industrial Enzymes, 2022-2032 (US$ billion, AGR%, CAGR%)
Table 68 U.S. Synthetic Biology Market Forecast by Environmental Applications, 2022-2032 (US$ billion, AGR%, CAGR%)
Table 69 Canada Synthetic Biology Market Forecast, 2022-2032 (US$ billion, AGR%, CAGR%)
Table 70 Canada Synthetic Biology Market Forecast by Product Type, 2022-2032 (US$ billion, AGR%, CAGR%)
Table 71 Canada Synthetic Biology Market Forecast by Technology, 2022-2032 (US$ billion, AGR%, CAGR%)
Table 72 Canada Synthetic Biology Market Forecast by Application, 2022-2032 (US$ billion, AGR%, CAGR%)
Table 73 Canada Synthetic Biology Market Forecast by Medical & Pharmaceutical Applications, 2022-2032 (US$ billion, AGR%, CAGR%)
Table 74 Canada Synthetic Biology Market Forecast by Drug Discovery and Therapeutics, 2022-2032 (US$ billion, AGR%, CAGR%)
Table 75 Canada Synthetic Biology Market Forecast by Artificial Tissue & Tissue Regeneration, 2022-2032 (US$ billion, AGR%, CAGR%)
Table 76 Canada Synthetic Biology Market Forecast by Industrial Applications, 2022-2032 (US$ billion, AGR%, CAGR%)
Table 77 Canada Synthetic Biology Market Forecast by Industrial Enzymes, 2022-2032 (US$ billion, AGR%, CAGR%)
Table 78 Canada Synthetic Biology Market Forecast by Environmental Applications, 2022-2032 (US$ billion, AGR%, CAGR%)
Table 79 Europe Synthetic Biology Market Forecast by Country, 2022-2032 (US$ billion, AGR%, CAGR%)
Table 80 Europe Synthetic Biology Market Forecast by Product Type,2022-2032 (US$ billion, AGR%, CAGR%)
Table 81 Europe Synthetic Biology Market Forecast by Technology,2022-2032 (US$ billion, AGR%, CAGR%)
Table 82 Europe Synthetic Biology Market Forecast by Application,2022-2032 (US$ billion, AGR%, CAGR%)
Table 83 Europe Synthetic Biology Market Forecast by Medical & Pharmaceutical Applications,2022-2032 (US$ billion, AGR%, CAGR%)
Table 84 Europe Synthetic Biology Market Forecast by Drug Discovery and Therapeutics,2022-2032 (US$ billion, AGR%, CAGR%)
Table 85 Europe Synthetic Biology Market Forecast by Artificial Tissue & Tissue Regeneration,2022-2032 (US$ billion, AGR%, CAGR%)
Table 86 Europe Synthetic Biology Market Forecast by Industrial Applications,2022-2032 (US$ billion, AGR%, CAGR%)
Table 87 Europe Synthetic Biology Market Forecast by Industrial Enzymes,2022-2032 (US$ billion, AGR%, CAGR%)
Table 88 Europe Synthetic Biology Market Forecast by Environmental Applications,2022-2032 (US$ billion, AGR%, CAGR%)
Table 89 Germany Synthetic Biology Market Forecast, 2022-2032 (US$ billion, AGR%, CAGR%)
Table 90 Germany Synthetic Biology Market Forecast by Product Type,2022-2032 (US$ billion, AGR%, CAGR%)
Table 91 Germany Synthetic Biology Market Forecast by Technology,2022-2032 (US$ billion, AGR%, CAGR%)
Table 92 Germany Synthetic Biology Market Forecast by Application,2022-2032 (US$ billion, AGR%, CAGR%)
Table 93 Germany Synthetic Biology Market Forecast by Medical & Pharmaceutical Applications,2022-2032 (US$ billion, AGR%, CAGR%)
Table 94 Germany Synthetic Biology Market Forecast by Drug Discovery and Therapeutics,2022-2032 (US$ billion, AGR%, CAGR%)
Table 95 Germany Synthetic Biology Market Forecast by Artificial Tissue & Tissue Regeneration,2022-2032 (US$ billion, AGR%, CAGR%)
Table 96 Germany Synthetic Biology Market Forecast by Industrial Applications,2022-2032 (US$ billion, AGR%, CAGR%)
Table 97 Germany Synthetic Biology Market Forecast by Industrial Enzymes,2022-2032 (US$ billion, AGR%, CAGR%)
Table 98 Germany Synthetic Biology Market Forecast by Environmental Applications,2022-2032 (US$ billion, AGR%, CAGR%)
Table 99 France Synthetic Biology Market Forecast, 2022-2032 (US$ billion, AGR%, CAGR%)
Table 100 France Synthetic Biology Market Forecast by Product Type,2022-2032 (US$ billion, AGR%, CAGR%)
Table 101 France Synthetic Biology Market Forecast by Technology,2022-2032 (US$ billion, AGR%, CAGR%)
Table 102 France Synthetic Biology Market Forecast by Application,2022-2032 (US$ billion, AGR%, CAGR%)
Table 103 France Synthetic Biology Market Forecast by Medical & Pharmaceutical Applications,2022-2032 (US$ billion, AGR%, CAGR%)
Table 104 France Synthetic Biology Market Forecast by Drug Discovery and Therapeutics,2022-2032 (US$ billion, AGR%, CAGR%)
Table 105 France Synthetic Biology Market Forecast by Artificial Tissue & Tissue Regeneration,2022-2032 (US$ billion, AGR%, CAGR%)
Table 106 France Synthetic Biology Market Forecast by Industrial Applications,2022-2032 (US$ billion, AGR%, CAGR%)
Table 107 France Synthetic Biology Market Forecast by Industrial Enzymes,2022-2032 (US$ billion, AGR%, CAGR%)
Table 108 France Synthetic Biology Market Forecast by Environmental Applications,2022-2032 (US$ billion, AGR%, CAGR%)
Table 109 UK Synthetic Biology Market Forecast, 2022-2032 (US$ billion, AGR%, CAGR%)
Table 110 UK Synthetic Biology Market Forecast by Product Type,2022-2032 (US$ billion, AGR%, CAGR%)
Table 111 UK Synthetic Biology Market Forecast by Technology,2022-2032 (US$ billion, AGR%, CAGR%)
Table 112 UK Synthetic Biology Market Forecast by Application,2022-2032 (US$ billion, AGR%, CAGR%)
Table 113 UK Synthetic Biology Market Forecast by Medical & Pharmaceutical Applications,2022-2032 (US$ billion, AGR%, CAGR%)
Table 114 UK Synthetic Biology Market Forecast by Drug Discovery and Therapeutics,2022-2032 (US$ billion, AGR%, CAGR%)
Table 115 UK Synthetic Biology Market Forecast by Artificial Tissue & Tissue Regeneration,2022-2032 (US$ billion, AGR%, CAGR%)
Table 116 UK Synthetic Biology Market Forecast by Industrial Applications,2022-2032 (US$ billion, AGR%, CAGR%)
Table 117 UK Synthetic Biology Market Forecast by Industrial Enzymes,2022-2032 (US$ billion, AGR%, CAGR%)
Table 118 UK Synthetic Biology Market Forecast by Environmental Applications,2022-2032 (US$ billion, AGR%, CAGR%)
Table 119 Italy Synthetic Biology Market Forecast, 2022-2032 (US$ billion, AGR%, CAGR%)
Table 120 Italy Synthetic Biology Market Forecast by Product Type,2022-2032 (US$ billion, AGR%, CAGR%)
Table 121 Italy Synthetic Biology Market Forecast by Technology,2022-2032 (US$ billion, AGR%, CAGR%)
Table 122 Italy Synthetic Biology Market Forecast by Application,2022-2032 (US$ billion, AGR%, CAGR%)
Table 123 Italy Synthetic Biology Market Forecast by Medical & Pharmaceutical Applications,2022-2032 (US$ billion, AGR%, CAGR%)
Table 124 Italy Synthetic Biology Market Forecast by Drug Discovery and Therapeutics,2022-2032 (US$ billion, AGR%, CAGR%)
Table 125 Italy Synthetic Biology Market Forecast by Artificial Tissue & Tissue Regeneration,2022-2032 (US$ billion, AGR%, CAGR%)
Table 126 Italy Synthetic Biology Market Forecast by Industrial Applications,2022-2032 (US$ billion, AGR%, CAGR%)
Table 127 Italy Synthetic Biology Market Forecast by Industrial Enzymes,2022-2032 (US$ billion, AGR%, CAGR%)
Table 128 Italy Synthetic Biology Market Forecast by Environmental Applications,2022-2032 (US$ billion, AGR%, CAGR%)
Table 129 Spain Synthetic Biology Market Forecast, 2022-2032 (US$ billion, AGR%, CAGR%)
Table 130 Spain Synthetic Biology Market Forecast by Product Type,2022-2032 (US$ billion, AGR%, CAGR%)
Table 131 Spain Synthetic Biology Market Forecast by Technology,2022-2032 (US$ billion, AGR%, CAGR%)
Table 132 Spain Synthetic Biology Market Forecast by Application,2022-2032 (US$ billion, AGR%, CAGR%)
Table 133 Spain Synthetic Biology Market Forecast by Medical & Pharmaceutical Applications,2022-2032 (US$ billion, AGR%, CAGR%)
Table 134 Spain Synthetic Biology Market Forecast by Drug Discovery and Therapeutics,2022-2032 (US$ billion, AGR%, CAGR%)
Table 135 Spain Synthetic Biology Market Forecast by Artificial Tissue & Tissue Regeneration,2022-2032 (US$ billion, AGR%, CAGR%)
Table 136 Spain Synthetic Biology Market Forecast by Industrial Applications,2022-2032 (US$ billion, AGR%, CAGR%)
Table 137 Spain Synthetic Biology Market Forecast by Industrial Enzymes,2022-2032 (US$ billion, AGR%, CAGR%)
Table 138 Spain Synthetic Biology Market Forecast by Environmental Applications,2022-2032 (US$ billion, AGR%, CAGR%)
Table 139 Rest of Europe Synthetic Biology Market Forecast, 2022-2032 (US$ billion, AGR%, CAGR%)
Table 140 Rest of Europe Synthetic Biology Market Forecast by Product Type,2022-2032 (US$ billion, AGR%, CAGR%)
Table 141 Rest of Europe Synthetic Biology Market Forecast by Technology,2022-2032 (US$ billion, AGR%, CAGR%)
Table 142 Rest of Europe Synthetic Biology Market Forecast by Application,2022-2032 (US$ billion, AGR%, CAGR%)
Table 143 Rest of Europe Synthetic Biology Market Forecast by Medical & Pharmaceutical Applications,2022-2032 (US$ billion, AGR%, CAGR%)
Table 144 Rest of Europe Synthetic Biology Market Forecast by Drug Discovery and Therapeutics,2022-2032 (US$ billion, AGR%, CAGR%)
Table 145 Rest of Europe Synthetic Biology Market Forecast by Artificial Tissue & Tissue Regeneration,2022-2032 (US$ billion, AGR%, CAGR%)
Table 146 Rest of Europe Synthetic Biology Market Forecast by Industrial Applications,2022-2032 (US$ billion, AGR%, CAGR%)
Table 147 Rest of Europe Synthetic Biology Market Forecast by Industrial Enzymes,2022-2032 (US$ billion, AGR%, CAGR%)
Table 148 Rest of Europe Synthetic Biology Market Forecast by Environmental Applications,2022-2032 (US$ billion, AGR%, CAGR%)
Table 149 Asia Pacific Synthetic Biology Market Forecast by Country,2022-2032 (US$ billion, AGR%, CAGR%)
Table 150 Asia Pacific Synthetic Biology Market Forecast by Product Type,2022-2032 (US$ billion, AGR%, CAGR%)
Table 151 Asia Pacific Synthetic Biology Market Forecast by Technology,2022-2032 (US$ billion, AGR%, CAGR%)
Table 152 Asia Pacific Synthetic Biology Market Forecast by Application,2022-2032 (US$ billion, AGR%, CAGR%)
Table 153 Asia Pacific Synthetic Biology Market Forecast by Medical & Pharmaceutical Applications,2022-2032 (US$ billion, AGR%, CAGR%)
Table 154 Asia Pacific Synthetic Biology Market Forecast by Drug Discovery and Therapeutics,2022-2032 (US$ billion, AGR%, CAGR%)
Table 155 Asia Pacific Synthetic Biology Market Forecast by Artificial Tissue & Tissue Regeneration,2022-2032 (US$ billion, AGR%, CAGR%)
Table 156 Asia Pacific Synthetic Biology Market Forecast by Industrial Applications,2022-2032 (US$ billion, AGR%, CAGR%)
Table 157 Asia Pacific Synthetic Biology Market Forecast by Industrial Enzymes,2022-2032 (US$ billion, AGR%, CAGR%)
Table 158 Asia Pacific Synthetic Biology Market Forecast by Environmental Applications,2022-2032 (US$ billion, AGR%, CAGR%)
Table 159 China Synthetic Biology Market Forecast,2022-2032 (US$ billion, AGR%, CAGR%)
Table 160 China Synthetic Biology Market Forecast by Product Type,2022-2032 (US$ billion, AGR%, CAGR%)
Table 161 China Synthetic Biology Market Forecast by Technology,2022-2032 (US$ billion, AGR%, CAGR%)
Table 162 China Synthetic Biology Market Forecast by Application,2022-2032 (US$ billion, AGR%, CAGR%)
Table 163 China Synthetic Biology Market Forecast by Medical & Pharmaceutical Applications,2022-2032 (US$ billion, AGR%, CAGR%)
Table 164 China Synthetic Biology Market Forecast by Drug Discovery and Therapeutics,2022-2032 (US$ billion, AGR%, CAGR%)
Table 165 China Synthetic Biology Market Forecast by Artificial Tissue & Tissue Regeneration,2022-2032 (US$ billion, AGR%, CAGR%)
Table 166 China Synthetic Biology Market Forecast by Industrial Applications,2022-2032 (US$ billion, AGR%, CAGR%)
Table 167 China Synthetic Biology Market Forecast by Industrial Enzymes,2022-2032 (US$ billion, AGR%, CAGR%)
Table 168 China Synthetic Biology Market Forecast by Environmental Applications,2022-2032 (US$ billion, AGR%, CAGR%)
Table 169 Japan Synthetic Biology Market Forecast,2022-2032 (US$ billion, AGR%, CAGR%)
Table 170 Japan Synthetic Biology Market Forecast by Product Type,2022-2032 (US$ billion, AGR%, CAGR%)
Table 171 Japan Synthetic Biology Market Forecast by Technology,2022-2032 (US$ billion, AGR%, CAGR%)
Table 172 Japan Synthetic Biology Market Forecast by Application,2022-2032 (US$ billion, AGR%, CAGR%)
Table 173 Japan Synthetic Biology Market Forecast by Medical & Pharmaceutical Applications,2022-2032 (US$ billion, AGR%, CAGR%)
Table 174 Japan Synthetic Biology Market Forecast by Drug Discovery and Therapeutics,2022-2032 (US$ billion, AGR%, CAGR%)
Table 175 Japan Synthetic Biology Market Forecast by Artificial Tissue & Tissue Regeneration,2022-2032 (US$ billion, AGR%, CAGR%)
Table 176 Japan Synthetic Biology Market Forecast by Industrial Applications,2022-2032 (US$ billion, AGR%, CAGR%)
Table 177 Japan Synthetic Biology Market Forecast by Industrial Enzymes,2022-2032 (US$ billion, AGR%, CAGR%)
Table 178 Japan Synthetic Biology Market Forecast by Environmental Applications,2022-2032 (US$ billion, AGR%, CAGR%)
Table 179 India Synthetic Biology Market Forecast,2022-2032 (US$ billion, AGR%, CAGR%)
Table 180 India Synthetic Biology Market Forecast by Product Type,2022-2032 (US$ billion, AGR%, CAGR%)
Table 181 India Synthetic Biology Market Forecast by Technology,2022-2032 (US$ billion, AGR%, CAGR%)
Table 182 India Synthetic Biology Market Forecast by Application,2022-2032 (US$ billion, AGR%, CAGR%)
Table 183 India Synthetic Biology Market Forecast by Medical & Pharmaceutical Applications,2022-2032 (US$ billion, AGR%, CAGR%)
Table 184 India Synthetic Biology Market Forecast by Drug Discovery and Therapeutics,2022-2032 (US$ billion, AGR%, CAGR%)
Table 185 India Synthetic Biology Market Forecast by Artificial Tissue & Tissue Regeneration,2022-2032 (US$ billion, AGR%, CAGR%)
Table 186 India Synthetic Biology Market Forecast by Industrial Applications,2022-2032 (US$ billion, AGR%, CAGR%)
Table 187 India Synthetic Biology Market Forecast by Industrial Enzymes,2022-2032 (US$ billion, AGR%, CAGR%)
Table 188 India Synthetic Biology Market Forecast by Environmental Applications,2022-2032 (US$ billion, AGR%, CAGR%)
Table 189 Australia Synthetic Biology Market Forecast,2022-2032 (US$ billion, AGR%, CAGR%)
Table 190 Australia Synthetic Biology Market Forecast by Product Type,2022-2032 (US$ billion, AGR%, CAGR%)
Table 191 Australia Synthetic Biology Market Forecast by Technology,2022-2032 (US$ billion, AGR%, CAGR%)
Table 192 Australia Synthetic Biology Market Forecast by Application,2022-2032 (US$ billion, AGR%, CAGR%)
Table 193 Australia Synthetic Biology Market Forecast by Medical & Pharmaceutical Applications,2022-2032 (US$ billion, AGR%, CAGR%)
Table 194 Australia Synthetic Biology Market Forecast by Drug Discovery and Therapeutics,2022-2032 (US$ billion, AGR%, CAGR%)
Table 195 Australia Synthetic Biology Market Forecast by Artificial Tissue & Tissue Regeneration,2022-2032 (US$ billion, AGR%, CAGR%)
Table 196 Australia Synthetic Biology Market Forecast by Industrial Applications,2022-2032 (US$ billion, AGR%, CAGR%)
Table 197 Australia Synthetic Biology Market Forecast by Industrial Enzymes,2022-2032 (US$ billion, AGR%, CAGR%)
Table 198 Australia Synthetic Biology Market Forecast by Environmental Applications,2022-2032 (US$ billion, AGR%, CAGR%)
Table 199 South Korea Synthetic Biology Market Forecast,2022-2032 (US$ billion, AGR%, CAGR%)
Table 200 South Korea Synthetic Biology Market Forecast by Product Type,2022-2032 (US$ billion, AGR%, CAGR%)
Table 201 South Korea Synthetic Biology Market Forecast by Technology,2022-2032 (US$ billion, AGR%, CAGR%)
Table 202 South Korea Synthetic Biology Market Forecast by Application,2022-2032 (US$ billion, AGR%, CAGR%)
Table 203 South Korea Synthetic Biology Market Forecast by Medical & Pharmaceutical Applications,2022-2032 (US$ billion, AGR%, CAGR%)
Table 204 South Korea Synthetic Biology Market Forecast by Drug Discovery and Therapeutics,2022-2032 (US$ billion, AGR%, CAGR%)
Table 205 South Korea Synthetic Biology Market Forecast by Artificial Tissue & Tissue Regeneration,2022-2032 (US$ billion, AGR%, CAGR%)
Table 206 South Korea Synthetic Biology Market Forecast by Industrial Applications,2022-2032 (US$ billion, AGR%, CAGR%)
Table 207 South Korea Synthetic Biology Market Forecast by Industrial Enzymes,2022-2032 (US$ billion, AGR%, CAGR%)
Table 208 South Korea Synthetic Biology Market Forecast by Environmental Applications,2022-2032 (US$ billion, AGR%, CAGR%)
Table 209 Rest of Asia Pacific Synthetic Biology Market Forecast,2022-2032 (US$ billion, AGR%, CAGR%)
Table 210 Rest of Asia Pacific Synthetic Biology Market Forecast by Product Type,2022-2032 (US$ billion, AGR%, CAGR%)
Table 211 Rest of Asia Pacific Synthetic Biology Market Forecast by Technology,2022-2032 (US$ billion, AGR%, CAGR%)
Table 212 Rest of Asia Pacific Synthetic Biology Market Forecast by Application,2022-2032 (US$ billion, AGR%, CAGR%)
Table 213 Rest of Asia Pacific Synthetic Biology Market Forecast by Medical & Pharmaceutical Applications,2022-2032 (US$ billion, AGR%, CAGR%)
Table 214 Rest of Asia Pacific Synthetic Biology Market Forecast by Drug Discovery and Therapeutics,2022-2032 (US$ billion, AGR%, CAGR%)
Table 215 Rest of Asia Pacific Synthetic Biology Market Forecast by Artificial Tissue & Tissue Regeneration,2022-2032 (US$ billion, AGR%, CAGR%)
Table 216 Rest of Asia Pacific Synthetic Biology Market Forecast by Industrial Applications,2022-2032 (US$ billion, AGR%, CAGR%)
Table 217 Rest of Asia Pacific Synthetic Biology Market Forecast by Industrial Enzymes,2022-2032 (US$ billion, AGR%, CAGR%)
Table 218 Rest of Asia Pacific Synthetic Biology Market Forecast by Environmental Applications,2022-2032 (US$ billion, AGR%, CAGR%)
Table 219 Latin America Synthetic Biology Market Forecast by Country,2022-2032 (US$ billion, AGR%, CAGR%)
Table 220 Latin America Synthetic Biology Market Forecast by Product Type,2022-2032 (US$ billion, AGR%, CAGR%)
Table 221 Latin America Synthetic Biology Market Forecast by Technology,2022-2032 (US$ billion, AGR%, CAGR%)
Table 222 Latin America Synthetic Biology Market Forecast by Application,2022-2032 (US$ billion, AGR%, CAGR%)
Table 223 Latin America Synthetic Biology Market Forecast by Medical & Pharmaceutical Applications,2022-2032 (US$ billion, AGR%, CAGR%)
Table 224 Latin America Synthetic Biology Market Forecast by Drug Discovery and Therapeutics,2022-2032 (US$ billion, AGR%, CAGR%)
Table 225 Latin America Synthetic Biology Market Forecast by Artificial Tissue & Tissue Regeneration,2022-2032 (US$ billion, AGR%, CAGR%)
Table 226 Latin America Synthetic Biology Market Forecast by Industrial Applications,2022-2032 (US$ billion, AGR%, CAGR%)
Table 227 Latin America Synthetic Biology Market Forecast by Industrial Enzymes,2022-2032 (US$ billion, AGR%, CAGR%)
Table 228 Latin America Synthetic Biology Market Forecast by Environmental Applications,2022-2032 (US$ billion, AGR%, CAGR%)
Table 229 Brazil Synthetic Biology Market Forecast,2022-2032 (US$ billion, AGR%, CAGR%)
Table 230 Brazil Synthetic Biology Market Forecast by Product Type,2022-2032 (US$ billion, AGR%, CAGR%)
Table 231 Brazil Synthetic Biology Market Forecast by Technology,2022-2032 (US$ billion, AGR%, CAGR%)
Table 232 Brazil Synthetic Biology Market Forecast by Application,2022-2032 (US$ billion, AGR%, CAGR%)
Table 233 Brazil Synthetic Biology Market Forecast by Medical & Pharmaceutical Applications,2022-2032 (US$ billion, AGR%, CAGR%)
Table 234 Brazil Synthetic Biology Market Forecast by Drug Discovery and Therapeutics,2022-2032 (US$ billion, AGR%, CAGR%)
Table 235 Brazil Synthetic Biology Market Forecast by Artificial Tissue & Tissue Regeneration,2022-2032 (US$ billion, AGR%, CAGR%)
Table 236 Brazil Synthetic Biology Market Forecast by Industrial Applications,2022-2032 (US$ billion, AGR%, CAGR%)
Table 237 Brazil Synthetic Biology Market Forecast by Industrial Enzymes,2022-2032 (US$ billion, AGR%, CAGR%)
Table 238 Brazil Synthetic Biology Market Forecast by Environmental Applications,2022-2032 (US$ billion, AGR%, CAGR%)
Table 239 Mexico Synthetic Biology Market Forecast,2022-2032 (US$ billion, AGR%, CAGR%)
Table 240 Mexico Synthetic Biology Market Forecast by Product Type,2022-2032 (US$ billion, AGR%, CAGR%)
Table 241 Mexico Synthetic Biology Market Forecast by Technology,2022-2032 (US$ billion, AGR%, CAGR%)
Table 242 Mexico Synthetic Biology Market Forecast by Application,2022-2032 (US$ billion, AGR%, CAGR%)
Table 243 Mexico Synthetic Biology Market Forecast by Medical & Pharmaceutical Applications,2022-2032 (US$ billion, AGR%, CAGR%)
Table 244 Mexico Synthetic Biology Market Forecast by Drug Discovery and Therapeutics,2022-2032 (US$ billion, AGR%, CAGR%)
Table 245 Mexico Synthetic Biology Market Forecast by Artificial Tissue & Tissue Regeneration,2022-2032 (US$ billion, AGR%, CAGR%)
Table 246 Mexico Synthetic Biology Market Forecast by Industrial Applications,2022-2032 (US$ billion, AGR%, CAGR%)
Table 247 Mexico Synthetic Biology Market Forecast by Industrial Enzymes,2022-2032 (US$ billion, AGR%, CAGR%)
Table 248 Mexico Synthetic Biology Market Forecast by Environmental Applications,2022-2032 (US$ billion, AGR%, CAGR%)
Table 249 Argentina Synthetic Biology Market Forecast,2022-2032 (US$ billion, AGR%, CAGR%)
Table 250 Argentina Synthetic Biology Market Forecast by Product Type,2022-2032 (US$ billion, AGR%, CAGR%)
Table 251 Argentina Synthetic Biology Market Forecast by Technology,2022-2032 (US$ billion, AGR%, CAGR%)
Table 252 Argentina Synthetic Biology Market Forecast by Application,2022-2032 (US$ billion, AGR%, CAGR%)
Table 253 Argentina Synthetic Biology Market Forecast by Medical & Pharmaceutical Applications,2022-2032 (US$ billion, AGR%, CAGR%)
Table 254 Argentina Synthetic Biology Market Forecast by Drug Discovery and Therapeutics,2022-2032 (US$ billion, AGR%, CAGR%)
Table 255 Argentina Synthetic Biology Market Forecast by Artificial Tissue & Tissue Regeneration,2022-2032 (US$ billion, AGR%, CAGR%)
Table 256 Argentina Synthetic Biology Market Forecast by Industrial Applications,2022-2032 (US$ billion, AGR%, CAGR%)
Table 257 Argentina Synthetic Biology Market Forecast by Industrial Enzymes,2022-2032 (US$ billion, AGR%, CAGR%)
Table 258 Argentina Synthetic Biology Market Forecast by Environmental Applications,2022-2032 (US$ billion, AGR%, CAGR%)
Table 259 Rest of Latin America Synthetic Biology Market Forecast,2022-2032 (US$ billion, AGR%, CAGR%)
Table 260 Rest of Latin America Synthetic Biology Market Forecast by Product Type,2022-2032 (US$ billion, AGR%, CAGR%)
Table 261 Rest of Latin America Synthetic Biology Market Forecast by Technology,2022-2032 (US$ billion, AGR%, CAGR%)
Table 262 Rest of Latin America Synthetic Biology Market Forecast by Application,2022-2032 (US$ billion, AGR%, CAGR%)
Table 263 Rest of Latin America Synthetic Biology Market Forecast by Medical & Pharmaceutical Applications,2022-2032 (US$ billion, AGR%, CAGR%)
Table 264 Rest of Latin America Synthetic Biology Market Forecast by Drug Discovery and Therapeutics,2022-2032 (US$ billion, AGR%, CAGR%)
Table 265 Rest of Latin America Synthetic Biology Market Forecast by Artificial Tissue & Tissue Regeneration,2022-2032 (US$ billion, AGR%, CAGR%)
Table 266 Rest of Latin America Synthetic Biology Market Forecast by Industrial Applications,2022-2032 (US$ billion, AGR%, CAGR%)
Table 267 Rest of Latin America Synthetic Biology Market Forecast by Industrial Enzymes,2022-2032 (US$ billion, AGR%, CAGR%)
Table 268 Rest of Latin America Synthetic Biology Market Forecast by Environmental Applications,2022-2032 (US$ billion, AGR%, CAGR%)
Table 269 MEA Synthetic Biology Market Forecast by Country,2022-2032 (US$ billion, AGR%, CAGR%)
Table 270 MEA Synthetic Biology Market Forecast by Product Type,2022-2032 (US$ billion, AGR%, CAGR%)
Table 271 MEA Synthetic Biology Market Forecast by Technology,2022-2032 (US$ billion, AGR%, CAGR%)
Table 272 MEA Synthetic Biology Market Forecast by Application,2022-2032 (US$ billion, AGR%, CAGR%)
Table 273 MEA Synthetic Biology Market Forecast by Medical & Pharmaceutical Applications,2022-2032 (US$ billion, AGR%, CAGR%)
Table 274 MEA Synthetic Biology Market Forecast by Drug Discovery and Therapeutics,2022-2032 (US$ billion, AGR%, CAGR%)
Table 275 MEA Synthetic Biology Market Forecast by Artificial Tissue & Tissue Regeneration,2022-2032 (US$ billion, AGR%, CAGR%)
Table 276 MEA Synthetic Biology Market Forecast by Industrial Applications,2022-2032 (US$ billion, AGR%, CAGR%)
Table 277 MEA Synthetic Biology Market Forecast by Industrial Enzymes,2022-2032 (US$ billion, AGR%, CAGR%)
Table 278 MEA Synthetic Biology Market Forecast by Environmental Applications,2022-2032 (US$ billion, AGR%, CAGR%)
Table 279 Turkey Synthetic Biology Market Forecast,2022-2032 (US$ billion, AGR%, CAGR%)
Table 280 Turkey Synthetic Biology Market Forecast by Product Type,2022-2032 (US$ billion, AGR%, CAGR%)
Table 281 Turkey Synthetic Biology Market Forecast by Technology,2022-2032 (US$ billion, AGR%, CAGR%)
Table 282 Turkey Synthetic Biology Market Forecast by Application,2022-2032 (US$ billion, AGR%, CAGR%)
Table 283 Turkey Synthetic Biology Market Forecast by Medical & Pharmaceutical Applications,2022-2032 (US$ billion, AGR%, CAGR%)
Table 284 Turkey Synthetic Biology Market Forecast by Drug Discovery and Therapeutics,2022-2032 (US$ billion, AGR%, CAGR%)
Table 285 Turkey Synthetic Biology Market Forecast by Artificial Tissue & Tissue Regeneration,2022-2032 (US$ billion, AGR%, CAGR%)
Table 286 Turkey Synthetic Biology Market Forecast by Industrial Applications,2022-2032 (US$ billion, AGR%, CAGR%)
Table 287 Turkey Synthetic Biology Market Forecast by Industrial Enzymes,2022-2032 (US$ billion, AGR%, CAGR%)
Table 288 Turkey Synthetic Biology Market Forecast by Environmental Applications,2022-2032 (US$ billion, AGR%, CAGR%)
Table 289 Saudi Arabia Synthetic Biology Market Forecast,2022-2032 (US$ billion, AGR%, CAGR%)
Table 290 Saudi Arabia Synthetic Biology Market Forecast by Product Type,2022-2032 (US$ billion, AGR%, CAGR%)
Table 291 Saudi Arabia Synthetic Biology Market Forecast by Technology,2022-2032 (US$ billion, AGR%, CAGR%)
Table 292 Saudi Arabia Synthetic Biology Market Forecast by Application,2022-2032 (US$ billion, AGR%, CAGR%)
Table 293 Saudi Arabia Synthetic Biology Market Forecast by Medical & Pharmaceutical Applications,2022-2032 (US$ billion, AGR%, CAGR%)
Table 294 Saudi Arabia Synthetic Biology Market Forecast by Drug Discovery and Therapeutics,2022-2032 (US$ billion, AGR%, CAGR%)
Table 295 Saudi Arabia Synthetic Biology Market Forecast by Artificial Tissue & Tissue Regeneration,2022-2032 (US$ billion, AGR%, CAGR%)
Table 296 Saudi Arabia Synthetic Biology Market Forecast by Industrial Applications,2022-2032 (US$ billion, AGR%, CAGR%)
Table 297 Saudi Arabia Synthetic Biology Market Forecast by Industrial Enzymes,2022-2032 (US$ billion, AGR%, CAGR%)
Table 298 Saudi Arabia Synthetic Biology Market Forecast by Environmental Applications,2022-2032 (US$ billion, AGR%, CAGR%)
Table 299 South Africa Synthetic Biology Market Forecast,2022-2032 (US$ billion, AGR%, CAGR%)
Table 300 South Africa Synthetic Biology Market Forecast by Product Type,2022-2032 (US$ billion, AGR%, CAGR%)
Table 301 South Africa Synthetic Biology Market Forecast by Technology,2022-2032 (US$ billion, AGR%, CAGR%)
Table 302 South Africa Synthetic Biology Market Forecast by Application,2022-2032 (US$ billion, AGR%, CAGR%)
Table 303 South Africa Synthetic Biology Market Forecast by Medical & Pharmaceutical Applications,2022-2032 (US$ billion, AGR%, CAGR%)
Table 304 South Africa Synthetic Biology Market Forecast by Drug Discovery and Therapeutics,2022-2032 (US$ billion, AGR%, CAGR%)
Table 305 South Africa Synthetic Biology Market Forecast by Artificial Tissue & Tissue Regeneration,2022-2032 (US$ billion, AGR%, CAGR%)
Table 306 South Africa Synthetic Biology Market Forecast by Industrial Applications,2022-2032 (US$ billion, AGR%, CAGR%)
Table 307 South Africa Synthetic Biology Market Forecast by Industrial Enzymes,2022-2032 (US$ billion, AGR%, CAGR%)
Table 308 South Africa Synthetic Biology Market Forecast by Environmental Applications,2022-2032 (US$ billion, AGR%, CAGR%)
Table 309 UAE Synthetic Biology Market Forecast,2022-2032 (US$ billion, AGR%, CAGR%)
Table 310 UAE Synthetic Biology Market Forecast by Product Type,2022-2032 (US$ billion, AGR%, CAGR%)
Table 311 UAE Synthetic Biology Market Forecast by Technology,2022-2032 (US$ billion, AGR%, CAGR%)
Table 312 UAE Synthetic Biology Market Forecast by Application,2022-2032 (US$ billion, AGR%, CAGR%)
Table 313 UAE Synthetic Biology Market Forecast by Medical & Pharmaceutical Applications,2022-2032 (US$ billion, AGR%, CAGR%)
Table 314 UAE Synthetic Biology Market Forecast by Drug Discovery and Therapeutics,2022-2032 (US$ billion, AGR%, CAGR%)
Table 315 UAE Synthetic Biology Market Forecast by Artificial Tissue & Tissue Regeneration,2022-2032 (US$ billion, AGR%, CAGR%)
Table 316 UAE Synthetic Biology Market Forecast by Industrial Applications,2022-2032 (US$ billion, AGR%, CAGR%)
Table 317 MEA Synthetic Biology Market Forecast by Industrial Enzymes,2022-2032 (US$ billion, AGR%, CAGR%)
Table 318 UAE Synthetic Biology Market Forecast by Environmental Applications,2022-2032 (US$ billion, AGR%, CAGR%)
Table 319 Egypt Synthetic Biology Market Forecast,2022-2032 (US$ billion, AGR%, CAGR%)
Table 320 Egypt Synthetic Biology Market Forecast by Product Type,2022-2032 (US$ billion, AGR%, CAGR%)
Table 321 Egypt Synthetic Biology Market Forecast by Technology,2022-2032 (US$ billion, AGR%, CAGR%)
Table 322 Egypt Synthetic Biology Market Forecast by Application,2022-2032 (US$ billion, AGR%, CAGR%)
Table 323 Egypt Synthetic Biology Market Forecast by Medical & Pharmaceutical Applications,2022-2032 (US$ billion, AGR%, CAGR%)
Table 324 MEA Synthetic Biology Market Forecast by Drug Discovery and Therapeutics,2022-2032 (US$ billion, AGR%, CAGR%)
Table 325 Egypt Synthetic Biology Market Forecast by Artificial Tissue & Tissue Regeneration,2022-2032 (US$ billion, AGR%, CAGR%)
Table 326 Egypt Synthetic Biology Market Forecast by Industrial Applications,2022-2032 (US$ billion, AGR%, CAGR%)
Table 327 Egypt Synthetic Biology Market Forecast by Industrial Enzymes,2022-2032 (US$ billion, AGR%, CAGR%)
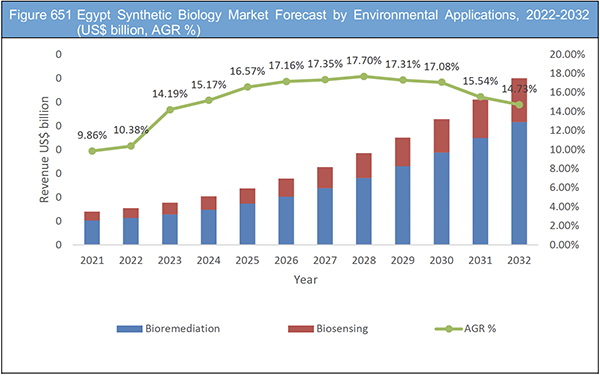
Table 328 Egypt Synthetic Biology Market Forecast by Environmental Applications,2022-2032 (US$ billion, AGR%, CAGR%)
Table 329 Rest of MEA Synthetic Biology Market Forecast,2022-2032 (US$ billion, AGR%, CAGR%)
Table 330 Rest of MEA Synthetic Biology Market Forecast by Product Type,2022-2032 (US$ billion, AGR%, CAGR%)
Table 331 Rest of MEA Synthetic Biology Market Forecast by Technology,2022-2032 (US$ billion, AGR%, CAGR%)
Table 332 Rest of MEA Synthetic Biology Market Forecast by Application,2022-2032 (US$ billion, AGR%, CAGR%)
Table 333 Rest of MEA Synthetic Biology Market Forecast by Medical & Pharmaceutical Applications,2022-2032 (US$ billion, AGR%, CAGR%)
Table 334 Rest of MEA Synthetic Biology Market Forecast by Drug Discovery and Therapeutics,2022-2032 (US$ billion, AGR%, CAGR%)
Table 335 Rest of MEA Synthetic Biology Market Forecast by Artificial Tissue & Tissue Regeneration,2022-2032 (US$ billion, AGR%, CAGR%)
Table 336 Rest of MEA Synthetic Biology Market Forecast by Industrial Applications,2022-2032 (US$ billion, AGR%, CAGR%)
Table 337 Rest of MEA Synthetic Biology Market Forecast by Industrial Enzymes,2022-2032 (US$ billion, AGR%, CAGR%)
Table 338 Rest of MEA Synthetic Biology Market Forecast by Environmental Applications,2022-2032 (US$ billion, AGR%, CAGR%)
Table 1 Thermo Fisher Scientific Inc.: Key Details, (CEO, HQ, Revenue, Founded, No. of Employees, Company Type, Website, Business Segment)
Table 2 Thermo Fisher Scientific Inc.: Product Benchmarking
Table 3 Thermo Fisher Scientific Inc.: Strategic Outlook
Table 4 Agilent Technologies Inc.: Key Details, (CEO, HQ, Revenue, Founded, No. of Employees, Company Type, Website, Business Segment)
Table 5 Agilent Technologies Inc.: Product Benchmarking
Table 6 Agilent Technologies Inc.: Strategic Outlook
Table 7 Merck KGaA: Key Details, (CEO, HQ, Revenue, Founded, No. of Employees, Company Type, Website, Business Segment)
Table 8 Merck KGaA: Product Benchmarking
Table 9 Merck KGaA.: Strategic Outlook
Table 10 Genscript Biotech Corporation: Key Details, (CEO, HQ, Revenue, Founded, No. of Employees, Company Type, Website, Business Segment)
Table 11 Genscript Biotech Corporation: Product Benchmarking
Table 12 Genscript Biotech Corporation.: Strategic Outlook
Table 13 Precigen Inc.: Key Details, (CEO, HQ, Revenue, Founded, No. of Employees, Company Type, Website, Business Segment)
Table 14 Precigen Inc.: Product Benchmarking
Table 15 Precigen Inc..: Strategic Outlook
Table 16 Synthetic Genomics (Viridos): Key Details, (CEO, HQ, Revenue, Founded, No. of Employees, Company Type, Website, Business Segment)
Table 17 Synthetic Genomics (Viridos): Product Benchmarking
Table 18 Synthetic Genomics (Viridos).: Strategic Outlook
Table 19 Ginkgo Bioworks: Key Details, (CEO, HQ, Revenue, Founded, No. of Employees, Company Type, Website, Business Segment)
Table 20 Ginkgo Bioworks: Product Benchmarking
Table 21 Ginkgo Bioworks.: Strategic Outlook
Table 22 New England Biolabs: Key Details, (CEO, HQ, Revenue, Founded, No. of Employees, Company Type, Website, Business Segment)
Table 23 New England Biolabs: Product Benchmarking
Table 24 New England Biolabs.: Strategic Outlook
Table 25 Danaher Corporation: Key Details, (CEO, HQ, Revenue, Founded, No. of Employees, Company Type, Website, Business Segment)
Table 26 Danaher Corporation: Product Benchmarking
Table 27 Danaher Corporation.: Strategic Outlook
Table 28 Twist Bioscience Corp.: Key Details, (CEO, HQ, Revenue, Founded, No. of Employees, Company Type, Website, Business Segment)
Table 29 Twist Bioscience Corp.: Product Benchmarking
Table 30 Twist Bioscience Corp.: Strategic Outlook
Table 31 Codexis, Inc.: Key Details, (CEO, HQ, Revenue, Founded, No. of Employees, Company Type, Website, Business Segment)
Table 32 Codexis, Inc.: Product Benchmarking
Table 33 Codexis, Inc.: Strategic Outlook
Table 34 Amyris, Inc.: Key Details, (CEO, HQ, Revenue, Founded, No. of Employees, Company Type, Website, Business Segment)
Table 35 Amyris, Inc.: Product Benchmarking
Table 36 Amyris, Inc.: Strategic Outlook
Table 37 GRO Biosciences: Key Details, (CEO, HQ, Revenue, Founded, No. of Employees, Company Type, Website, Business Segment)
Table 38 GRO Biosciences: Product Benchmarking
Table 39 Synlogic: Key Details, (CEO, HQ, Revenue, Founded, No. of Employees, Company Type, Website, Business Segment)
Table 40 Synlogic: Product Benchmarking
Table 41 Synlogic: Strategic Outlook
Table 42 ElevateBio: Key Details, (CEO, HQ, Revenue, Founded, No. of Employees, Company Type, Website, Business Segment)
Table 43 ElevateBio: Product Benchmarking
Table 44 ElevateBio: Strategic Outlook
図の一覧
Figure 1 Global Synthetic Biology Market Segmentation
Figure 2 Global Synthetic Biology Market Forecast by Region: Market Attractiveness Index
Figure 3 Global Synthetic Biology Market by Product Type: Market Attractiveness Index
Figure 4 Global Synthetic Biology Market by Technology: Market Attractiveness Index
Figure 5 Global Synthetic Biology Market by Application: Market Attractiveness Index
Figure 6 Global Synthetic Biology Market: Market Dynamics
Figure 7 Global COVID Impact Analysis: Synthetic Biology Market Recovery Scenarios
Figure 8 Global Synthetic Biology Market by Region, 2022-2032 (USD billion, AGR (%), CAGR (%)): “V” Shaped Recovery
Figure 9 Global Synthetic Biology Market by Region, 2022-2032 (USD billion, AGR (%), CAGR (%)): “U” Shaped Recovery
Figure 10 Global Synthetic Biology Market by Region, 2022-2032 (USD billion, AGR (%), CAGR (%)): “W” Shaped Recovery
Figure 11 Global Synthetic Biology Market by Region, 2022-2032 (USD billion, AGR (%), CAGR (%)): “L” Shaped Recovery
Figure 12 Global Synthetic Biology Market: Porter’s Five Forces Analysis
Figure 13 Global Synthetic Biology Market Forecast by Therapeutics 2022, 2027, 2032 (Revenue, CAGR%)
Figure 14 Global Synthetic Biology Market Share Forecast by Therapeutics, 2022, 2032 (%)
Figure 15 Oligonucleotides & Synthetic DNA Market Forecast by Region, 2022-2032 (US$ billion)
Figure 16 Oligonucleotides & Synthetic DNA Market Share Forecast by Region, 2022-2032 (%)
Figure 17 Enzymes Market Forecast by Region, 2022-2032 (US$ billion)
Figure 18 Enzymes Market Share Forecast by Region, 2022-2032 (%)
Figure 19 Cloning Technology Kits Market Forecast by Region, 2022-2032 (US$ billion)
Figure 20 Cloning Technology Kits Market Share Forecast by Region, 2022-2032 (%)
Figure 21 Synthetic Cells Market Forecast by Region, 2022-2032 (US$ billion)
Figure 22 Synthetic Cells Market Share Forecast by Region, 2022-2032 (%)
Figure 23 Synthetic Genes Market Forecast by Region, 2022-2032 (US$ billion)
Figure 24 Synthetic Genes Market Share Forecast by Region, 2022-2032 (%)
Figure 25 Synthetic Clones Market Forecast by Region, 2022-2032 (US$ billion)
Figure 26 Synthetic Clones Market Share Forecast by Region, 2022-2032 (%)
Figure 27 Chassis Organisms Market Forecast by Region, 2022-2032 (US$ billion)
Figure 28 Chassis Organisms Market Share Forecast by Region, 2022-2032 (%)
Figure 29 Xeno-Nucleic Acids Market Forecast by Region, 2022-2032 (US$ billion)
Figure 30 Xeno-Nucleic Acids Market Share Forecast by Region, 2022-2032 (%)
Figure 31 Other Product Types Market Forecast by Region, 2022-2032 (US$ billion)
Figure 32 Other Product Types Market Share Forecast by Region, 2022-2032 (%)
Figure 33 Global Synthetic Biology Market Forecast by Product Type, 2022-2032 (US$ billion, AGR %)
Figure 34 Global Synthetic Biology Market Share Forecast by Therapeutics, 2022, 2027, 2032 (%)
Figure 35 Global Synthetic Biology Market Forecast by Therapeutics 2022, 2027, 2032 (Revenue, CAGR%)
Figure 36 Global Synthetic Biology Market Share Forecast by Technology, 2022, 2032 (%)
Figure 37 Gene Synthesis Market Forecast by Region, 2022-2032 (US$ billion)
Figure 38 Gene Synthesis Market Share Forecast by Region, 2022-2032 (%)
Figure 39 Genome Engineering Market Forecast by Region, 2022-2032 (US$ billion)
Figure 40 Genome Engineering Market Share Forecast by Region, 2022-2032 (%)
Figure 41 Sequencing Market Forecast by Region, 2022-2032 (US$ billion)
Figure 42 Sequencing Market Share Forecast by Region, 2022-2032 (%)
Figure 43 Bioinformatics Market Forecast by Region, 2022-2032 (US$ billion)
Figure 44 Bioinformatics Market Share Forecast by Region, 2022-2032 (%)
Figure 45 Cloning Market Forecast by Region, 2022-2032 (US$ billion)
Figure 46 Cloning Market Share Forecast by Region, 2022-2032 (%)
Figure 47 Site-Directed Mutagenesis Market Forecast by Region, 2022-2032 (US$ billion)
Figure 48 Site-Directed Mutagenesis Market Share Forecast by Region, 2022-2032 (%)
Figure 49 Measurement & Modelling Market Forecast by Region, 2022-2032 (US$ billion)
Figure 50 Measurement & Modelling Market Share Forecast by Region, 2022-2032 (%)
Figure 51 Microfluidics Market Forecast by Region, 2022-2032 (US$ billion)
Figure 52 Microfluidics Market Share Forecast by Region, 2022-2032 (%)
Figure 53 Nanotechnology Market Forecast by Region, 2022-2032 (US$ billion)
Figure 54 Nanotechnology Market Share Forecast by Region, 2022-2032 (%)
Figure 55 Other Technologies Market Forecast by Region, 2022-2032 (US$ billion)
Figure 56 Other Technologies Market Share Forecast by Region, 2022-2032 (%)
Figure 57 Global Synthetic Biology Market Forecast by Technology, 2022-2032 (US$ billion, AGR %)
Figure 58 Global Synthetic Biology Market Share Forecast by Therapeutics, 2022, 2027, 2032 (%)
Figure 59 Global Synthetic Biology Market Forecast by Therapeutics 2022, 2027, 2032 (Revenue, CAGR%)
Figure 60 Global Synthetic Biology Market Share Forecast by Application, 2022, 2032 (%)
Figure 61 Medical & Pharmaceutical Applications Market Forecast by Region, 2022-2032 (US$ billion)
Figure 62 Medical & Pharmaceutical Applications Market Share Forecast by Region, 2022-2032 (%)
Figure 63 Drug Discovery and Therapeutics Market Forecast by Region, 2022-2032 (US$ billion)
Figure 64 Drug Discovery and Therapeutics Market Share Forecast by Region, 2022-2032 (%)
Figure 65 Cancer Detection & Diagnostics Market Forecast by Region, 2022-2032 (US$ billion)
Figure 66 Cancer Detection & Diagnostics Market Share Forecast by Region, 2022-2032 (%)
Figure 67 Other Drug Discovery and Therapeutic Applications Market Forecast by Region, 2022-2032 (US$ billion)
Figure 68 Other Drug Discovery and Therapeutic Applications Market Share Forecast by Region, 2022-2032 (%)
Figure 69 Artificial Tissue & Tissue Regeneration Market Forecast by Region, 2022-2032 (US$ billion)
Figure 70 Artificial Tissue & Tissue Regeneration Market Share Forecast by Region, 2022-2032 (%)
Figure 71 Bio-Synthesis Market Forecast by Region, 2022-2032 (US$ billion)
Figure 72 Bio-Synthesis Market Share Forecast by Region, 2022-2032 (%)
Figure 73 Stem Cell Regulation Market Forecast by Region, 2022-2032 (US$ billion)
Figure 74 Stem Cell Regulation Market Share Forecast by Region, 2022-2032 (%)
Figure 75 Other Artificial Tissue and Tissue Regeneration Applications Market Forecast by Region, 2022-2032 (US$ billion)
Figure 76 Other Artificial Tissue and Tissue Regeneration Applications Market Share Forecast by Region, 2022-2032 (%)
Figure 77 Industrial Applications Market Forecast by Region, 2022-2032 (US$ billion)
Figure 78 Industrial Applications Market Share Forecast by Region, 2022-2032 (%)
Figure 79 Biofuel and Renewable Energy Market Forecast by Region, 2022-2032 (US$ billion)
Figure 80 Biofuel and Renewable Energy Market Share Forecast by Region, 2022-2032 (%)
Figure 81 Industrial Enzymes Market Forecast by Region, 2022-2032 (US$ billion)
Figure 82 Industrial Enzymes Market Share Forecast by Region, 2022-2032 (%)
Figure 83 Textile Industry Market Forecast by Region, 2022-2032 (US$ billion)
Figure 84 Textile Industry Market Share Forecast by Region, 2022-2032 (%)
Figure 85 Paper Industry Market Forecast by Region, 2022-2032 (US$ billion)
Figure 86 Paper Industry Market Share Forecast by Region, 2022-2032 (%)
Figure 87 Other Industries Market Forecast by Region, 2022-2032 (US$ billion)
Figure 88 Other Industries Market Share Forecast by Region, 2022-2032 (%)
Figure 89 Biomaterials & Green Chemicals Market Forecast by Region, 2022-2032 (US$ billion)
Figure 90 Biomaterials & Green Chemicals Market Share Forecast by Region, 2022-2032 (%)
Figure 91 Food & Agriculture Market Forecast by Region, 2022-2032 (US$ billion)
Figure 92 Food & Agriculture Market Share Forecast by Region, 2022-2032 (%)
Figure 93 Environmental Applications Market Forecast by Region, 2022-2032 (US$ billion)
Figure 94 Environmental Applications Market Share Forecast by Region, 2022-2032 (%)
Figure 95 Bioremediation Market Forecast by Region, 2022-2032 (US$ billion)
Figure 96 Bioremediation Market Share Forecast by Region, 2022-2032 (%)
Figure 97 Biosensing Market Forecast by Region, 2022-2032 (US$ billion)
Figure 98 Biosensing Market Share Forecast by Region, 2022-2032 (%)
Figure 99 Other Applications Market Forecast by Region, 2022-2032 (US$ billion)
Figure 100 Other Applications Market Share Forecast by Region, 2022-2032 (%)
Figure 101 Global Synthetic Biology Market Forecast by Therapeutics, 2022-2032 (US$ billion, AGR %)
Figure 102 Global Synthetic Biology Market Share Forecast by Application, 2022, 2027, 2032 (%)
Figure 103 Global Synthetic Biology Market Forecast by Region 2022, 2027, 2032 (Revenue, CAGR%)
Figure 104 Global Synthetic Biology Market Share Forecast by Region 2022, 2027, 2032(%)
Figure 105 Global Synthetic Biology Market by Region, 2022-2032 (USD billion, AGR (%), CAGR (%))
Figure 106 North America Synthetic Biology Market Attractiveness Index
Figure 107 North America Synthetic Biology Market by Region, 2022, 2027 & 2032 (US$ billion)
Figure 108 North America Synthetic Biology Market Forecast by Country, 2022-2032 (US$ billion, AGR %)
Figure 109 North America Synthetic Biology Market Share Forecast by Country, 2022 & 2032 (%)
Figure 110 North America Synthetic Biology Market Forecast by Product Type, 2022-2032 (US$ billion, AGR %)
Figure 111 North America Synthetic Biology Market Share Forecast by Product Type, 2022 & 2032 (%)
Figure 112 North America Synthetic Biology Market Forecast by Technology, 2022-2032 (US$ billion, AGR %)
Figure 113 North America Synthetic Biology Market Share Forecast by Technology, 2022 & 2032 (%)
Figure 114 North America Synthetic Biology Market Forecast by Application, 2022-2032 (US$ billion, AGR %)
Figure 115 North America Synthetic Biology Market Share Forecast by Application, 2022 & 2032 (%)
Figure 116 North America Synthetic Biology Market Forecast by Medical & Pharmaceutical Applications, 2022-2032 (US$ billion, AGR %)
Figure 117 North America Synthetic Biology Market Share Forecast by Medical & Pharmaceutical Applications, 2022 & 2032 (%)
Figure 118 North America Synthetic Biology Market Forecast by Drug Discovery and Therapeutics, 2022-2032 (US$ billion, AGR %)
Figure 119 North America Synthetic Biology Market Share Forecast by Drug Discovery and Therapeutics, 2022 & 2032 (%)
Figure 120 North America Synthetic Biology Market Forecast by Artificial Tissue & Tissue Regeneration, 2022-2032 (US$ billion, AGR %)
Figure 121 North America Synthetic Biology Market Share Forecast by Artificial Tissue & Tissue Regeneration, 2022 & 2032 (%)
Figure 122 North America Synthetic Biology Market Forecast by Industrial Applications, 2022-2032 (US$ billion, AGR %)
Figure 123 North America Synthetic Biology Market Share Forecast by Industrial Applications, 2022 & 2032 (%)
Figure 124 North America Synthetic Biology Market Forecast by Industrial Enzymes, 2022-2032 (US$ billion, AGR %)
Figure 125 North America Synthetic Biology Market Share Forecast by Industrial Enzymes, 2022 & 2032 (%)
Figure 126 North America Synthetic Biology Market Forecast by Environmental Applications, 2022-2032 (US$ billion, AGR %)
Figure 127 North America Synthetic Biology Market Share Forecast by Environmental Applications, 2022 & 2032 (%)
Figure 128 U.S. Synthetic Biology Market Forecast, 2022-2032 (US$ billion, AGR %)
Figure 129 U.S. Synthetic Biology Market Forecast by Product Type, 2022-2032 (US$ billion, AGR %)
Figure 130 U.S. Synthetic Biology Market Share Forecast by Product Type, 2022 & 2032 (%)
Figure 131 U.S. Synthetic Biology Market Forecast by Technology, 2022-2032 (US$ billion, AGR %)
Figure 132 U.S. Synthetic Biology Market Share Forecast by Technology, 2022 & 2032 (%)
Figure 133 U.S. Synthetic Biology Market Forecast by Application, 2022-2032 (US$ billion, AGR %)
Figure 134 U.S. Synthetic Biology Market Share Forecast by Application, 2022 & 2032 (%)
Figure 135 U.S. Synthetic Biology Market Forecast by Medical & Pharmaceutical Applications, 2022-2032 (US$ billion, AGR %)
Figure 136 U.S. Synthetic Biology Market Share Forecast by Medical & Pharmaceutical Applications, 2022 & 2032 (%)
Figure 137 U.S. Synthetic Biology Market Forecast by Drug Discovery and Therapeutics, 2022-2032 (US$ billion, AGR %)
Figure 138 U.S. Synthetic Biology Market Share Forecast by Drug Discovery and Therapeutics, 2022 & 2032 (%)
Figure 139 U.S. Synthetic Biology Market Forecast by Artificial Tissue & Tissue Regeneration, 2022-2032 (US$ billion, AGR %)
Figure 140 U.S. Synthetic Biology Market Share Forecast by Artificial Tissue & Tissue Regeneration, 2022 & 2032 (%)
Figure 141 U.S. Synthetic Biology Market Forecast by Industrial Applications, 2022-2032 (US$ billion, AGR %)
Figure 142 U.S. Synthetic Biology Market Share Forecast by Industrial Applications, 2022 & 2032 (%)
Figure 143 U.S. Synthetic Biology Market Forecast by Industrial Enzymes, 2022-2032 (US$ billion, AGR %)
Figure 144 U.S. Synthetic Biology Market Share Forecast by Industrial Enzymes, 2022 & 2032 (%)
Figure 145 U.S. Synthetic Biology Market Forecast by Environmental Applications, 2022-2032 (US$ billion, AGR %)
Figure 146 U.S. Synthetic Biology Market Share Forecast by Environmental Applications, 2022 & 2032 (%)
Figure 147 Canada Synthetic Biology Market Forecast, 2022-2032 (US$ billion, AGR %)
Figure 148 Canada Synthetic Biology Market Forecast by Product Type, 2022-2032 (US$ billion, AGR %)
Figure 149 Canada Synthetic Biology Market Share Forecast by Product Type, 2022 & 2032 (%)
Figure 150 Canada Synthetic Biology Market Forecast by Technology, 2022-2032 (US$ billion, AGR %)
Figure 151 Canada Synthetic Biology Market Share Forecast by Technology, 2022 & 2032 (%)
Figure 152 Canada Synthetic Biology Market Forecast by Application, 2022-2032 (US$ billion, AGR %)
Figure 153 Canada Synthetic Biology Market Share Forecast by End-users, 2022 & 2032 (%)
Figure 154 Canada Synthetic Biology Market Forecast by Medical & Pharmaceutical Applications, 2022-2032 (US$ billion, AGR %)
Figure 155 Canada Synthetic Biology Market Share Forecast by Medical & Pharmaceutical Applications, 2022 & 2032 (%)
Figure 156 Canada Synthetic Biology Market Forecast by Drug Discovery and Therapeutics, 2022-2032 (US$ billion, AGR %)
Figure 157 Canada Synthetic Biology Market Share Forecast by Drug Discovery and Therapeutics, 2022 & 2032 (%)
Figure 158 Canada Synthetic Biology Market Forecast by Artificial Tissue & Tissue Regeneration, 2022-2032 (US$ billion, AGR %)
Figure 159 Canada Synthetic Biology Market Share Forecast by Artificial Tissue & Tissue Regeneration, 2022 & 2032 (%)
Figure 160 Canada Synthetic Biology Market Forecast by Industrial Applications, 2022-2032 (US$ billion, AGR %)
Figure 161 Canada Synthetic Biology Market Share Forecast by Industrial Applications, 2022 & 2032 (%)
Figure 162 Canada Synthetic Biology Market Forecast by Industrial Enzymes, 2022-2032 (US$ billion, AGR %)
Figure 163 Canada Synthetic Biology Market Share Forecast by Industrial Enzymes, 2022 & 2032 (%)
Figure 164 Canada Synthetic Biology Market Forecast by Environmental Applications, 2022-2032 (US$ billion, AGR %)
Figure 165 Canada Synthetic Biology Market Share Forecast by Environmental Applications, 2022 & 2032 (%)
Figure 166 Europe Synthetic Biology Market Attractiveness Index
Figure 167 Europe Synthetic Biology Market by Region, 2022, 2027 & 2032 (US$ billion)
Figure 168 Europe Synthetic Biology Market Forecast by Country, 2022-2032 (US$ billion, AGR %)
Figure 169 Europe Synthetic Biology Market Share Forecast by Country, 2022 & 2032 (%)
Figure 170 Europe Synthetic Biology Market Forecast by Product Type, 2022-2032 (US$ billion, AGR %)
Figure 171 Europe Synthetic Biology Market Share Forecast by Product Type, 2022 & 2032 (%)
Figure 172 Europe Synthetic Biology Market Forecast by Technology, 2022-2032 (US$ billion, AGR %)
Figure 173 Europe Synthetic Biology Market Share Forecast by Technology, 2022 & 2032 (%)
Figure 174 Europe Synthetic Biology Market Forecast by Application, 2022-2032 (US$ billion, AGR %)
Figure 175 Europe Synthetic Biology Market Share Forecast by Application, 2022 & 2032 (%)
Figure 176 Europe Synthetic Biology Market Forecast by Medical & Pharmaceutical Applications, 2022-2032 (US$ billion, AGR %)
Figure 177 Europe Synthetic Biology Market Share Forecast by Medical & Pharmaceutical Applications, 2022 & 2032 (%)
Figure 178 Europe Synthetic Biology Market Forecast by Drug Discovery and Therapeutics, 2022-2032 (US$ billion, AGR %)
Figure 179 Europe Synthetic Biology Market Share Forecast by Drug Discovery and Therapeutics, 2022 & 2032 (%)
Figure 180 Europe Synthetic Biology Market Forecast by Artificial Tissue & Tissue Regeneration, 2022-2032 (US$ billion, AGR %)
Figure 181 Europe Synthetic Biology Market Share Forecast by Artificial Tissue & Tissue Regeneration, 2022 & 2032 (%)
Figure 182 Europe Synthetic Biology Market Forecast by Industrial Applications, 2022-2032 (US$ billion, AGR %)
Figure 183 Europe Synthetic Biology Market Share Forecast by Industrial Applications, 2022 & 2032 (%)
Figure 184 Europe Synthetic Biology Market Forecast by Industrial Enzymes, 2022-2032 (US$ billion, AGR %)
Figure 185 Europe Synthetic Biology Market Share Forecast by Industrial Enzymes, 2022 & 2032 (%)
Figure 186 Europe Synthetic Biology Market Forecast by Environmental Applications, 2022-2032 (US$ billion, AGR %)
Figure 187 Europe Synthetic Biology Market Share Forecast by Environmental Applications, 2022 & 2032 (%)
Figure 188 Germany Synthetic Biology Market Forecast, 2022-2032 (US$ billion, AGR %)
Figure 189 Germany Synthetic Biology Market Forecast by Product Type, 2022-2032 (US$ billion, AGR %)
Figure 190 Germany Synthetic Biology Market Share Forecast by Product Type, 2022 & 2032 (%)
Figure 191 Germany Synthetic Biology Market Forecast by Technology, 2022-2032 (US$ billion, AGR %)
Figure 192 Germany Synthetic Biology Market Share Forecast by Technology, 2022 & 2032 (%)
Figure 193 Germany Synthetic Biology Market Forecast by Application, 2022-2032 (US$ billion, AGR %)
Figure 194 Germany Synthetic Biology Market Share Forecast by Application, 2022 & 2032 (%)
Figure 195 Germany Synthetic Biology Market Forecast by Medical & Pharmaceutical Applications, 2022-2032 (US$ billion, AGR %)
Figure 196 Germany Synthetic Biology Market Share Forecast by Medical & Pharmaceutical Applications, 2022 & 2032 (%)
Figure 197 Germany Synthetic Biology Market Forecast by Drug Discovery and Therapeutics, 2022-2032 (US$ billion, AGR %)
Figure 198 Germany Synthetic Biology Market Share Forecast by Drug Discovery and Therapeutics, 2022 & 2032 (%)
Figure 199 Germany Synthetic Biology Market Forecast by Artificial Tissue & Tissue Regeneration, 2022-2032 (US$ billion, AGR %)
Figure 200 Germany Synthetic Biology Market Share Forecast by Artificial Tissue & Tissue Regeneration, 2022 & 2032 (%)
Figure 201 Germany Synthetic Biology Market Forecast by Industrial Applications, 2022-2032 (US$ billion, AGR %)
Figure 202 Germany Synthetic Biology Market Share Forecast by Industrial Applications, 2022 & 2032 (%)
Figure 203 Germany Synthetic Biology Market Forecast by Industrial Enzymes, 2022-2032 (US$ billion, AGR %)
Figure 204 Germany Synthetic Biology Market Share Forecast by Industrial Enzymes, 2022 & 2032 (%)
Figure 205 Germany Synthetic Biology Market Forecast by Environmental Applications, 2022-2032 (US$ billion, AGR %)
Figure 206 Germany Synthetic Biology Market Share Forecast by Environmental Applications, 2022 & 2032 (%)
Figure 207 France Synthetic Biology Market Forecast, 2022-2032 (US$ billion, AGR %)
Figure 208 France Synthetic Biology Market Forecast by Product Type, 2022-2032 (US$ billion, AGR %)
Figure 209 France Synthetic Biology Market Share Forecast by Product Type, 2022 & 2032 (%)
Figure 210 France Synthetic Biology Market Forecast by Technology, 2022-2032 (US$ billion, AGR %)
Figure 211 France Synthetic Biology Market Share Forecast by Technology, 2022 & 2032 (%)
Figure 212 France Synthetic Biology Market Forecast by Application, 2022-2032 (US$ billion, AGR %)
Figure 213 France Synthetic Biology Market Share Forecast by End-users, 2022 & 2032 (%)
Figure 214 France Synthetic Biology Market Forecast by Medical & Pharmaceutical Applications, 2022-2032 (US$ billion, AGR %)
Figure 215 France Synthetic Biology Market Share Forecast by Medical & Pharmaceutical Applications, 2022 & 2032 (%)
Figure 216 France Synthetic Biology Market Forecast by Drug Discovery and Therapeutics, 2022-2032 (US$ billion, AGR %)
Figure 217 France Synthetic Biology Market Share Forecast by Drug Discovery and Therapeutics, 2022 & 2032 (%)
Figure 218 France Synthetic Biology Market Forecast by Artificial Tissue & Tissue Regeneration, 2022-2032 (US$ billion, AGR %)
Figure 219 France Synthetic Biology Market Share Forecast by Artificial Tissue & Tissue Regeneration, 2022 & 2032 (%)
Figure 220 France Synthetic Biology Market Forecast by Industrial Applications, 2022-2032 (US$ billion, AGR %)
Figure 221 France Synthetic Biology Market Share Forecast by Industrial Applications, 2022 & 2032 (%)
Figure 222 France Synthetic Biology Market Forecast by Industrial Enzymes, 2022-2032 (US$ billion, AGR %)
Figure 223 France Synthetic Biology Market Share Forecast by Industrial Enzymes, 2022 & 2032 (%)
Figure 224 France Synthetic Biology Market Forecast by Environmental Applications, 2022-2032 (US$ billion, AGR %)
Figure 225 France Synthetic Biology Market Share Forecast by Environmental Applications, 2022 & 2032 (%)
Figure 226 UK Synthetic Biology Market Forecast, 2022-2032 (US$ billion, AGR %)
Figure 227 UK Synthetic Biology Market Forecast by Product Type, 2022-2032 (US$ billion, AGR %)
Figure 228 UK Synthetic Biology Market Share Forecast by Product Type, 2022 & 2032 (%)
Figure 229 UK Synthetic Biology Market Forecast by Technology, 2022-2032 (US$ billion, AGR %)
Figure 230 UK Synthetic Biology Market Share Forecast by Technology, 2022 & 2032 (%)
Figure 231 UK Synthetic Biology Market Forecast by Application, 2022-2032 (US$ billion, AGR %)
Figure 232 UK Synthetic Biology Market Share Forecast by Application, 2022 & 2032 (%)
Figure 233 UK Synthetic Biology Market Forecast by Medical & Pharmaceutical Applications, 2022-2032 (US$ billion, AGR %)
Figure 234 UK Synthetic Biology Market Share Forecast by Medical & Pharmaceutical Applications, 2022 & 2032 (%)
Figure 235 UK Synthetic Biology Market Forecast by Drug Discovery and Therapeutics, 2022-2032 (US$ billion, AGR %)
Figure 236 UK Synthetic Biology Market Share Forecast by Drug Discovery and Therapeutics, 2022 & 2032 (%)
Figure 237 UK Synthetic Biology Market Forecast by Artificial Tissue & Tissue Regeneration, 2022-2032 (US$ billion, AGR %)
Figure 238 UK Synthetic Biology Market Share Forecast by Artificial Tissue & Tissue Regeneration, 2022 & 2032 (%)
Figure 239 UK Synthetic Biology Market Forecast by Industrial Applications, 2022-2032 (US$ billion, AGR %)
Figure 240 UK Synthetic Biology Market Share Forecast by Industrial Applications, 2022 & 2032 (%)
Figure 241 UK Synthetic Biology Market Forecast by Industrial Enzymes, 2022-2032 (US$ billion, AGR %)
Figure 242 UK Synthetic Biology Market Share Forecast by Industrial Enzymes, 2022 & 2032 (%)
Figure 243 UK Synthetic Biology Market Forecast by Environmental Applications, 2022-2032 (US$ billion, AGR %)
Figure 244 UK Synthetic Biology Market Share Forecast by Environmental Applications, 2022 & 2032 (%)
Figure 245 Italy Synthetic Biology Market Forecast, 2022-2032 (US$ billion, AGR %)
Figure 246 Italy Synthetic Biology Market Forecast by Product Type, 2022-2032 (US$ billion, AGR %)
Figure 247 Italy Synthetic Biology Market Share Forecast by Product Type, 2022 & 2032 (%)
Figure 248 Italy Synthetic Biology Market Forecast by Technology, 2022-2032 (US$ billion, AGR %)
Figure 249 Italy Synthetic Biology Market Share Forecast by Technology, 2022 & 2032 (%)
Figure 250 Italy Synthetic Biology Market Forecast by Application, 2022-2032 (US$ billion, AGR %)
Figure 251 Italy Synthetic Biology Market Share Forecast by End-users, 2022 & 2032 (%)
Figure 252 Italy Synthetic Biology Market Forecast by Medical & Pharmaceutical Applications, 2022-2032 (US$ billion, AGR %)
Figure 253 Italy Synthetic Biology Market Share Forecast by Medical & Pharmaceutical Applications, 2022 & 2032 (%)
Figure 254 Italy Synthetic Biology Market Forecast by Drug Discovery and Therapeutics, 2022-2032 (US$ billion, AGR %)
Figure 255 Italy Synthetic Biology Market Share Forecast by Drug Discovery and Therapeutics, 2022 & 2032 (%)
Figure 256 Italy Synthetic Biology Market Forecast by Artificial Tissue & Tissue Regeneration, 2022-2032 (US$ billion, AGR %)
Figure 257 Italy Synthetic Biology Market Share Forecast by Artificial Tissue & Tissue Regeneration, 2022 & 2032 (%)
Figure 258 Italy Synthetic Biology Market Forecast by Industrial Applications, 2022-2032 (US$ billion, AGR %)
Figure 259 Italy Synthetic Biology Market Share Forecast by Industrial Applications, 2022 & 2032 (%)
Figure 260 Italy Synthetic Biology Market Forecast by Industrial Enzymes, 2022-2032 (US$ billion, AGR %)
Figure 261 Italy Synthetic Biology Market Share Forecast by Industrial Enzymes, 2022 & 2032 (%)
Figure 262 Italy Synthetic Biology Market Forecast by Environmental Applications, 2022-2032 (US$ billion, AGR %)
Figure 263 Italy Synthetic Biology Market Share Forecast by Environmental Applications, 2022 & 2032 (%)
Figure 264 Spain Synthetic Biology Market Forecast, 2022-2032 (US$ billion, AGR %)
Figure 265 Spain Synthetic Biology Market Forecast by Product Type, 2022-2032 (US$ billion, AGR %)
Figure 266 Spain Synthetic Biology Market Share Forecast by Product Type, 2022 & 2032 (%)
Figure 267 Spain Synthetic Biology Market Forecast by Technology, 2022-2032 (US$ billion, AGR %)
Figure 268 Spain Synthetic Biology Market Share Forecast by Technology, 2022 & 2032 (%)
Figure 269 Spain Synthetic Biology Market Forecast by Application, 2022-2032 (US$ billion, AGR %)
Figure 270 Spain Synthetic Biology Market Share Forecast by Application, 2022 & 2032 (%)
Figure 271 Spain Synthetic Biology Market Forecast by Medical & Pharmaceutical Applications, 2022-2032 (US$ billion, AGR %)
Figure 272 Spain Synthetic Biology Market Share Forecast by Medical & Pharmaceutical Applications, 2022 & 2032 (%)
Figure 273 Spain Synthetic Biology Market Forecast by Drug Discovery and Therapeutics, 2022-2032 (US$ billion, AGR %)
Figure 274 Spain Synthetic Biology Market Share Forecast by Drug Discovery and Therapeutics, 2022 & 2032 (%)
Figure 275 Spain Synthetic Biology Market Forecast by Artificial Tissue & Tissue Regeneration, 2022-2032 (US$ billion, AGR %)
Figure 276 Spain Synthetic Biology Market Share Forecast by Artificial Tissue & Tissue Regeneration, 2022 & 2032 (%)
Figure 277 Spain Synthetic Biology Market Forecast by Industrial Applications, 2022-2032 (US$ billion, AGR %)
Figure 278 Spain Synthetic Biology Market Share Forecast by Industrial Applications, 2022 & 2032 (%)
Figure 279 Spain Synthetic Biology Market Forecast by Industrial Enzymes, 2022-2032 (US$ billion, AGR %)
Figure 280 Spain Synthetic Biology Market Share Forecast by Industrial Enzymes, 2022 & 2032 (%)
Figure 281 Spain Synthetic Biology Market Forecast by Environmental Applications, 2022-2032 (US$ billion, AGR %)
Figure 282 Spain Synthetic Biology Market Share Forecast by Environmental Applications, 2022 & 2032 (%)
Figure 283 Rest of Europe Synthetic Biology Market Forecast, 2022-2032 (US$ billion, AGR %)
Figure 284 Rest of Europe Synthetic Biology Market Forecast by Product Type, 2022-2032 (US$ billion, AGR %)
Figure 285 Rest of Europe Synthetic Biology Market Share Forecast by Product Type, 2022 & 2032 (%)
Figure 286 Rest of Europe Synthetic Biology Market Forecast by Technology, 2022-2032 (US$ billion, AGR %)
Figure 287 Rest of Europe Synthetic Biology Market Share Forecast by Technology, 2022 & 2032 (%)
Figure 288 Rest of Europe Synthetic Biology Market Forecast by Application, 2022-2032 (US$ billion, AGR %)
Figure 289 Rest of Europe Synthetic Biology Market Share Forecast by End-users, 2022 & 2032 (%)
Figure 290 Rest of Europe Synthetic Biology Market Forecast by Medical & Pharmaceutical Applications, 2022-2032 (US$ billion, AGR %)
Figure 291 Rest of Europe Synthetic Biology Market Share Forecast by Medical & Pharmaceutical Applications, 2022 & 2032 (%)
Figure 292 Rest of Europe Synthetic Biology Market Forecast by Drug Discovery and Therapeutics, 2022-2032 (US$ billion, AGR %)
Figure 293 Rest of Europe Synthetic Biology Market Share Forecast by Drug Discovery and Therapeutics, 2022 & 2032 (%)
Figure 294 Rest of Europe Synthetic Biology Market Forecast by Artificial Tissue & Tissue Regeneration, 2022-2032 (US$ billion, AGR %)
Figure 295 Rest of Europe Synthetic Biology Market Share Forecast by Artificial Tissue & Tissue Regeneration, 2022 & 2032 (%)
Figure 296 Rest of Europe Synthetic Biology Market Forecast by Industrial Applications, 2022-2032 (US$ billion, AGR %)
Figure 297 Rest of Europe Synthetic Biology Market Share Forecast by Industrial Applications, 2022 & 2032 (%)
Figure 298 Rest of Europe Synthetic Biology Market Forecast by Industrial Enzymes, 2022-2032 (US$ billion, AGR %)
Figure 299 Rest of Europe Synthetic Biology Market Share Forecast by Industrial Enzymes, 2022 & 2032 (%)
Figure 300 Rest of Europe Synthetic Biology Market Forecast by Environmental Applications, 2022-2032 (US$ billion, AGR %)
Figure 301 Rest of Europe Synthetic Biology Market Share Forecast by Environmental Applications, 2022 & 2032 (%)
Figure 302 Asia Pacific Synthetic Biology Market Attractiveness Index
Figure 303 Asia Pacific Synthetic Biology Market by Region, 2022, 2027 & 2032 (US$ billion)
Figure 304 Asia Pacific Synthetic Biology Market Forecast by Country, 2022-2032 (US$ billion, AGR %)
Figure 305 Asia Pacific Synthetic Biology Market Share Forecast by Country, 2022 & 2032 (%)
Figure 306 Asia Pacific Synthetic Biology Market Forecast by Product Type, 2022-2032 (US$ billion, AGR %)
Figure 307 Asia Pacific Synthetic Biology Market Share Forecast by Product Type, 2022 & 2032 (%)
Figure 308 Asia Pacific Synthetic Biology Market Forecast by Technology, 2022-2032 (US$ billion, AGR %)
Figure 309 Asia Pacific Synthetic Biology Market Share Forecast by Technology, 2022 & 2032 (%)
Figure 310 Asia Pacific Synthetic Biology Market Forecast by Application, 2022-2032 (US$ billion, AGR %)
Figure 311 Asia Pacific Synthetic Biology Market Share Forecast by Application, 2022 & 2032 (%)
Figure 312 Asia Pacific Synthetic Biology Market Forecast by Medical & Pharmaceutical Applications, 2022-2032 (US$ billion, AGR %)
Figure 313 Asia Pacific Synthetic Biology Market Share Forecast by Medical & Pharmaceutical Applications, 2022 & 2032 (%)
Figure 314 Asia Pacific Synthetic Biology Market Forecast by Drug Discovery and Therapeutics, 2022-2032 (US$ billion, AGR %)
Figure 315 Asia Pacific Synthetic Biology Market Share Forecast by Drug Discovery and Therapeutics, 2022 & 2032 (%)
Figure 316 Asia Pacific Synthetic Biology Market Forecast by Artificial Tissue & Tissue Regeneration, 2022-2032 (US$ billion, AGR %)
Figure 317 Asia Pacific Synthetic Biology Market Share Forecast by Artificial Tissue & Tissue Regeneration, 2022 & 2032 (%)
Figure 318 Asia Pacific Synthetic Biology Market Forecast by Industrial Applications, 2022-2032 (US$ billion, AGR %)
Figure 319 Asia Pacific Synthetic Biology Market Share Forecast by Industrial Applications, 2022 & 2032 (%)
Figure 320 Asia Pacific Synthetic Biology Market Forecast by Industrial Enzymes, 2022-2032 (US$ billion, AGR %)
Figure 321 Asia Pacific Synthetic Biology Market Share Forecast by Industrial Enzymes, 2022 & 2032 (%)
Figure 322 Asia Pacific Synthetic Biology Market Forecast by Environmental Applications, 2022-2032 (US$ billion, AGR %)
Figure 323 Asia Pacific Synthetic Biology Market Share Forecast by Environmental Applications, 2022 & 2032 (%)
Figure 324 China Synthetic Biology Market Forecast, 2022-2032 (US$ billion, AGR %)
Figure 325 China Synthetic Biology Market Forecast by Product Type, 2022-2032 (US$ billion, AGR %)
Figure 326 China Synthetic Biology Market Share Forecast by Product Type, 2022 & 2032 (%)
Figure 327 China Synthetic Biology Market Forecast by Technology, 2022-2032 (US$ billion, AGR %)
Figure 328 China Synthetic Biology Market Share Forecast by Technology, 2022 & 2032 (%)
Figure 329 China Synthetic Biology Market Forecast by Application, 2022-2032 (US$ billion, AGR %)
Figure 330 China Synthetic Biology Market Share Forecast by Application, 2022 & 2032 (%)
Figure 331 China Synthetic Biology Market Forecast by Medical & Pharmaceutical Applications, 2022-2032 (US$ billion, AGR %)
Figure 332 China Synthetic Biology Market Share Forecast by Medical & Pharmaceutical Applications, 2022 & 2032 (%)
Figure 333 China Synthetic Biology Market Forecast by Drug Discovery and Therapeutics, 2022-2032 (US$ billion, AGR %)
Figure 334 China Synthetic Biology Market Share Forecast by Drug Discovery and Therapeutics, 2022 & 2032 (%)
Figure 335 China Synthetic Biology Market Forecast by Artificial Tissue & Tissue Regeneration, 2022-2032 (US$ billion, AGR %)
Figure 336 China Synthetic Biology Market Share Forecast by Artificial Tissue & Tissue Regeneration, 2022 & 2032 (%)
Figure 337 China Synthetic Biology Market Forecast by Industrial Applications, 2022-2032 (US$ billion, AGR %)
Figure 338 China Synthetic Biology Market Share Forecast by Industrial Applications, 2022 & 2032 (%)
Figure 339 China Synthetic Biology Market Forecast by Industrial Enzymes, 2022-2032 (US$ billion, AGR %)
Figure 340 China Synthetic Biology Market Share Forecast by Industrial Enzymes, 2022 & 2032 (%)
Figure 341 China Synthetic Biology Market Forecast by Environmental Applications, 2022-2032 (US$ billion, AGR %)
Figure 342 China Synthetic Biology Market Share Forecast by Environmental Applications, 2022 & 2032 (%)
Figure 343 Japan Synthetic Biology Market Forecast, 2022-2032 (US$ billion, AGR %)
Figure 344 Japan Synthetic Biology Market Forecast by Product Type, 2022-2032 (US$ billion, AGR %)
Figure 345 Japan Synthetic Biology Market Share Forecast by Product Type, 2022 & 2032 (%)
Figure 346 Japan Synthetic Biology Market Forecast by Technology, 2022-2032 (US$ billion, AGR %)
Figure 347 Japan Synthetic Biology Market Share Forecast by Technology, 2022 & 2032 (%)
Figure 348 Japan Synthetic Biology Market Forecast by Application, 2022-2032 (US$ billion, AGR %)
Figure 349 Japan Synthetic Biology Market Share Forecast by End-users, 2022 & 2032 (%)
Figure 350 Japan Synthetic Biology Market Forecast by Medical & Pharmaceutical Applications, 2022-2032 (US$ billion, AGR %)
Figure 351 Japan Synthetic Biology Market Share Forecast by Medical & Pharmaceutical Applications, 2022 & 2032 (%)
Figure 352 Japan Synthetic Biology Market Forecast by Drug Discovery and Therapeutics, 2022-2032 (US$ billion, AGR %)
Figure 353 Japan Synthetic Biology Market Share Forecast by Drug Discovery and Therapeutics, 2022 & 2032 (%)
Figure 354 Japan Synthetic Biology Market Forecast by Artificial Tissue & Tissue Regeneration, 2022-2032 (US$ billion, AGR %)
Figure 355 Japan Synthetic Biology Market Share Forecast by Artificial Tissue & Tissue Regeneration, 2022 & 2032 (%)
Figure 356 Japan Synthetic Biology Market Forecast by Industrial Applications, 2022-2032 (US$ billion, AGR %)
Figure 357 Japan Synthetic Biology Market Share Forecast by Industrial Applications, 2022 & 2032 (%)
Figure 358 Japan Synthetic Biology Market Forecast by Industrial Enzymes, 2022-2032 (US$ billion, AGR %)
Figure 359 Japan Synthetic Biology Market Share Forecast by Industrial Enzymes, 2022 & 2032 (%)
Figure 360 Japan Synthetic Biology Market Forecast by Environmental Applications, 2022-2032 (US$ billion, AGR %)
Figure 361 Japan Synthetic Biology Market Share Forecast by Environmental Applications, 2022 & 2032 (%)
Figure 362 India Synthetic Biology Market Forecast, 2022-2032 (US$ billion, AGR %)
Figure 363 India Synthetic Biology Market Forecast by Product Type, 2022-2032 (US$ billion, AGR %)
Figure 364 India Synthetic Biology Market Share Forecast by Product Type, 2022 & 2032 (%)
Figure 365 India Synthetic Biology Market Forecast by Technology, 2022-2032 (US$ billion, AGR %)
Figure 366 India Synthetic Biology Market Share Forecast by Technology, 2022 & 2032 (%)
Figure 367 India Synthetic Biology Market Forecast by Application, 2022-2032 (US$ billion, AGR %)
Figure 368 India Synthetic Biology Market Share Forecast by Application, 2022 & 2032 (%)
Figure 369 India Synthetic Biology Market Forecast by Medical & Pharmaceutical Applications, 2022-2032 (US$ billion, AGR %)
Figure 370 India Synthetic Biology Market Share Forecast by Medical & Pharmaceutical Applications, 2022 & 2032 (%)
Figure 371 India Synthetic Biology Market Forecast by Drug Discovery and Therapeutics, 2022-2032 (US$ billion, AGR %)
Figure 372 India Synthetic Biology Market Share Forecast by Drug Discovery and Therapeutics, 2022 & 2032 (%)
Figure 373 India Synthetic Biology Market Forecast by Artificial Tissue & Tissue Regeneration, 2022-2032 (US$ billion, AGR %)
Figure 374 India Synthetic Biology Market Share Forecast by Artificial Tissue & Tissue Regeneration, 2022 & 2032 (%)
Figure 375 India Synthetic Biology Market Forecast by Industrial Applications, 2022-2032 (US$ billion, AGR %)
Figure 376 India Synthetic Biology Market Share Forecast by Industrial Applications, 2022 & 2032 (%)
Figure 377 India Synthetic Biology Market Forecast by Industrial Enzymes, 2022-2032 (US$ billion, AGR %)
Figure 378 India Synthetic Biology Market Share Forecast by Industrial Enzymes, 2022 & 2032 (%)
Figure 379 India Synthetic Biology Market Forecast by Environmental Applications, 2022-2032 (US$ billion, AGR %)
Figure 380 India Synthetic Biology Market Share Forecast by Environmental Applications, 2022 & 2032 (%)
Figure 381 Australia Synthetic Biology Market Forecast, 2022-2032 (US$ billion, AGR %)
Figure 382 Australia Synthetic Biology Market Forecast by Product Type, 2022-2032 (US$ billion, AGR %)
Figure 383 Australia Synthetic Biology Market Share Forecast by Product Type, 2022 & 2032 (%)
Figure 384 Australia Synthetic Biology Market Forecast by Technology, 2022-2032 (US$ billion, AGR %)
Figure 385 Australia Synthetic Biology Market Share Forecast by Technology, 2022 & 2032 (%)
Figure 386 Australia Synthetic Biology Market Forecast by Application, 2022-2032 (US$ billion, AGR %)
Figure 387 Australia Synthetic Biology Market Share Forecast by End-users, 2022 & 2032 (%)
Figure 388 Australia Synthetic Biology Market Forecast by Medical & Pharmaceutical Applications, 2022-2032 (US$ billion, AGR %)
Figure 389 Australia Synthetic Biology Market Share Forecast by Medical & Pharmaceutical Applications, 2022 & 2032 (%)
Figure 390 Australia Synthetic Biology Market Forecast by Drug Discovery and Therapeutics, 2022-2032 (US$ billion, AGR %)
Figure 391 Australia Synthetic Biology Market Share Forecast by Drug Discovery and Therapeutics, 2022 & 2032 (%)
Figure 392 Australia Synthetic Biology Market Forecast by Artificial Tissue & Tissue Regeneration, 2022-2032 (US$ billion, AGR %)
Figure 393 Australia Synthetic Biology Market Share Forecast by Artificial Tissue & Tissue Regeneration, 2022 & 2032 (%)
Figure 394 Australia Synthetic Biology Market Forecast by Industrial Applications, 2022-2032 (US$ billion, AGR %)
Figure 395 Australia Synthetic Biology Market Share Forecast by Industrial Applications, 2022 & 2032 (%)
Figure 396 Australia Synthetic Biology Market Forecast by Industrial Enzymes, 2022-2032 (US$ billion, AGR %)
Figure 397 Australia Synthetic Biology Market Share Forecast by Industrial Enzymes, 2022 & 2032 (%)
Figure 398 Australia Synthetic Biology Market Forecast by Environmental Applications, 2022-2032 (US$ billion, AGR %)
Figure 399 Australia Synthetic Biology Market Share Forecast by Environmental Applications, 2022 & 2032 (%)
Figure 400 South Korea Synthetic Biology Market Forecast, 2022-2032 (US$ billion, AGR %)
Figure 401 South Korea Synthetic Biology Market Forecast by Product Type, 2022-2032 (US$ billion, AGR %)
Figure 402 South Korea Synthetic Biology Market Share Forecast by Product Type, 2022 & 2032 (%)
Figure 403 South Korea Synthetic Biology Market Forecast by Technology, 2022-2032 (US$ billion, AGR %)
Figure 404 South Korea Synthetic Biology Market Share Forecast by Technology, 2022 & 2032 (%)
Figure 405 South Korea Synthetic Biology Market Forecast by Application, 2022-2032 (US$ billion, AGR %)
Figure 406 South Korea Synthetic Biology Market Share Forecast by Application, 2022 & 2032 (%)
Figure 407 South Korea Synthetic Biology Market Forecast by Medical & Pharmaceutical Applications, 2022-2032 (US$ billion, AGR %)
Figure 408 South Korea Synthetic Biology Market Share Forecast by Medical & Pharmaceutical Applications, 2022 & 2032 (%)
Figure 409 South Korea Synthetic Biology Market Forecast by Drug Discovery and Therapeutics, 2022-2032 (US$ billion, AGR %)
Figure 410 South Korea Synthetic Biology Market Share Forecast by Drug Discovery and Therapeutics, 2022 & 2032 (%)
Figure 411 South Korea Synthetic Biology Market Forecast by Artificial Tissue & Tissue Regeneration, 2022-2032 (US$ billion, AGR %)
Figure 412 South Korea Synthetic Biology Market Share Forecast by Artificial Tissue & Tissue Regeneration, 2022 & 2032 (%)
Figure 413 South Korea Synthetic Biology Market Forecast by Industrial Applications, 2022-2032 (US$ billion, AGR %)
Figure 414 South Korea Synthetic Biology Market Share Forecast by Industrial Applications, 2022 & 2032 (%)
Figure 415 South Korea Synthetic Biology Market Forecast by Industrial Enzymes, 2022-2032 (US$ billion, AGR %)
Figure 416 South Korea Synthetic Biology Market Share Forecast by Industrial Enzymes, 2022 & 2032 (%)
Figure 417 South Korea Synthetic Biology Market Forecast by Environmental Applications, 2022-2032 (US$ billion, AGR %)
Figure 418 South Korea Synthetic Biology Market Share Forecast by Environmental Applications, 2022 & 2032 (%)
Figure 419 Rest of Asia Pacific Synthetic Biology Market Forecast, 2022-2032 (US$ billion, AGR %)
Figure 420 Rest of Asia Pacific Synthetic Biology Market Forecast by Product Type, 2022-2032 (US$ billion, AGR %)
Figure 421 Rest of Asia Pacific Synthetic Biology Market Share Forecast by Product Type, 2022 & 2032 (%)
Figure 422 Rest of Asia Pacific Synthetic Biology Market Forecast by Technology, 2022-2032 (US$ billion, AGR %)
Figure 423 Rest of Asia Pacific Synthetic Biology Market Share Forecast by Technology, 2022 & 2032 (%)
Figure 424 Rest of Asia Pacific Synthetic Biology Market Forecast by Application, 2022-2032 (US$ billion, AGR %)
Figure 425 Rest of Asia Pacific Synthetic Biology Market Share Forecast by End-users, 2022 & 2032 (%)
Figure 426 Rest of Asia Pacific Synthetic Biology Market Forecast by Medical & Pharmaceutical Applications, 2022-2032 (US$ billion, AGR %)
Figure 427 Rest of Asia Pacific Synthetic Biology Market Share Forecast by Medical & Pharmaceutical Applications, 2022 & 2032 (%)
Figure 428 Rest of Asia Pacific Synthetic Biology Market Forecast by Drug Discovery and Therapeutics, 2022-2032 (US$ billion, AGR %)
Figure 429 Rest of Asia Pacific Synthetic Biology Market Share Forecast by Drug Discovery and Therapeutics, 2022 & 2032 (%)
Figure 430 Rest of Asia Pacific Synthetic Biology Market Forecast by Artificial Tissue & Tissue Regeneration, 2022-2032 (US$ billion, AGR %)
Figure 431 Rest of Asia Pacific Synthetic Biology Market Share Forecast by Artificial Tissue & Tissue Regeneration, 2022 & 2032 (%)
Figure 432 Rest of Asia Pacific Synthetic Biology Market Forecast by Industrial Applications, 2022-2032 (US$ billion, AGR %)
Figure 433 Rest of Asia Pacific Synthetic Biology Market Share Forecast by Industrial Applications, 2022 & 2032 (%)
Figure 434 Rest of Asia Pacific Synthetic Biology Market Forecast by Industrial Enzymes, 2022-2032 (US$ billion, AGR %)
Figure 435 Rest of Asia Pacific Synthetic Biology Market Share Forecast by Industrial Enzymes, 2022 & 2032 (%)
Figure 436 Rest of Asia Pacific Synthetic Biology Market Forecast by Environmental Applications, 2022-2032 (US$ billion, AGR %)
Figure 437 Rest of Asia Pacific Synthetic Biology Market Share Forecast by Environmental Applications, 2022 & 2032 (%)
Figure 438 Latin America Synthetic Biology Market Attractiveness Index
Figure 439 Latin America Synthetic Biology Market by Region, 2022, 2027 & 2032 (US$ billion)
Figure 440 Latin America Synthetic Biology Market Forecast by Country, 2022-2032 (US$ billion, AGR %)
Figure 441 Latin America Synthetic Biology Market Share Forecast by Country, 2022 & 2032 (%)
Figure 442 Latin America Synthetic Biology Market Forecast by Product Type, 2022-2032 (US$ billion, AGR %)
Figure 443 Latin America Synthetic Biology Market Share Forecast by Product Type, 2022 & 2032 (%)
Figure 444 Latin America Synthetic Biology Market Forecast by Technology, 2022-2032 (US$ billion, AGR %)
Figure 445 Latin America Synthetic Biology Market Share Forecast by Technology, 2022 & 2032 (%)
Figure 446 Latin America Synthetic Biology Market Forecast by Application, 2022-2032 (US$ billion, AGR %)
Figure 447 Latin America Synthetic Biology Market Share Forecast by Application, 2022 & 2032 (%)
Figure 448 Latin America Synthetic Biology Market Forecast by Medical & Pharmaceutical Applications, 2022-2032 (US$ billion, AGR %)
Figure 449 Latin America Synthetic Biology Market Share Forecast by Medical & Pharmaceutical Applications, 2022 & 2032 (%)
Figure 450 Latin America Synthetic Biology Market Forecast by Drug Discovery and Therapeutics, 2022-2032 (US$ billion, AGR %)
Figure 451 Latin America Synthetic Biology Market Share Forecast by Drug Discovery and Therapeutics, 2022 & 2032 (%)
Figure 452 Latin America Synthetic Biology Market Forecast by Artificial Tissue & Tissue Regeneration, 2022-2032 (US$ billion, AGR %)
Figure 453 Latin America Synthetic Biology Market Share Forecast by Artificial Tissue & Tissue Regeneration, 2022 & 2032 (%)
Figure 454 Latin America Synthetic Biology Market Forecast by Industrial Applications, 2022-2032 (US$ billion, AGR %)
Figure 455 Latin America Synthetic Biology Market Share Forecast by Industrial Applications, 2022 & 2032 (%)
Figure 456 Latin America Synthetic Biology Market Forecast by Industrial Enzymes, 2022-2032 (US$ billion, AGR %)
Figure 457 Latin America Synthetic Biology Market Share Forecast by Industrial Enzymes, 2022 & 2032 (%)
Figure 458 Latin America Synthetic Biology Market Forecast by Environmental Applications, 2022-2032 (US$ billion, AGR %)
Figure 459 Latin America Synthetic Biology Market Share Forecast by Environmental Applications, 2022 & 2032 (%)
Figure 460 Brazil Synthetic Biology Market Forecast, 2022-2032 (US$ billion, AGR %)
Figure 461 Brazil Synthetic Biology Market Forecast by Product Type, 2022-2032 (US$ billion, AGR %)
Figure 462 Brazil Synthetic Biology Market Share Forecast by Product Type, 2022 & 2032 (%)
Figure 463 Brazil Synthetic Biology Market Forecast by Technology, 2022-2032 (US$ billion, AGR %)
Figure 464 Brazil Synthetic Biology Market Share Forecast by Technology, 2022 & 2032 (%)
Figure 465 Brazil Synthetic Biology Market Forecast by Application, 2022-2032 (US$ billion, AGR %)
Figure 466 Brazil Synthetic Biology Market Share Forecast by Application, 2022 & 2032 (%)
Figure 467 Brazil Synthetic Biology Market Forecast by Medical & Pharmaceutical Applications, 2022-2032 (US$ billion, AGR %)
Figure 468 Brazil Synthetic Biology Market Share Forecast by Medical & Pharmaceutical Applications, 2022 & 2032 (%)
Figure 469 Brazil Synthetic Biology Market Forecast by Drug Discovery and Therapeutics, 2022-2032 (US$ billion, AGR %)
Figure 470 Brazil Synthetic Biology Market Share Forecast by Drug Discovery and Therapeutics, 2022 & 2032 (%)
Figure 471 Brazil Synthetic Biology Market Forecast by Artificial Tissue & Tissue Regeneration, 2022-2032 (US$ billion, AGR %)
Figure 472 Brazil Synthetic Biology Market Share Forecast by Artificial Tissue & Tissue Regeneration, 2022 & 2032 (%)
Figure 473 Brazil Synthetic Biology Market Forecast by Industrial Applications, 2022-2032 (US$ billion, AGR %)
Figure 474 Brazil Synthetic Biology Market Share Forecast by Industrial Applications, 2022 & 2032 (%)
Figure 475 Brazil Synthetic Biology Market Forecast by Industrial Enzymes, 2022-2032 (US$ billion, AGR %)
Figure 476 Brazil Synthetic Biology Market Share Forecast by Industrial Enzymes, 2022 & 2032 (%)
Figure 477 Brazil Synthetic Biology Market Forecast by Environmental Applications, 2022-2032 (US$ billion, AGR %)
Figure 478 Brazil Synthetic Biology Market Share Forecast by Environmental Applications, 2022 & 2032 (%)
Figure 479 Mexico Synthetic Biology Market Forecast, 2022-2032 (US$ billion, AGR %)
Figure 480 Mexico Synthetic Biology Market Forecast by Product Type, 2022-2032 (US$ billion, AGR %)
Figure 481 Mexico Synthetic Biology Market Share Forecast by Product Type, 2022 & 2032 (%)
Figure 482 Mexico Synthetic Biology Market Forecast by Technology, 2022-2032 (US$ billion, AGR %)
Figure 483 Mexico Synthetic Biology Market Share Forecast by Technology, 2022 & 2032 (%)
Figure 484 Mexico Synthetic Biology Market Forecast by Application, 2022-2032 (US$ billion, AGR %)
Figure 485 Mexico Synthetic Biology Market Share Forecast by End-users, 2022 & 2032 (%)
Figure 486 Mexico Synthetic Biology Market Forecast by Medical & Pharmaceutical Applications, 2022-2032 (US$ billion, AGR %)
Figure 487 Mexico Synthetic Biology Market Share Forecast by Medical & Pharmaceutical Applications, 2022 & 2032 (%)
Figure 488 Mexico Synthetic Biology Market Forecast by Drug Discovery and Therapeutics, 2022-2032 (US$ billion, AGR %)
Figure 489 Mexico Synthetic Biology Market Share Forecast by Drug Discovery and Therapeutics, 2022 & 2032 (%)
Figure 490 Mexico Synthetic Biology Market Forecast by Artificial Tissue & Tissue Regeneration, 2022-2032 (US$ billion, AGR %)
Figure 491 Mexico Synthetic Biology Market Share Forecast by Artificial Tissue & Tissue Regeneration, 2022 & 2032 (%)
Figure 492 Mexico Synthetic Biology Market Forecast by Industrial Applications, 2022-2032 (US$ billion, AGR %)
Figure 493 Mexico Synthetic Biology Market Share Forecast by Industrial Applications, 2022 & 2032 (%)
Figure 494 Mexico Synthetic Biology Market Forecast by Industrial Enzymes, 2022-2032 (US$ billion, AGR %)
Figure 495 Mexico Synthetic Biology Market Share Forecast by Industrial Enzymes, 2022 & 2032 (%)
Figure 496 Mexico Synthetic Biology Market Forecast by Environmental Applications, 2022-2032 (US$ billion, AGR %)
Figure 497 Mexico Synthetic Biology Market Share Forecast by Environmental Applications, 2022 & 2032 (%)
Figure 498 Argentina Synthetic Biology Market Forecast, 2022-2032 (US$ billion, AGR %)
Figure 499 Argentina Synthetic Biology Market Forecast by Product Type, 2022-2032 (US$ billion, AGR %)
Figure 500 Argentina Synthetic Biology Market Share Forecast by Product Type, 2022 & 2032 (%)
Figure 501 Argentina Synthetic Biology Market Forecast by Technology, 2022-2032 (US$ billion, AGR %)
Figure 502 Argentina Synthetic Biology Market Share Forecast by Technology, 2022 & 2032 (%)
Figure 503 Argentina Synthetic Biology Market Forecast by Application, 2022-2032 (US$ billion, AGR %)
Figure 504 Argentina Synthetic Biology Market Share Forecast by Application, 2022 & 2032 (%)
Figure 505 Argentina Synthetic Biology Market Forecast by Medical & Pharmaceutical Applications, 2022-2032 (US$ billion, AGR %)
Figure 506 Argentina Synthetic Biology Market Share Forecast by Medical & Pharmaceutical Applications, 2022 & 2032 (%)
Figure 507 Argentina Synthetic Biology Market Forecast by Drug Discovery and Therapeutics, 2022-2032 (US$ billion, AGR %)
Figure 508 Argentina Synthetic Biology Market Share Forecast by Drug Discovery and Therapeutics, 2022 & 2032 (%)
Figure 509 Argentina Synthetic Biology Market Forecast by Artificial Tissue & Tissue Regeneration, 2022-2032 (US$ billion, AGR %)
Figure 510 Argentina Synthetic Biology Market Share Forecast by Artificial Tissue & Tissue Regeneration, 2022 & 2032 (%)
Figure 511 Argentina Synthetic Biology Market Forecast by Industrial Applications, 2022-2032 (US$ billion, AGR %)
Figure 512 Argentina Synthetic Biology Market Share Forecast by Industrial Applications, 2022 & 2032 (%)
Figure 513 Argentina Synthetic Biology Market Forecast by Industrial Enzymes, 2022-2032 (US$ billion, AGR %)
Figure 514 Argentina Synthetic Biology Market Share Forecast by Industrial Enzymes, 2022 & 2032 (%)
Figure 515 Argentina Synthetic Biology Market Forecast by Environmental Applications, 2022-2032 (US$ billion, AGR %)
Figure 516 Argentina Synthetic Biology Market Share Forecast by Environmental Applications, 2022 & 2032 (%)
Figure 517 Rest of Latin America Synthetic Biology Market Forecast, 2022-2032 (US$ billion, AGR %)
Figure 518 Rest of Latin America Synthetic Biology Market Forecast by Product Type, 2022-2032 (US$ billion, AGR %)
Figure 519 Rest of Latin America Synthetic Biology Market Share Forecast by Product Type, 2022 & 2032 (%)
Figure 520 Rest of Latin America Synthetic Biology Market Forecast by Technology, 2022-2032 (US$ billion, AGR %)
Figure 521 Rest of Latin America Synthetic Biology Market Share Forecast by Technology, 2022 & 2032 (%)
Figure 522 Rest of Latin America Synthetic Biology Market Forecast by Application, 2022-2032 (US$ billion, AGR %)
Figure 523 Rest of Latin America Synthetic Biology Market Share Forecast by End-users, 2022 & 2032 (%)
Figure 524 Rest of Latin America Synthetic Biology Market Forecast by Medical & Pharmaceutical Applications, 2022-2032 (US$ billion, AGR %)
Figure 525 Rest of Latin America Synthetic Biology Market Share Forecast by Medical & Pharmaceutical Applications, 2022 & 2032 (%)
Figure 526 Rest of Latin America Synthetic Biology Market Forecast by Drug Discovery and Therapeutics, 2022-2032 (US$ billion, AGR %)
Figure 527 Rest of Latin America Synthetic Biology Market Share Forecast by Drug Discovery and Therapeutics, 2022 & 2032 (%)
Figure 528 Rest of Latin America Synthetic Biology Market Forecast by Artificial Tissue & Tissue Regeneration, 2022-2032 (US$ billion, AGR %)
Figure 529 Rest of Latin America Synthetic Biology Market Share Forecast by Artificial Tissue & Tissue Regeneration, 2022 & 2032 (%)
Figure 530 Rest of Latin America Synthetic Biology Market Forecast by Industrial Applications, 2022-2032 (US$ billion, AGR %)
Figure 531 Rest of Latin America Synthetic Biology Market Share Forecast by Industrial Applications, 2022 & 2032 (%)
Figure 532 Rest of Latin America Synthetic Biology Market Forecast by Industrial Enzymes, 2022-2032 (US$ billion, AGR %)
Figure 533 Rest of Latin America Synthetic Biology Market Share Forecast by Industrial Enzymes, 2022 & 2032 (%)
Figure 534 Rest of Latin America Synthetic Biology Market Forecast by Environmental Applications, 2022-2032 (US$ billion, AGR %)
Figure 535 Rest of Latin America Synthetic Biology Market Share Forecast by Environmental Applications, 2022 & 2032 (%)
Figure 536 MEA Synthetic Biology Market Attractiveness Index
Figure 537 MEA Synthetic Biology Market by Region, 2022, 2027 & 2032 (US$ billion)
Figure 538 MEA Synthetic Biology Market Forecast by Country, 2022-2032 (US$ billion, AGR %)
Figure 539 MEA Synthetic Biology Market Share Forecast by Country, 2022 & 2032 (%)
Figure 540 MEA Synthetic Biology Market Forecast by Product Type, 2022-2032 (US$ billion, AGR %)
Figure 541 MEA Synthetic Biology Market Share Forecast by Product Type, 2022 & 2032 (%)
Figure 542 MEA Synthetic Biology Market Forecast by Technology, 2022-2032 (US$ billion, AGR %)
Figure 543 MEA Synthetic Biology Market Share Forecast by Technology, 2022 & 2032 (%)
Figure 544 MEA Synthetic Biology Market Forecast by Application, 2022-2032 (US$ billion, AGR %)
Figure 545 MEA Synthetic Biology Market Share Forecast by Application, 2022 & 2032 (%)
Figure 546 MEA Synthetic Biology Market Forecast by Medical & Pharmaceutical Applications, 2022-2032 (US$ billion, AGR %)
Figure 547 MEA Synthetic Biology Market Share Forecast by Medical & Pharmaceutical Applications, 2022 & 2032 (%)
Figure 548 MEA Synthetic Biology Market Forecast by Drug Discovery and Therapeutics, 2022-2032 (US$ billion, AGR %)
Figure 549 MEA Synthetic Biology Market Share Forecast by Drug Discovery and Therapeutics, 2022 & 2032 (%)
Figure 550 MEA Synthetic Biology Market Forecast by Artificial Tissue & Tissue Regeneration, 2022-2032 (US$ billion, AGR %)
Figure 551 MEA Synthetic Biology Market Share Forecast by Artificial Tissue & Tissue Regeneration, 2022 & 2032 (%)
Figure 552 MEA Synthetic Biology Market Forecast by Industrial Applications, 2022-2032 (US$ billion, AGR %)
Figure 553 MEA Synthetic Biology Market Share Forecast by Industrial Applications, 2022 & 2032 (%)
Figure 554 MEA Synthetic Biology Market Forecast by Industrial Enzymes, 2022-2032 (US$ billion, AGR %)
Figure 555 MEA Synthetic Biology Market Share Forecast by Industrial Enzymes, 2022 & 2032 (%)
Figure 556 MEA Synthetic Biology Market Forecast by Environmental Applications, 2022-2032 (US$ billion, AGR %)
Figure 557 MEA Synthetic Biology Market Share Forecast by Environmental Applications, 2022 & 2032 (%)
Figure 558 Turkey Synthetic Biology Market Forecast, 2022-2032 (US$ billion, AGR %)
Figure 559 Turkey Synthetic Biology Market Forecast by Product Type, 2022-2032 (US$ billion, AGR %)
Figure 560 Turkey Synthetic Biology Market Share Forecast by Product Type, 2022 & 2032 (%)
Figure 561 Turkey Synthetic Biology Market Forecast by Technology, 2022-2032 (US$ billion, AGR %)
Figure 562 Turkey Synthetic Biology Market Share Forecast by Technology, 2022 & 2032 (%)
Figure 563 Turkey Synthetic Biology Market Forecast by Application, 2022-2032 (US$ billion, AGR %)
Figure 564 Turkey Synthetic Biology Market Share Forecast by Application, 2022 & 2032 (%)
Figure 565 Turkey Synthetic Biology Market Forecast by Medical & Pharmaceutical Applications, 2022-2032 (US$ billion, AGR %)
Figure 566 Turkey Synthetic Biology Market Share Forecast by Medical & Pharmaceutical Applications, 2022 & 2032 (%)
Figure 567 Turkey Synthetic Biology Market Forecast by Drug Discovery and Therapeutics, 2022-2032 (US$ billion, AGR %)
Figure 568 Turkey Synthetic Biology Market Share Forecast by Drug Discovery and Therapeutics, 2022 & 2032 (%)
Figure 569 Turkey Synthetic Biology Market Forecast by Artificial Tissue & Tissue Regeneration, 2022-2032 (US$ billion, AGR %)
Figure 570 Turkey Synthetic Biology Market Share Forecast by Artificial Tissue & Tissue Regeneration, 2022 & 2032 (%)
Figure 571 Turkey Synthetic Biology Market Forecast by Industrial Applications, 2022-2032 (US$ billion, AGR %)
Figure 572 Turkey Synthetic Biology Market Share Forecast by Industrial Applications, 2022 & 2032 (%)
Figure 573 Turkey Synthetic Biology Market Forecast by Industrial Enzymes, 2022-2032 (US$ billion, AGR %)
Figure 574 Turkey Synthetic Biology Market Share Forecast by Industrial Enzymes, 2022 & 2032 (%)
Figure 575 Turkey Synthetic Biology Market Forecast by Environmental Applications, 2022-2032 (US$ billion, AGR %)
Figure 576 Turkey Synthetic Biology Market Share Forecast by Environmental Applications, 2022 & 2032 (%)
Figure 577 Saudi Arabia Synthetic Biology Market Forecast, 2022-2032 (US$ billion, AGR %)
Figure 578 Saudi Arabia Synthetic Biology Market Forecast by Product Type, 2022-2032 (US$ billion, AGR %)
Figure 579 Saudi Arabia Synthetic Biology Market Share Forecast by Product Type, 2022 & 2032 (%)
Figure 580 Saudi Arabia Synthetic Biology Market Forecast by Technology, 2022-2032 (US$ billion, AGR %)
Figure 581 Saudi Arabia Synthetic Biology Market Share Forecast by Technology, 2022 & 2032 (%)
Figure 582 Saudi Arabia Synthetic Biology Market Forecast by Application, 2022-2032 (US$ billion, AGR %)
Figure 583 Saudi Arabia Synthetic Biology Market Share Forecast by End-users, 2022 & 2032 (%)
Figure 584 Saudi Arabia Synthetic Biology Market Forecast by Medical & Pharmaceutical Applications, 2022-2032 (US$ billion, AGR %)
Figure 585 Saudi Arabia Synthetic Biology Market Share Forecast by Medical & Pharmaceutical Applications, 2022 & 2032 (%)
Figure 586 Saudi Arabia Synthetic Biology Market Forecast by Drug Discovery and Therapeutics, 2022-2032 (US$ billion, AGR %)
Figure 587 Saudi Arabia Synthetic Biology Market Share Forecast by Drug Discovery and Therapeutics, 2022 & 2032 (%)
Figure 588 Saudi Arabia Synthetic Biology Market Forecast by Artificial Tissue & Tissue Regeneration, 2022-2032 (US$ billion, AGR %)
Figure 589 Saudi Arabia Synthetic Biology Market Share Forecast by Artificial Tissue & Tissue Regeneration, 2022 & 2032 (%)
Figure 590 Saudi Arabia Synthetic Biology Market Forecast by Industrial Applications, 2022-2032 (US$ billion, AGR %)
Figure 591 Saudi Arabia Synthetic Biology Market Share Forecast by Industrial Applications, 2022 & 2032 (%)
Figure 592 Saudi Arabia Synthetic Biology Market Forecast by Industrial Enzymes, 2022-2032 (US$ billion, AGR %)
Figure 593 Saudi Arabia Synthetic Biology Market Share Forecast by Industrial Enzymes, 2022 & 2032 (%)
Figure 594 Saudi Arabia Synthetic Biology Market Forecast by Environmental Applications, 2022-2032 (US$ billion, AGR %)
Figure 595 Saudi Arabia Synthetic Biology Market Share Forecast by Environmental Applications, 2022 & 2032 (%)
Figure 596 South Africa Synthetic Biology Market Forecast, 2022-2032 (US$ billion, AGR %)
Figure 597 South Africa Synthetic Biology Market Forecast by Product Type, 2022-2032 (US$ billion, AGR %)
Figure 598 South Africa Synthetic Biology Market Share Forecast by Product Type, 2022 & 2032 (%)
Figure 599 South Africa Synthetic Biology Market Forecast by Technology, 2022-2032 (US$ billion, AGR %)
Figure 600 South Africa Synthetic Biology Market Share Forecast by Technology, 2022 & 2032 (%)
Figure 601 South Africa Synthetic Biology Market Forecast by Application, 2022-2032 (US$ billion, AGR %)
Figure 602 South Africa Synthetic Biology Market Share Forecast by Application, 2022 & 2032 (%)
Figure 603 South Africa Synthetic Biology Market Forecast by Medical & Pharmaceutical Applications, 2022-2032 (US$ billion, AGR %)
Figure 604 South Africa Synthetic Biology Market Share Forecast by Medical & Pharmaceutical Applications, 2022 & 2032 (%)
Figure 605 South Africa Synthetic Biology Market Forecast by Drug Discovery and Therapeutics, 2022-2032 (US$ billion, AGR %)
Figure 606 South Africa Synthetic Biology Market Share Forecast by Drug Discovery and Therapeutics, 2022 & 2032 (%)
Figure 607 South Africa Synthetic Biology Market Forecast by Artificial Tissue & Tissue Regeneration, 2022-2032 (US$ billion, AGR %)
Figure 608 South Africa Synthetic Biology Market Share Forecast by Artificial Tissue & Tissue Regeneration, 2022 & 2032 (%)
Figure 609 South Africa Synthetic Biology Market Forecast by Industrial Applications, 2022-2032 (US$ billion, AGR %)
Figure 610 South Africa Synthetic Biology Market Share Forecast by Industrial Applications, 2022 & 2032 (%)
Figure 611 South Africa Synthetic Biology Market Forecast by Industrial Enzymes, 2022-2032 (US$ billion, AGR %)
Figure 612 South Africa Synthetic Biology Market Share Forecast by Industrial Enzymes, 2022 & 2032 (%)
Figure 613 South Africa Synthetic Biology Market Forecast by Environmental Applications, 2022-2032 (US$ billion, AGR %)
Figure 614 South Africa Synthetic Biology Market Share Forecast by Environmental Applications, 2022 & 2032 (%)
Figure 615 UAE Synthetic Biology Market Forecast, 2022-2032 (US$ billion, AGR %)
Figure 616 UAE Synthetic Biology Market Forecast by Product Type, 2022-2032 (US$ billion, AGR %)
Figure 617 UAE Synthetic Biology Market Share Forecast by Product Type, 2022 & 2032 (%)
Figure 618 UAE Synthetic Biology Market Forecast by Technology, 2022-2032 (US$ billion, AGR %)
Figure 619 UAE Synthetic Biology Market Share Forecast by Technology, 2022 & 2032 (%)
Figure 620 UAE Synthetic Biology Market Forecast by Application, 2022-2032 (US$ billion, AGR %)
Figure 621 UAE Synthetic Biology Market Share Forecast by End-users, 2022 & 2032 (%)
Figure 622 UAE Synthetic Biology Market Forecast by Medical & Pharmaceutical Applications, 2022-2032 (US$ billion, AGR %)
Figure 623 UAE Synthetic Biology Market Share Forecast by Medical & Pharmaceutical Applications, 2022 & 2032 (%)
Figure 624 UAE Synthetic Biology Market Forecast by Drug Discovery and Therapeutics, 2022-2032 (US$ billion, AGR %)
Figure 625 UAE Synthetic Biology Market Share Forecast by Drug Discovery and Therapeutics, 2022 & 2032 (%)
Figure 626 UAE Synthetic Biology Market Forecast by Artificial Tissue & Tissue Regeneration, 2022-2032 (US$ billion, AGR %)
Figure 627 UAE Synthetic Biology Market Share Forecast by Artificial Tissue & Tissue Regeneration, 2022 & 2032 (%)
Figure 628 UAE Synthetic Biology Market Forecast by Industrial Applications, 2022-2032 (US$ billion, AGR %)
Figure 629 UAE Synthetic Biology Market Share Forecast by Industrial Applications, 2022 & 2032 (%)
Figure 630 UAE Synthetic Biology Market Forecast by Industrial Enzymes, 2022-2032 (US$ billion, AGR %)
Figure 631 UAE Synthetic Biology Market Share Forecast by Industrial Enzymes, 2022 & 2032 (%)
Figure 632 UAE Synthetic Biology Market Forecast by Environmental Applications, 2022-2032 (US$ billion, AGR %)
Figure 633 UAE Synthetic Biology Market Share Forecast by Environmental Applications, 2022 & 2032 (%)
Figure 634 Egypt Synthetic Biology Market Forecast, 2022-2032 (US$ billion, AGR %)
Figure 635 Egypt Synthetic Biology Market Forecast by Product Type, 2022-2032 (US$ billion, AGR %)
Figure 636 Egypt Synthetic Biology Market Share Forecast by Product Type, 2022 & 2032 (%)
Figure 637 Egypt Synthetic Biology Market Forecast by Technology, 2022-2032 (US$ billion, AGR %)
Figure 638 Egypt Synthetic Biology Market Share Forecast by Technology, 2022 & 2032 (%)
Figure 639 Egypt Synthetic Biology Market Forecast by Application, 2022-2032 (US$ billion, AGR %)
Figure 640 Egypt Synthetic Biology Market Share Forecast by Application, 2022 & 2032 (%)
Figure 641 Egypt Synthetic Biology Market Forecast by Medical & Pharmaceutical Applications, 2022-2032 (US$ billion, AGR %)
Figure 642 Egypt Synthetic Biology Market Share Forecast by Medical & Pharmaceutical Applications, 2022 & 2032 (%)
Figure 643 Egypt Synthetic Biology Market Forecast by Drug Discovery and Therapeutics, 2022-2032 (US$ billion, AGR %)
Figure 644 Egypt Synthetic Biology Market Share Forecast by Drug Discovery and Therapeutics, 2022 & 2032 (%)
Figure 645 Egypt Synthetic Biology Market Forecast by Artificial Tissue & Tissue Regeneration, 2022-2032 (US$ billion, AGR %)
Figure 646 Egypt Synthetic Biology Market Share Forecast by Artificial Tissue & Tissue Regeneration, 2022 & 2032 (%)
Figure 647 Egypt Synthetic Biology Market Forecast by Industrial Applications, 2022-2032 (US$ billion, AGR %)
Figure 648 Egypt Synthetic Biology Market Share Forecast by Industrial Applications, 2022 & 2032 (%)
Figure 649 Egypt Synthetic Biology Market Forecast by Industrial Enzymes, 2022-2032 (US$ billion, AGR %)
Figure 650 Egypt Synthetic Biology Market Share Forecast by Industrial Enzymes, 2022 & 2032 (%)
Figure 651 Egypt Synthetic Biology Market Forecast by Environmental Applications, 2022-2032 (US$ billion, AGR %)
Figure 652 Egypt Synthetic Biology Market Share Forecast by Environmental Applications, 2022 & 2032 (%)
Figure 653 Rest of MEA Synthetic Biology Market Forecast, 2022-2032 (US$ billion, AGR %)
Figure 654 Rest of MEA Synthetic Biology Market Forecast by Product Type, 2022-2032 (US$ billion, AGR %)
Figure 655 Rest of MEA Synthetic Biology Market Share Forecast by Product Type, 2022 & 2032 (%)
Figure 656 Rest of MEA Synthetic Biology Market Forecast by Technology, 2022-2032 (US$ billion, AGR %)
Figure 657 Rest of MEA Synthetic Biology Market Share Forecast by Technology, 2022 & 2032 (%)
Figure 658 Rest of MEA Synthetic Biology Market Forecast by Application, 2022-2032 (US$ billion, AGR %)
Figure 659 Rest of MEA Synthetic Biology Market Share Forecast by End-users, 2022 & 2032 (%)
Figure 660 Rest of MEA Synthetic Biology Market Forecast by Medical & Pharmaceutical Applications, 2022-2032 (US$ billion, AGR %)
Figure 661 Rest of MEA Synthetic Biology Market Share Forecast by Medical & Pharmaceutical Applications, 2022 & 2032 (%)
Figure 662 Rest of MEA Synthetic Biology Market Forecast by Drug Discovery and Therapeutics, 2022-2032 (US$ billion, AGR %)
Figure 663 Rest of MEA Synthetic Biology Market Share Forecast by Drug Discovery and Therapeutics, 2022 & 2032 (%)
Figure 664 Rest of MEA Synthetic Biology Market Forecast by Artificial Tissue & Tissue Regeneration, 2022-2032 (US$ billion, AGR %)
Figure 665 Rest of MEA Synthetic Biology Market Share Forecast by Artificial Tissue & Tissue Regeneration, 2022 & 2032 (%)
Figure 666 Rest of MEA Synthetic Biology Market Forecast by Industrial Applications, 2022-2032 (US$ billion, AGR %)
Figure 667 Rest of MEA Synthetic Biology Market Share Forecast by Industrial Applications, 2022 & 2032 (%)
Figure 668 Rest of MEA Synthetic Biology Market Forecast by Industrial Enzymes, 2022-2032 (US$ billion, AGR %)
Figure 669 Rest of MEA Synthetic Biology Market Share Forecast by Industrial Enzymes, 2022 & 2032 (%)
Figure 670 Rest of MEA Synthetic Biology Market Forecast by Environmental Applications, 2022-2032 (US$ billion, AGR %)
Figure 671 Rest of MEA Synthetic Biology Market Share Forecast by Environmental Applications, 2022 & 2032 (%)
Figure 672 Global Synthetic Biology Market: Company Share Analysis, 2021
Figure 673 Thermo Fisher Scientific Inc.: Net Revenue, 2017-2021 (US$ million, AGR%)
Figure 674 Thermo Fisher Scientific Inc.: Regional Market Shares, 2021
Figure 675 Thermo Fisher Scientific Inc.: Gross Profit, 2017-2021 (US$ million, AGR%)
Figure 676 Thermo Fisher Scientific Inc.: R&D, 2017-2021 (US$ million, AGR%)
Figure 677 Agilent Technologies Inc.: Net Revenue, 2017-2021 (US$ million, AGR%)
Figure 678 Agilent Technologies Inc.: Regional Market Shares, 2021
Figure 679 Agilent Technologies Inc.: Gross Profit, 2017-2021 (US$ million, AGR%)
Figure 680 Agilent Technologies Inc.: R&D, 2017-2021 (US$ million, AGR%)
Figure 681 Merck KGaA: Net Revenue, 2017-2021 (US$ million, AGR%)
Figure 682 Merck KGaA: Regional Market Shares, 2021
Figure 683 Merck KGaA: Gross Profit, 2017-2021 (US$ million, AGR%)
Figure 684 Merck KGaA: R&D, 2017-2021 (US$ million, AGR%)
Figure 685 Genscript Biotech Corporation: Net Revenue, 2017-2021 (US$ million, AGR%)
Figure 686 Genscript Biotech Corporation: Gross Profit, 2017-2021 (US$ million, AGR%)
Figure 687 Genscript Biotech Corporation: R&D, 2017-2021 (US$ million, AGR%)
Figure 688 Precigen Inc.: Net Revenue, 2017-2021 (US$ million, AGR%)
Figure 689 Precigen Inc.: Gross Profit, 2017-2021 (US$ million, AGR%)
Figure 690 Precigen Inc.: R&D, 2017-2021 (US$ million, AGR%)
Figure 691 Ginkgo Bioworks: Net Revenue, 2017-2021 (US$ million, AGR%)
Figure 692 Ginkgo Bioworks: Regional Market Shares, 2021
Figure 693 Ginkgo Bioworks: Gross Profit, 2017-2021 (US$ million, AGR%)
Figure 694 Ginkgo Bioworks: R&D, 2017-2021 (US$ million, AGR%)
Figure 695 Danaher Corporation: Net Revenue, 2017-2021 (US$ million, AGR%)
Figure 696 Danaher Corporation: Regional Market Shares, 2021
Figure 697 Danaher Corporation: Gross Profit, 2017-2021 (US$ million, AGR%)
Figure 698 Danaher Corporation: R&D, 2017-2021 (US$ million, AGR%)
Figure 699 Twist Bioscience Corp.: Net Revenue, 2017-2021 (US$ million, AGR%)
Figure 700 Twist Bioscience Corp.: Regional Market Shares, 2021
Figure 701 Twist Bioscience Corp.: Gross Profit, 2017-2021 (US$ million, AGR%)
Figure 702 Twist Bioscience Corp.: R&D, 2017-2021 (US$ million, AGR%)
Figure 703 Codexis, Inc.: Net Revenue, 2017-2021 (US$ million, AGR%)
Figure 704 Codexis, Inc.: Regional Market Shares, 2021
Figure 705 Codexis, Inc.: Gross Profit, 2017-2021 (US$ million, AGR%)
Figure 706 Codexis, Inc.: R&D, 2017-2021 (US$ million, AGR%)
Figure 707 Amyris, Inc.: Net Revenue, 2017-2021 (US$ million, AGR%)
Figure 708 Amyris, Inc.: Gross Profit, 2017-2021 (US$ million, AGR%)
Figure 709 Amyris, Inc.: R&D, 2017-2021 (US$ million, AGR%)
Figure 710 Synlogic: Net Revenue, 2017-2021 (US$ million, AGR%)
ページTOPに戻る
Summary
この調査レポートは世界の合成生物学市場を調査し、製品タイプ別、技術別、用途別、地域別に2022年から2032年までの予測結果を掲載しています。また関連企業情報を提供しています。
主な掲載内容(目次より抜粋)
-
レポート概要
-
エグゼクティブサマリー
-
プレミアムインサイト
-
市場概要
-
世界の合成生物学市場分析:製品タイプ別
-
世界の合成生物学市場分析:技術別
-
世界の合成生物学市場分析:用途別
-
世界の合成生物学市場分析:地域別
-
北米の合成生物学市場分析
-
欧州の合成生物学市場分析
-
アジア太平洋地域の合成生物学市場分析
-
ラテンアメリカの合成生物学市場分析
-
MEAの合成生物学市場分析
-
競争状況
Report Details
The Synthetic Biology Market Report 2022-2032: This report will prove invaluable to leading firms striving for new revenue pockets if they wish to better understand the industry and its underlying dynamics. It will be useful for companies that would like to expand into different industries or to expand their existing operations in a new region.
Increasing R&D in Biotechnological and Pharmaceutical Businesses
The growing demand for synthetic biology in biotechnological and pharmaceutical research and development leads to the growth of this industry. For example, the pharmaceutical research-based business spends about 149.8 billion USD each year on R&D, according to the International Federation of Pharmaceutical Manufacturers and Associations (IFPMA). Organisms and engineered networks for disease-mechanism elucidation, drug-discovery platforms, drug-target identification, therapeutic delivery, therapeutic treatment, and drug manufacture are examples of synthetic biology contributions to the field of therapeutic. The synthetic biology industry is likely to increase significantly in the near future due to rising demand for medicinal applications.
Environment Safety Challenges May Restrict The Adoption of Synthetic Biology Up to Certain Extent
The deliberate or unintentional introduction of synthetic organisms into the environment during research and other applications poses a significant biosafety issue in synthetic biology. Synthetic bacteria can mutate or interact with other species in the environment, leading in crossbreeding and bio errors. This has the potential to threaten the environment of wild creatures. The emergence of antibiotic-resistant superbugs is another key biosafety worry. In recent years, the European Union (EU) has funded a number of research studies investigating the environmental impact of genetically modified bacteria purposely released for plant growth or bioremediation. However, biosafety, biosecurity, and ethical risks associated with synthetic biology may stymie business growth.
What Questions Should You Ask before Buying a Market Research Report?
• How is the synthetic biology market evolving?
• What is driving and restraining the synthetic biology market?
• How will each synthetic biology submarket segment grow over the forecast period and how much revenue will these submarkets account for in 2032?
• How will the market shares for each synthetic biology submarket develop from 2022 to 2032?
• What will be the main driver for the overall market from 2022 to 2032?
• Will leading synthetic biology markets broadly follow the macroeconomic dynamics, or will individual national markets outperform others?
• How will the market shares of the national markets change by 2032 and which geographical region will lead the market in 2032?
• Who are the leading players and what are their prospects over the forecast period?
• What are the synthetic biology projects for these leading companies?
• How will the industry evolve during the period between 2020 and 2032? What are the implications of synthetic biology projects taking place now and over the next 10 years?
• Is there a greater need for product commercialisation to further scale the synthetic biology market?
• Where is the synthetic biology market heading and how can you ensure you are at the forefront of the market?
• What are the best investment options for new product and service lines?
• What are the key prospects for moving companies into a new growth path and C-suite?
You need to discover how this will impact the synthetic biology market today, and over the next 10 years:
• Our 745-page report provides 355 tables and 710 charts/graphs exclusively to you.
• The report highlights key lucrative areas in the industry so you can target them – NOW.
• It contains in-depth analysis of global, regional and national sales and growth.
• It highlights for you the key successful trends, changes and revenue projections made by your competitors.
This report tells you TODAY how the synthetic biology market will develop in the next 10 years, and in line with the variations in COVID-19 economic recession and bounce. This market is more critical now than at any point over the last 10 years.
The report delivers exclusive COVID-19 variations and economic data specific to your market.
Forecasts to 2032 and other analyses reveal commercial prospects
• In addition to revenue forecasting to 2032, our new study provides you with recent results, growth rates, and market shares.
• You will find original analyses, with business outlooks and developments.
• Discover qualitative analyses (including market dynamics, drivers, opportunities, restraints and challenges), cost structure, impact of rising synthetic biology prices and recent developments.
This report includes data analysis and invaluable insight into how COVID-19 will affect the industry and your company. Four COVID-19 recovery patterns and their impact, namely, “V”, “L”, “W” and “U” are discussed in this report.
Segments Covered in the Report
Product Type Outlook
• Oligonucleotides & Synthetic DNA
• Enzymes
• Cloning Technology Kits
• Synthetic Cells
• Synthetic Genes
• Synthetic Clones
• Chassis Organisms
• Xeno-Nucleic Acids
• Other Product Types
Technology Outlook
• Gene Synthesis
• Genome Engineering
• Sequencing
• Bioinformatics
• Cloning
• Site-Directed Mutagenesis
• Measurement & Modeling
• Microfluidics
• Nanotechnology
• Other Technologies
Application Outlook
• Medical & Pharmaceutical Applications
– Drug Discovery and Therapeutics (Cancer Detection & Diagnostics, Other Drug Discovery and Therapeutic Applications)
– Artificial Tissue & Tissue Regeneration (Bio-Synthesis, Stem Cell Regulation, Other Artificial Tissue and Tissue Regeneration Applications)
• Industrial Applications
– Biofuel and Renewable Energy
– Industrial Enzymes (Textile Industry, Paper Industry, Other Industries)
– Biomaterials & Green Chemicals
• Food & Agriculture
• Environmental Applications
– Bioremediation
– Biosensing
• Other Applications
Operation
• Preclinical
• Clinical
• Commercial
• Other Operations
In addition to the revenue predictions for the overall world market and segments, you will also find revenue forecasts for four regional and 20 leading national markets:
North America
• U.S.
• Canada
Europe
• Germany
• France
• UK
• Italy
• Spain
• Rest of Europe
Asia Pacific
• China
• Japan
• India
• Australia
• South Korea
• Rest of Asia-Pacific
Latin America
• Brazil
• Mexico
• Argentina
• Rest of Latin America
Middle East & Africa
• Turkey
• Saudi Arabia
• South Africa
• UAE
• Egypt
• Rest of Middle East & Africa
The report also includes profiles and for some of the leading companies in the Synthetic Biology Market, 2022 to 2032, with a focus on this segment of these companies’ operations.
Leading companies and the potential for market growth
• Amyris Inc.
• Agilent Technologies Inc.
• Codexis, Inc.
• Danaher Corporation
• ElevateBio
• Genscript Biotech Corporation
• Ginkgo Bioworks
• GRO Biosciences
• Merck KGaA
• New England Biolabs
• Precigen Inc.
• Synthetic Genomics (Viridos)
• Synlogic
• Twist Bioscience Corp.
• Thermo Fisher Scientific Inc.
Overall world revenue for Synthetic Biology Market, 2022 to 2032 in terms of value the market will surpass US$16.9 billion in 2022, our work calculates. We predict strong revenue growth through to 2032. Our work identifies which organizations hold the greatest potential. Discover their capabilities, progress, and commercial prospects, helping you stay ahead.
How will the Synthetic Biology Market, 2022 to 2032 report help you?
In summary, our 740+ page report provides you with the following knowledge:
• Revenue forecasts to 2032 for Synthetic Biology Market, 2022 to 2032 Market, with forecasts for product type, technology, and application, each forecast at a global and regional level – discover the industry’s prospects, finding the most lucrative places for investments and revenues.
• Revenue forecasts to 2032 for five regional and 20 key national markets – See forecasts for the Synthetic Biology Market, 2022 to 2032 market in North America, Europe, Asia-Pacific, Latin America and MEA. Also forecasted is the market in the US, Canada, Brazil, Germany, France, UK, Italy, Spain, China, Japan, India, Australia, South Korea, Brazil, Mexico, Argentina, Turkey, Saudi Arabia, South Africa, UAE and Egypt among other prominent economies.
• Prospects for established firms and those seeking to enter the market – including company profiles for 15 of the major companies involved in the Synthetic Biology Market, 2022 to 2032.
Find quantitative and qualitative analyses with independent predictions. Receive information that only our report contains, staying informed with invaluable business intelligence.
Information found nowhere else
With our new report, you are less likely to fall behind in knowledge or miss out on opportunities. See how our work could benefit your research, analyses, and decisions. Visiongain’s study is for everybody needing commercial analyses for the Synthetic Biology Market, 2022 to 2032, market-leading companies. You will find data, trends and predictions.
ページTOPに戻る
Table of Contents
Table of Contents
1. Report Overview
1.1 Objectives of the Study
1.2 Introduction to Synthetic Biology Market
1.3 What this Report Delivers
1.4 Why you Should Read this Report
1.5 Key Questions Answered by this Analytical Report Include:
1.6 Who is this Report for?
1.7 Methodology
1.7.1 Market Definitions
1.7.2 Market Evaluation & Forecasting Methodology
1.7.3 Data Validation
1.8 Frequently Asked Questions (FAQs)
1.9 Associated Visiongain Reports
1.10 About Visiongain
2 Executive Summary
3 Premium Insights
3.1 Geographical Snapshot: Global Synthetic Biology Market
3.2 Product Type Segment: Market Attractiveness Index
3.3 Technology Segment: Market Attractiveness Index
3.4 Application Segment: Market Attractiveness Index
4 Market Overview
4.1 Key Findings
4.2 Market Dynamics
4.2.1 Market Driving Factors
4.2.2 Market Restraining Factors
4.2.3 Market Opportunities
4.3 COVID-19 Impact Analysis
4.4 Porter’s Five Forces Analysis
4.4.1 Supplier Power
4.4.2 Buyer Power
4.4.3 Competitive Rivalry
4.4.4 Threat from Substitutes
4.4.5 Threat of New Entrants
4.5 PESTLE Analysis
4.5.1 Political- International political cooperation encouraging synthetic biology sector
4.5.2 Economical- Increase in investment concerns for synthetic biology industry development
4.5.3 Social – Rising adoption of synthetic biology due to increasing technology awareness
4.5.4 Technological – Requirement of strong R&D infrastructure for technology adoption
4.5.5 Legal – Stringent regulatory frameworks may create challenges
4.5.6 Environmental – Environmental safety concerns influences business expansion
5 Global Synthetic Biology Market Analysis by Product Type
5.1 Key Findings
5.2 Product Type Segment Growth Prospects
5.3 Global Synthetic Biology Market Share by Product Type, 2022 & 2032
5.4 Oligonucleotides & Synthetic DNA
5.4.1 Oligonucleotides & Synthetic DNA Market Forecast by Region, 2022-2032 (US$ billion)
5.4.2 Oligonucleotides & Synthetic DNA Market Share by Region, 2022-2032 (%)
5.5 Enzymes
5.5.1 Enzymes Market Forecast by Region, 2022-2032 (US$ billion)
5.5.2 Enzymes Market Share by Region, 2022-2032 (%)
5.6 Cloning Technology Kits
5.6.1 Cloning Technology Kits Market Forecast by Region, 2022-2032 (US$ billion)
5.6.2 Cloning Technology Kits Market Share by Region, 2022-2032 (%)
5.7 Synthetic Cells
5.7.1 Synthetic Cells Market Forecast by Region, 2022-2032 (US$ billion)
5.7.2 Synthetic Cells Market Share by Region, 2022-2032 (%)
5.8 Synthetic Genes
5.8.1 Synthetic Genes Market Forecast by Region, 2022-2032 (US$ billion)
5.8.2 Synthetic Genes Market Share by Region, 2022-2032 (%)
5.9 Synthetic Clones
5.9.1 Synthetic Clones Market Forecast by Region, 2022-2032 (US$ billion)
5.9.2 Synthetic Clones Market Share by Region, 2022-2032 (%)
5.10 Chassis Organisms
5.10.1 Chassis Organisms Market Forecast by Region, 2022-2032 (US$ billion)
5.10.2 Chassis Organisms Market Share by Region, 2022-2032 (%)
5.11 Xeno-Nucleic Acids
5.11.1 Xeno-Nucleic Acids Market Forecast by Region, 2022-2032 (US$ billion)
5.11.2 Xeno-Nucleic Acids Market Share by Region, 2022-2032 (%)
5.12 Other Product Types
5.12.1 Other Product Types Market Forecast by Region, 2022-2032 (US$ billion)
5.12.2 Other Product Types Market Share by Region, 2022-2032 (%)
5.13 Global Synthetic Biology Market Size Estimation and Forecast by Product Type
6 Global Synthetic Biology Market Analysis by Technology
6.1 Key Findings
6.2 Technology Segment Growth Prospects
6.3 Global Synthetic Biology Market Share by Technology, 2022 & 2032
6.4 Gene Synthesis
6.4.1 Gene Synthesis Market Forecast by Region, 2022-2032 (US$ billion)
6.4.2 Gene Synthesis Market Share by Region, 2022-2032 (%)
6.5 Genome Engineering
6.5.1 Genome Engineering Market Forecast by Region, 2022-2032 (US$ billion)
6.5.2 Genome Engineering Market Share by Region, 2022-2032 (%)
6.6 Sequencing
6.6.1 Sequencing Market Forecast by Region, 2022-2032 (US$ billion)
6.6.2 Sequencing Market Share by Region, 2022-2032 (%)
6.7 Bioinformatics
6.7.1 Bioinformatics Market Forecast by Region, 2022-2032 (US$ billion)
6.7.2 Bioinformatics Market Share by Region, 2022-2032 (%)
6.8 Cloning
6.8.1 Cloning Market Forecast by Region, 2022-2032 (US$ billion)
6.8.2 Cloning Market Share by Region, 2022-2032 (%)
6.9 Site-Directed Mutagenesis
6.9.1 Site-Directed Mutagenesis Market Forecast by Region, 2022-2032 (US$ billion)
6.9.2 Site-Directed Mutagenesis Market Share by Region, 2022-2032 (%)
6.10 Measurement & Modelling
6.10.1 Measurement & Modelling Market Forecast by Region, 2022-2032 (US$ billion)
6.10.2 Measurement & Modelling Market Share by Region, 2022-2032 (%)
6.11 Microfluidics
6.11.1 Microfluidics Market Forecast by Region, 2022-2032 (US$ billion)
6.11.2 Microfluidics Market Share by Region, 2022-2032 (%)
6.12 Nanotechnology
6.12.1 Nanotechnology Market Forecast by Region, 2022-2032 (US$ billion)
6.12.2 Nanotechnology Market Share by Region, 2022-2032 (%)
6.13 Other Technologies
6.13.1 Other Technologies Market Forecast by Region, 2022-2032 (US$ billion)
6.13.2 Other Technologies Market Share by Region, 2022-2032 (%)
6.14 Global Synthetic Biology Market Size Estimation and Forecast by Technology
7 Global Synthetic Biology Market Analysis by Application
7.1 Key Findings
7.2 Application Segment Growth Prospects
7.3 Global Synthetic Biology Market Share by Application, 2022 & 2032
7.4 Medical & Pharmaceutical Applications
7.4.1 Medical & Pharmaceutical Applications Market Forecast by Region, 2022-2032 (US$ billion)
7.4.2 Medical & Pharmaceutical Applications Market Share by Region, 2022-2032 (%)
7.4.3 Drug Discovery and Therapeutics
7.4.4 Artificial Tissue & Tissue Regeneration
7.5 Industrial Applications
7.5.1 Industrial Applications Market Forecast by Region, 2022-2032 (US$ billion)
7.5.2 Industrial Applications Market Share by Region, 2022-2032 (%)
7.5.3 Biofuel and Renewable Energy
7.5.4 Industrial Enzymes
7.5.5 Biomaterials & Green Chemicals
7.6 Food & Agriculture
7.6.1 Food & Agriculture Market Forecast by Region, 2022-2032 (US$ billion)
7.6.2 Food & Agriculture Market Share by Region, 2022-2032 (%)
7.7 Environmental Applications
7.7.1 Environmental Applications Market Forecast by Region, 2022-2032 (US$ billion)
7.7.2 Environmental Applications Market Share by Region, 2022-2032 (%)
7.7.3 Bioremediation
7.7.4 Biosensing
7.8 Other Applications
7.8.1 Other Applications Market Forecast by Region, 2022-2032 (US$ billion)
7.8.2 Other Applications Market Share by Region, 2022-2032 (%)
7.9 Global Synthetic Biology Market Size Estimation and Forecast by Application
8 Global Synthetic Biology Market Analysis by Region
8.1 Key Findings
8.2 Regional Market Size Estimation and Forecast
9 North America Synthetic Biology Market Analysis
9.1 Key Findings
9.2 North America Synthetic Biology Market Attractiveness Index
9.3 North America Synthetic Biology Market by Country, 2022, 2027 & 2032 (US$ billion)
9.4 North America Synthetic Biology Market Size Estimation and Forecast by Country
9.5 North America Synthetic Biology Market Size Estimation and Forecast by Product Type
9.6 North America Synthetic Biology Market Size Estimation and Forecast by Technology
9.7 North America Synthetic Biology Market Size Estimation and Forecast by Application
9.8 Medical & Pharmaceutical Applications
9.8.1 North America Synthetic Biology Market Size Estimation and Forecast by Medical & Pharmaceutical Applications
9.8.2 Drug Discovery and Therapeutics
9.8.3 Artificial Tissue & Tissue Regeneration
9.9 Industrial Applications
9.9.1 North America Synthetic Biology Market Size Estimation and Forecast by Industrial Applications
9.9.2 Industrial Enzymes
9.10 Environmental Applications
9.10.1 North America Synthetic Biology Market Size Estimation and Forecast by Environmental Applications
9.11 U.S.
9.11.1 U.S. Synthetic Biology Market by Product Type
9.11.2 U.S. Synthetic Biology Market by Technology
9.11.3 U.S. Synthetic Biology Market by Application
9.11.4 Medical & Pharmaceutical Applications
9.11.5 Industrial Applications
9.11.6 Environmental Applications
9.12 Canada
9.12.1 Canada Synthetic Biology Market by Product Type
9.12.2 Canada Synthetic Biology Market by Technology
9.12.3 Canada Synthetic Biology Market by Application
9.12.4 Medical & Pharmaceutical Applications
9.12.5 Industrial Applications
9.12.6 Environmental Applications
10 Europe Synthetic Biology Market Analysis
10.1 Key Findings
10.2 Europe Synthetic Biology Market Attractiveness Index
10.3 Europe Synthetic Biology Market by Country, 2022, 2027 & 2032 (US$ billion)
10.4 Europe Synthetic Biology Market Size Estimation and Forecast by Country
10.5 Europe Synthetic Biology Market Size Estimation and Forecast by Product Type
10.6 Europe Synthetic Biology Market Size Estimation and Forecast by Technology
10.7 Europe Synthetic Biology Market Size Estimation and Forecast by Application
10.8 Medical & Pharmaceutical Applications
10.8.1 Europe Synthetic Biology Market Size Estimation and Forecast by Medical & Pharmaceutical Applications
10.8.2 Drug Discovery and Therapeutics
10.8.3 Artificial Tissue & Tissue Regeneration
10.9 Industrial Applications
10.9.1 Europe Synthetic Biology Market Size Estimation and Forecast by Industrial Applications
10.9.2 Industrial Enzymes
10.10 Environmental Applications
10.10.1 Europe Synthetic Biology Market Size Estimation and Forecast by Environmental Applications
10.11 Germany
10.11.1 Germany Synthetic Biology Market by Product Type
10.11.2 Germany Synthetic Biology Market by Technology
10.11.3 Germany Synthetic Biology Market by Application
10.11.4 Medical & Pharmaceutical Applications
10.11.5 Industrial Applications
10.11.6 Environmental Applications
10.12 France
10.12.1 France Synthetic Biology Market by Product Type
10.12.2 France Synthetic Biology Market by Technology
10.12.3 France Synthetic Biology Market by Application
10.12.4 Medical & Pharmaceutical Applications
10.12.5 Industrial Applications
10.12.6 Environmental Applications
10.13 UK
10.13.1 UK Synthetic Biology Market by Product Type
10.13.2 UK Synthetic Biology Market by Technology
10.13.3 UK Synthetic Biology Market by Application
10.13.4 Medical & Pharmaceutical Applications
10.13.5 Industrial Applications
10.13.6 Environmental Applications
10.14 Italy
10.14.1 Italy Synthetic Biology Market by Product Type
10.14.2 Italy Synthetic Biology Market by Technology
10.14.3 Italy Synthetic Biology Market by Application
10.14.4 Medical & Pharmaceutical Applications
10.14.5 Industrial Applications
10.14.6 Environmental Applications
10.15 Spain
10.15.1 Spain Synthetic Biology Market by Product Type
10.15.2 Spain Synthetic Biology Market by Technology
10.15.3 Spain Synthetic Biology Market by Application
10.15.4 Medical & Pharmaceutical Applications
10.15.5 Industrial Applications
10.15.6 Environmental Applications
10.16 Rest of Europe
10.16.1 Rest of Europe Synthetic Biology Market by Product Type
10.16.2 Rest of Europe Synthetic Biology Market by Technology
10.16.3 Rest of Europe Synthetic Biology Market by Application
10.16.4 Medical & Pharmaceutical Applications
10.16.5 Industrial Applications
10.16.6 Environmental Applications
11 Asia Pacific Synthetic Biology Market Analysis
11.1 Key Findings
11.2 Asia Pacific Synthetic Biology Market Attractiveness Index
11.3 Asia Pacific Synthetic Biology Market by Country, 2022, 2027 & 2032 (US$ billion)
11.4 Asia Pacific Synthetic Biology Market Size Estimation and Forecast by Country
11.5 Asia Pacific Synthetic Biology Market Size Estimation and Forecast by Product Type
11.6 Asia Pacific Synthetic Biology Market Size Estimation and Forecast by Technology
11.7 Asia Pacific Synthetic Biology Market Size Estimation and Forecast by Application
11.7.1 Medical & Pharmaceutical Applications
11.7.2 Drug Discovery and Therapeutics
11.7.3 Artificial Tissue & Tissue Regeneration
11.8 Industrial Applications
11.8.1 Asia Pacific Synthetic Biology Market Size Estimation and Forecast by Industrial Applications
11.8.2 Industrial Enzymes
11.9 Environmental Applications
11.9.1 Asia Pacific Synthetic Biology Market Size Estimation and Forecast by Environmental Applications
11.10 China
11.10.1 China Synthetic Biology Market by Product Type
11.10.2 China Synthetic Biology Market by Technology
11.10.3 China Synthetic Biology Market by Application
11.10.4 Medical & Pharmaceutical Applications
11.10.5 Industrial Applications
11.10.6 Environmental Applications
11.11 Japan
11.11.1 Japan Synthetic Biology Market by Product Type
11.11.2 Japan Synthetic Biology Market by Technology
11.11.3 Japan Synthetic Biology Market by Application
11.11.4 Medical & Pharmaceutical Applications
11.11.5 Industrial Applications
11.11.6 Environmental Applications
11.12 India
11.12.1 India Synthetic Biology Market by Product Type
11.12.2 India Synthetic Biology Market by Technology
11.12.3 India Synthetic Biology Market by Application
11.12.4 Medical & Pharmaceutical Applications
11.12.5 Industrial Applications
11.12.6 Environmental Applications
11.13 Australia
11.13.1 Australia Synthetic Biology Market by Product Type
11.13.2 Australia Synthetic Biology Market by Technology
11.13.3 Australia Synthetic Biology Market by Application
11.13.4 Medical & Pharmaceutical Applications
11.13.5 Industrial Applications
11.13.6 Environmental Applications
11.14 South Korea
11.14.1 South Korea Synthetic Biology Market by Product Type
11.14.2 South Korea Synthetic Biology Market by Technology
11.14.3 South Korea Synthetic Biology Market by Application
11.14.4 Medical & Pharmaceutical Applications
11.14.5 Industrial Applications
11.14.6 Environmental Applications
11.15 Rest of Asia Pacific
11.15.1 Rest of Asia Pacific Synthetic Biology Market by Product Type
11.15.2 Rest of Asia Pacific Synthetic Biology Market by Technology
11.15.3 Rest of Asia Pacific Synthetic Biology Market by Application
11.15.4 Medical & Pharmaceutical Applications
11.15.5 Industrial Applications
11.15.6 Environmental Applications
12 Latin America Synthetic Biology Market Analysis
12.1 Key Findings
12.2 Latin America Synthetic Biology Market Attractiveness Index
12.3 Latin America Synthetic Biology Market by Country, 2022, 2027 & 2032 (US$ billion)
12.4 Latin America Synthetic Biology Market Size Estimation and Forecast by Country
12.5 Latin America Synthetic Biology Market Size Estimation and Forecast by Product Type
12.6 Latin America Synthetic Biology Market Size Estimation and Forecast by Technology
12.7 Latin America Synthetic Biology Market Size Estimation and Forecast by Application
12.8 Medical & Pharmaceutical Applications
12.8.1 Latin America Synthetic Biology Market Size Estimation and Forecast by Medical & Pharmaceutical Applications
12.8.2 Drug Discovery and Therapeutics
12.8.3 Artificial Tissue & Tissue Regeneration
12.9 Industrial Applications
12.9.1 Latin America Synthetic Biology Market Size Estimation and Forecast by Industrial Applications
12.9.2 Industrial Enzymes
12.10 Environmental Applications
12.10.1 Latin America Synthetic Biology Market Size Estimation and Forecast by Environmental Applications
12.11 Brazil
12.11.1 Brazil Synthetic Biology Market by Product Type
12.11.2 Brazil Synthetic Biology Market by Technology
12.11.3 Brazil Synthetic Biology Market by Application
12.11.4 Medical & Pharmaceutical Applications
12.11.5 Industrial Applications
12.11.6 Environmental Applications
12.12 Mexico
12.12.1 Mexico Synthetic Biology Market by Product Type
12.12.2 Mexico Synthetic Biology Market by Technology
12.12.3 Mexico Synthetic Biology Market by Application
12.12.4 Medical & Pharmaceutical Applications
12.12.5 Industrial Applications
12.12.6 Environmental Applications
12.13 Argentina
12.13.1 Argentina Synthetic Biology Market by Product Type
12.13.2 Argentina Synthetic Biology Market by Technology
12.13.3 Argentina Synthetic Biology Market by Application
12.13.4 Medical & Pharmaceutical Applications
12.13.5 Industrial Applications
12.13.6 Environmental Applications
12.14 Rest of Latin America
12.14.1 Rest of Latin America Synthetic Biology Market by Product Type
12.14.2 Rest of Latin America Synthetic Biology Market by Technology
12.14.3 Rest of Latin America Synthetic Biology Market by Application
12.14.4 Medical & Pharmaceutical Applications
12.14.5 Industrial Applications
12.14.6 Environmental Applications
13 MEA Synthetic Biology Market Analysis
13.1 Key Findings
13.2 MEA Synthetic Biology Market Attractiveness Index
13.3 MEA Synthetic Biology Market by Country, 2022, 2027 & 2032 (US$ billion)
13.4 MEA Synthetic Biology Market Size Estimation and Forecast by Country
13.5 MEA Synthetic Biology Market Size Estimation and Forecast by Product Type
13.6 MEA Synthetic Biology Market Size Estimation and Forecast by Technology
13.7 MEA Synthetic Biology Market Size Estimation and Forecast by Application
13.8 Medical & Pharmaceutical Applications
13.8.1 MEA Synthetic Biology Market Size Estimation and Forecast by Medical & Pharmaceutical Applications
13.8.2 Drug Discovery and Therapeutics
13.8.3 Artificial Tissue & Tissue Regeneration
13.9 Industrial Applications
13.9.1 MEA Synthetic Biology Market Size Estimation and Forecast by Industrial Applications
13.9.2 Industrial Enzymes
13.10 Environmental Applications
13.10.1 MEA Synthetic Biology Market Size Estimation and Forecast by Environmental Applications
13.11 Turkey
13.11.1 Turkey Synthetic Biology Market by Product Type
13.11.2 Turkey Synthetic Biology Market by Technology
13.11.3 Turkey Synthetic Biology Market by Application
13.11.4 Medical & Pharmaceutical Applications
13.11.5 Industrial Applications
13.11.6 Environmental Applications
13.12 Saudi Arabia
13.12.1 Saudi Arabia Synthetic Biology Market by Product Type
13.12.2 Saudi Arabia Synthetic Biology Market by Technology
13.12.3 Saudi Arabia Synthetic Biology Market by Application
13.12.4 Medical & Pharmaceutical Applications
13.12.5 Industrial Applications
13.12.6 Environmental Applications
13.13 South Africa
13.13.1 South Africa Synthetic Biology Market by Product Type
13.13.2 South Africa Synthetic Biology Market by Technology
13.13.3 South Africa Synthetic Biology Market by Application
13.13.4 Medical & Pharmaceutical Applications
13.13.5 Industrial Applications
13.13.6 Environmental Applications
13.14 UAE
13.14.1 UAE Synthetic Biology Market by Product Type
13.14.2 UAE Synthetic Biology Market by Technology
13.14.3 UAE Synthetic Biology Market by Application
13.14.4 Medical & Pharmaceutical Applications
13.14.5 Industrial Applications
13.14.6 Environmental Applications
13.15 Egypt
13.15.1 Egypt Synthetic Biology Market by Product Type
13.15.2 Egypt Synthetic Biology Market by Technology
13.15.3 Egypt Synthetic Biology Market by Application
13.15.4 Medical & Pharmaceutical Applications
13.15.5 Industrial Applications
13.15.6 Environmental Applications
13.16 Rest of MEA
13.16.1 Rest of MEA Synthetic Biology Market by Product Type
13.16.2 Rest of MEA Synthetic Biology Market by Technology
13.16.3 Rest of MEA Synthetic Biology Market by Application
13.16.4 Medical & Pharmaceutical Applications
13.16.5 Industrial Applications
13.16.6 Environmental Applications
14 Competitive Landscape
14.1 Company Share Analysis
14.2 Company Profiles
14.2.1 Thermo Fisher Scientific Inc.
14.2.2 Agilent Technologies Inc.
14.2.3 Merck KGaA
14.2.4 Genscript Biotech Corporation
14.2.5 Precigen Inc.
14.2.6 Synthetic Genomics (Viridos)
14.2.7 Ginkgo Bioworks
14.2.8 New England Biolabs
14.2.9 Danaher Corporation
14.2.10 Twist Bioscience Corp.
14.2.11 Codexis, Inc.
14.2.12 Amyris, Inc.
14.2.13 GRO Biosciences
14.2.14 Synlogic
14.2.15 ElevateBio
15 Conclusion and Recommendations
15.1 Concluding Remarks from Visiongain
15.2 Recommendations for Market Players
List of Tables
Table 1 Global Synthetic Biology Market Snapshot, 2022 & 2032 (US$ billion, CAGR %)
Table 2 Global Synthetic Biology Market Forecast by Region, 2022-2032 (US$ billion, AGR%, CAGR%): “V” Shaped Recovery
Table 3 Global Synthetic Biology Market Forecast by Region, 2022-2032 (US$ billion, AGR%, CAGR%): “U” Shaped Recovery
Table 4 Global Synthetic Biology Market Forecast by Region, 2022-2032 (US$ billion, AGR%, CAGR%): “W” Shaped Recovery
Table 5 Global Synthetic Biology Market Forecast by Region, 2022-2032 (US$ billion, AGR%, CAGR%): “L” Shaped Recovery
Table 6 Oligonucleotides & Synthetic DNA Market by Region Forecast, 2022-2032 (US$ billion, AGR%, CAGR%)
Table 7 Enzymes Market by Region Forecast, 2022-2032 (US$ billion, AGR%, CAGR%)
Table 8 Cloning Technology Kits Market by Region Forecast, 2022-2032 (US$ billion, AGR%, CAGR%)
Table 9 Synthetic Cells Market by Region Forecast, 2022-2032 (US$ billion, AGR%, CAGR%)
Table 10 Synthetic Genes Market by Region Forecast, 2022-2032 (US$ billion, AGR%, CAGR%)
Table 11 Synthetic Clones Market by Region Forecast, 2022-2032 (US$ billion, AGR%, CAGR%)
Table 12 Chassis Organisms Market by Region Forecast, 2022-2032 (US$ billion, AGR%, CAGR%)
Table 13 Xeno-Nucleic Acids Market by Region Forecast, 2022-2032 (US$ billion, AGR%, CAGR%)
Table 14 Other Product Types Regions Market by Region Forecast, 2022-2032 (US$ billion, AGR%, CAGR%)
Table 15 Global Synthetic Biology Market Forecast by Product Type, 2022-2032 (US$ billion, AGR%, CAGR%)
Table 16 Gene Synthesis Market Forecast by Region, 2022-2032 (US$ billion, AGR%, CAGR%)
Table 17 Genome Engineering Market Forecast by Region, 2022-2032 (US$ billion, AGR%, CAGR%)
Table 18 Sequencing Market Forecast by Region, 2022-2032 (US$ billion, AGR%, CAGR%)
Table 19 Bioinformatics Market Forecast by Region, 2022-2032 (US$ billion, AGR%, CAGR%)
Table 20 Cloning Market Forecast by Region, 2022-2032 (US$ billion, AGR%, CAGR%)
Table 21 Site-Directed Mutagenesis Market Forecast by Region, 2022-2032 (US$ billion, AGR%, CAGR%)
Table 22 Measurement & Modelling Market Forecast by Region, 2022-2032 (US$ billion, AGR%, CAGR%)
Table 23 Microfluidics Market Forecast by Region, 2022-2032 (US$ billion, AGR%, CAGR%)
Table 24 Nanotechnology Market Forecast by Region, 2022-2032 (US$ billion, AGR%, CAGR%)
Table 25 Other Technologies Market Forecast by Region, 2022-2032 (US$ billion, AGR%, CAGR%)
Table 26 Global Synthetic Biology Market by Technology Forecast, 2022-2032 (US$ billion, AGR%, CAGR%)
Table 27 Medical & Pharmaceutical Applications Market Forecast by Region, 2022-2032 (US$ billion, AGR%, CAGR%)
Table 28 Drug Discovery and Therapeutics Market Forecast by Region, 2022-2032 (US$ billion, AGR%, CAGR%)
Table 29 Cancer Detection & Diagnostics Market Forecast by Region, 2022-2032 (US$ billion, AGR%, CAGR%)
Table 30 Other Drug Discovery and Therapeutic Applications Market Forecast by Region, 2022-2032 (US$ billion, AGR%, CAGR%)
Table 31 Artificial Tissue & Tissue Regeneration Market Forecast by Region, 2022-2032 (US$ billion, AGR%, CAGR%)
Table 32 Bio-Synthesis Market Forecast by Region, 2022-2032 (US$ billion, AGR%, CAGR%)
Table 33 Stem Cell Regulation Market Forecast by Region, 2022-2032 (US$ billion, AGR%, CAGR%)
Table 34 Other Artificial Tissue and Tissue Regeneration Applications Market Forecast by Region, 2022-2032 (US$ billion, AGR%, CAGR%)
Table 35 Industrial Applications Market Forecast by Region, 2022-2032 (US$ billion, AGR%, CAGR%)
Table 36 Biofuel and Renewable Energy Market Forecast by Region, 2022-2032 (US$ billion, AGR%, CAGR%)
Table 37 Industrial Enzymes Market Forecast by Region, 2022-2032 (US$ billion, AGR%, CAGR%)
Table 38 Textile Industry Market Forecast by Region, 2022-2032 (US$ billion, AGR%, CAGR%)
Table 39 Paper Industry Market Forecast by Region, 2022-2032 (US$ billion, AGR%, CAGR%)
Table 40 Other Industries Market Forecast by Region, 2022-2032 (US$ billion, AGR%, CAGR%)
Table 41 Biomaterials & Green Chemicals Market Forecast by Region, 2022-2032 (US$ billion, AGR%, CAGR%)
Table 42 Food & Agriculture Market Forecast by Region, 2022-2032 (US$ billion, AGR%, CAGR%)
Table 43 Environmental Applications Market Forecast by Region, 2022-2032 (US$ billion, AGR%, CAGR%)
Table 44 Bioremediation Market Forecast by Region, 2022-2032 (US$ billion, AGR%, CAGR%)
Table 45 Biosensing Market Forecast by Region, 2022-2032 (US$ billion, AGR%, CAGR%)
Table 46 Other Applications Market Forecast by Region, 2022-2032 (US$ billion, AGR%, CAGR%)
Table 47 Global Synthetic Biology Market Forecast by Application, 2022-2032 (US$ billion, AGR%, CAGR%)
Table 48 Global Synthetic Biology Market by Region Forecast, 2022-2032 (US$ billion, AGR%, CAGR%)
Table 49 North America Synthetic Biology Market Forecast by Country, 2022-2032 (US$ billion, AGR%, CAGR%)
Table 50 North America Synthetic Biology Market Forecast by Product Type, 2022-2032 (US$ billion, AGR%, CAGR%)
Table 51 North America Synthetic Biology Market Forecast by Technology, 2022-2032 (US$ billion, AGR%, CAGR%)
Table 52 North America Synthetic Biology Market Forecast by Application, 2022-2032 (US$ billion, AGR%, CAGR%)
Table 53 North America Synthetic Biology Market Forecast by Medical & Pharmaceutical Applications, 2022-2032 (US$ billion, AGR%, CAGR%)
Table 54 North America Synthetic Biology Market Forecast by Drug Discovery and Therapeutics, 2022-2032 (US$ billion, AGR%, CAGR%)
Table 55 North America Synthetic Biology Market Forecast by Artificial Tissue & Tissue Regeneration, 2022-2032 (US$ billion, AGR%, CAGR%)
Table 56 North America Synthetic Biology Market Forecast by Industrial Applications, 2022-2032 (US$ billion, AGR%, CAGR%)
Table 57 North America Synthetic Biology Market Forecast by Industrial Enzymes, 2022-2032 (US$ billion, AGR%, CAGR%)
Table 58 North America Synthetic Biology Market Forecast by Environmental Applications, 2022-2032 (US$ billion, AGR%, CAGR%)
Table 59 U.S. Synthetic Biology Market Forecast, 2022-2032 (US$ billion, AGR%, CAGR%)
Table 60 U.S. Synthetic Biology Market Forecast by Product Type, 2022-2032 (US$ billion, AGR%, CAGR%)
Table 61 U.S. Synthetic Biology Market Forecast by Technology, 2022-2032 (US$ billion, AGR%, CAGR%)
Table 62 U.S. Synthetic Biology Market Forecast by Application, 2022-2032 (US$ billion, AGR%, CAGR%)
Table 63 U.S. Synthetic Biology Market Forecast by Medical & Pharmaceutical Applications, 2022-2032 (US$ billion, AGR%, CAGR%)
Table 64 U.S. Synthetic Biology Market Forecast by Drug Discovery and Therapeutics, 2022-2032 (US$ billion, AGR%, CAGR%)
Table 65 U.S. Synthetic Biology Market Forecast by Artificial Tissue & Tissue Regeneration, 2022-2032 (US$ billion, AGR%, CAGR%)
Table 66 U.S. Synthetic Biology Market Forecast by Industrial Applications, 2022-2032 (US$ billion, AGR%, CAGR%)
Table 67 U.S. Synthetic Biology Market Forecast by Industrial Enzymes, 2022-2032 (US$ billion, AGR%, CAGR%)
Table 68 U.S. Synthetic Biology Market Forecast by Environmental Applications, 2022-2032 (US$ billion, AGR%, CAGR%)
Table 69 Canada Synthetic Biology Market Forecast, 2022-2032 (US$ billion, AGR%, CAGR%)
Table 70 Canada Synthetic Biology Market Forecast by Product Type, 2022-2032 (US$ billion, AGR%, CAGR%)
Table 71 Canada Synthetic Biology Market Forecast by Technology, 2022-2032 (US$ billion, AGR%, CAGR%)
Table 72 Canada Synthetic Biology Market Forecast by Application, 2022-2032 (US$ billion, AGR%, CAGR%)
Table 73 Canada Synthetic Biology Market Forecast by Medical & Pharmaceutical Applications, 2022-2032 (US$ billion, AGR%, CAGR%)
Table 74 Canada Synthetic Biology Market Forecast by Drug Discovery and Therapeutics, 2022-2032 (US$ billion, AGR%, CAGR%)
Table 75 Canada Synthetic Biology Market Forecast by Artificial Tissue & Tissue Regeneration, 2022-2032 (US$ billion, AGR%, CAGR%)
Table 76 Canada Synthetic Biology Market Forecast by Industrial Applications, 2022-2032 (US$ billion, AGR%, CAGR%)
Table 77 Canada Synthetic Biology Market Forecast by Industrial Enzymes, 2022-2032 (US$ billion, AGR%, CAGR%)
Table 78 Canada Synthetic Biology Market Forecast by Environmental Applications, 2022-2032 (US$ billion, AGR%, CAGR%)
Table 79 Europe Synthetic Biology Market Forecast by Country, 2022-2032 (US$ billion, AGR%, CAGR%)
Table 80 Europe Synthetic Biology Market Forecast by Product Type,2022-2032 (US$ billion, AGR%, CAGR%)
Table 81 Europe Synthetic Biology Market Forecast by Technology,2022-2032 (US$ billion, AGR%, CAGR%)
Table 82 Europe Synthetic Biology Market Forecast by Application,2022-2032 (US$ billion, AGR%, CAGR%)
Table 83 Europe Synthetic Biology Market Forecast by Medical & Pharmaceutical Applications,2022-2032 (US$ billion, AGR%, CAGR%)
Table 84 Europe Synthetic Biology Market Forecast by Drug Discovery and Therapeutics,2022-2032 (US$ billion, AGR%, CAGR%)
Table 85 Europe Synthetic Biology Market Forecast by Artificial Tissue & Tissue Regeneration,2022-2032 (US$ billion, AGR%, CAGR%)
Table 86 Europe Synthetic Biology Market Forecast by Industrial Applications,2022-2032 (US$ billion, AGR%, CAGR%)
Table 87 Europe Synthetic Biology Market Forecast by Industrial Enzymes,2022-2032 (US$ billion, AGR%, CAGR%)
Table 88 Europe Synthetic Biology Market Forecast by Environmental Applications,2022-2032 (US$ billion, AGR%, CAGR%)
Table 89 Germany Synthetic Biology Market Forecast, 2022-2032 (US$ billion, AGR%, CAGR%)
Table 90 Germany Synthetic Biology Market Forecast by Product Type,2022-2032 (US$ billion, AGR%, CAGR%)
Table 91 Germany Synthetic Biology Market Forecast by Technology,2022-2032 (US$ billion, AGR%, CAGR%)
Table 92 Germany Synthetic Biology Market Forecast by Application,2022-2032 (US$ billion, AGR%, CAGR%)
Table 93 Germany Synthetic Biology Market Forecast by Medical & Pharmaceutical Applications,2022-2032 (US$ billion, AGR%, CAGR%)
Table 94 Germany Synthetic Biology Market Forecast by Drug Discovery and Therapeutics,2022-2032 (US$ billion, AGR%, CAGR%)
Table 95 Germany Synthetic Biology Market Forecast by Artificial Tissue & Tissue Regeneration,2022-2032 (US$ billion, AGR%, CAGR%)
Table 96 Germany Synthetic Biology Market Forecast by Industrial Applications,2022-2032 (US$ billion, AGR%, CAGR%)
Table 97 Germany Synthetic Biology Market Forecast by Industrial Enzymes,2022-2032 (US$ billion, AGR%, CAGR%)
Table 98 Germany Synthetic Biology Market Forecast by Environmental Applications,2022-2032 (US$ billion, AGR%, CAGR%)
Table 99 France Synthetic Biology Market Forecast, 2022-2032 (US$ billion, AGR%, CAGR%)
Table 100 France Synthetic Biology Market Forecast by Product Type,2022-2032 (US$ billion, AGR%, CAGR%)
Table 101 France Synthetic Biology Market Forecast by Technology,2022-2032 (US$ billion, AGR%, CAGR%)
Table 102 France Synthetic Biology Market Forecast by Application,2022-2032 (US$ billion, AGR%, CAGR%)
Table 103 France Synthetic Biology Market Forecast by Medical & Pharmaceutical Applications,2022-2032 (US$ billion, AGR%, CAGR%)
Table 104 France Synthetic Biology Market Forecast by Drug Discovery and Therapeutics,2022-2032 (US$ billion, AGR%, CAGR%)
Table 105 France Synthetic Biology Market Forecast by Artificial Tissue & Tissue Regeneration,2022-2032 (US$ billion, AGR%, CAGR%)
Table 106 France Synthetic Biology Market Forecast by Industrial Applications,2022-2032 (US$ billion, AGR%, CAGR%)
Table 107 France Synthetic Biology Market Forecast by Industrial Enzymes,2022-2032 (US$ billion, AGR%, CAGR%)
Table 108 France Synthetic Biology Market Forecast by Environmental Applications,2022-2032 (US$ billion, AGR%, CAGR%)
Table 109 UK Synthetic Biology Market Forecast, 2022-2032 (US$ billion, AGR%, CAGR%)
Table 110 UK Synthetic Biology Market Forecast by Product Type,2022-2032 (US$ billion, AGR%, CAGR%)
Table 111 UK Synthetic Biology Market Forecast by Technology,2022-2032 (US$ billion, AGR%, CAGR%)
Table 112 UK Synthetic Biology Market Forecast by Application,2022-2032 (US$ billion, AGR%, CAGR%)
Table 113 UK Synthetic Biology Market Forecast by Medical & Pharmaceutical Applications,2022-2032 (US$ billion, AGR%, CAGR%)
Table 114 UK Synthetic Biology Market Forecast by Drug Discovery and Therapeutics,2022-2032 (US$ billion, AGR%, CAGR%)
Table 115 UK Synthetic Biology Market Forecast by Artificial Tissue & Tissue Regeneration,2022-2032 (US$ billion, AGR%, CAGR%)
Table 116 UK Synthetic Biology Market Forecast by Industrial Applications,2022-2032 (US$ billion, AGR%, CAGR%)
Table 117 UK Synthetic Biology Market Forecast by Industrial Enzymes,2022-2032 (US$ billion, AGR%, CAGR%)
Table 118 UK Synthetic Biology Market Forecast by Environmental Applications,2022-2032 (US$ billion, AGR%, CAGR%)
Table 119 Italy Synthetic Biology Market Forecast, 2022-2032 (US$ billion, AGR%, CAGR%)
Table 120 Italy Synthetic Biology Market Forecast by Product Type,2022-2032 (US$ billion, AGR%, CAGR%)
Table 121 Italy Synthetic Biology Market Forecast by Technology,2022-2032 (US$ billion, AGR%, CAGR%)
Table 122 Italy Synthetic Biology Market Forecast by Application,2022-2032 (US$ billion, AGR%, CAGR%)
Table 123 Italy Synthetic Biology Market Forecast by Medical & Pharmaceutical Applications,2022-2032 (US$ billion, AGR%, CAGR%)
Table 124 Italy Synthetic Biology Market Forecast by Drug Discovery and Therapeutics,2022-2032 (US$ billion, AGR%, CAGR%)
Table 125 Italy Synthetic Biology Market Forecast by Artificial Tissue & Tissue Regeneration,2022-2032 (US$ billion, AGR%, CAGR%)
Table 126 Italy Synthetic Biology Market Forecast by Industrial Applications,2022-2032 (US$ billion, AGR%, CAGR%)
Table 127 Italy Synthetic Biology Market Forecast by Industrial Enzymes,2022-2032 (US$ billion, AGR%, CAGR%)
Table 128 Italy Synthetic Biology Market Forecast by Environmental Applications,2022-2032 (US$ billion, AGR%, CAGR%)
Table 129 Spain Synthetic Biology Market Forecast, 2022-2032 (US$ billion, AGR%, CAGR%)
Table 130 Spain Synthetic Biology Market Forecast by Product Type,2022-2032 (US$ billion, AGR%, CAGR%)
Table 131 Spain Synthetic Biology Market Forecast by Technology,2022-2032 (US$ billion, AGR%, CAGR%)
Table 132 Spain Synthetic Biology Market Forecast by Application,2022-2032 (US$ billion, AGR%, CAGR%)
Table 133 Spain Synthetic Biology Market Forecast by Medical & Pharmaceutical Applications,2022-2032 (US$ billion, AGR%, CAGR%)
Table 134 Spain Synthetic Biology Market Forecast by Drug Discovery and Therapeutics,2022-2032 (US$ billion, AGR%, CAGR%)
Table 135 Spain Synthetic Biology Market Forecast by Artificial Tissue & Tissue Regeneration,2022-2032 (US$ billion, AGR%, CAGR%)
Table 136 Spain Synthetic Biology Market Forecast by Industrial Applications,2022-2032 (US$ billion, AGR%, CAGR%)
Table 137 Spain Synthetic Biology Market Forecast by Industrial Enzymes,2022-2032 (US$ billion, AGR%, CAGR%)
Table 138 Spain Synthetic Biology Market Forecast by Environmental Applications,2022-2032 (US$ billion, AGR%, CAGR%)
Table 139 Rest of Europe Synthetic Biology Market Forecast, 2022-2032 (US$ billion, AGR%, CAGR%)
Table 140 Rest of Europe Synthetic Biology Market Forecast by Product Type,2022-2032 (US$ billion, AGR%, CAGR%)
Table 141 Rest of Europe Synthetic Biology Market Forecast by Technology,2022-2032 (US$ billion, AGR%, CAGR%)
Table 142 Rest of Europe Synthetic Biology Market Forecast by Application,2022-2032 (US$ billion, AGR%, CAGR%)
Table 143 Rest of Europe Synthetic Biology Market Forecast by Medical & Pharmaceutical Applications,2022-2032 (US$ billion, AGR%, CAGR%)
Table 144 Rest of Europe Synthetic Biology Market Forecast by Drug Discovery and Therapeutics,2022-2032 (US$ billion, AGR%, CAGR%)
Table 145 Rest of Europe Synthetic Biology Market Forecast by Artificial Tissue & Tissue Regeneration,2022-2032 (US$ billion, AGR%, CAGR%)
Table 146 Rest of Europe Synthetic Biology Market Forecast by Industrial Applications,2022-2032 (US$ billion, AGR%, CAGR%)
Table 147 Rest of Europe Synthetic Biology Market Forecast by Industrial Enzymes,2022-2032 (US$ billion, AGR%, CAGR%)
Table 148 Rest of Europe Synthetic Biology Market Forecast by Environmental Applications,2022-2032 (US$ billion, AGR%, CAGR%)
Table 149 Asia Pacific Synthetic Biology Market Forecast by Country,2022-2032 (US$ billion, AGR%, CAGR%)
Table 150 Asia Pacific Synthetic Biology Market Forecast by Product Type,2022-2032 (US$ billion, AGR%, CAGR%)
Table 151 Asia Pacific Synthetic Biology Market Forecast by Technology,2022-2032 (US$ billion, AGR%, CAGR%)
Table 152 Asia Pacific Synthetic Biology Market Forecast by Application,2022-2032 (US$ billion, AGR%, CAGR%)
Table 153 Asia Pacific Synthetic Biology Market Forecast by Medical & Pharmaceutical Applications,2022-2032 (US$ billion, AGR%, CAGR%)
Table 154 Asia Pacific Synthetic Biology Market Forecast by Drug Discovery and Therapeutics,2022-2032 (US$ billion, AGR%, CAGR%)
Table 155 Asia Pacific Synthetic Biology Market Forecast by Artificial Tissue & Tissue Regeneration,2022-2032 (US$ billion, AGR%, CAGR%)
Table 156 Asia Pacific Synthetic Biology Market Forecast by Industrial Applications,2022-2032 (US$ billion, AGR%, CAGR%)
Table 157 Asia Pacific Synthetic Biology Market Forecast by Industrial Enzymes,2022-2032 (US$ billion, AGR%, CAGR%)
Table 158 Asia Pacific Synthetic Biology Market Forecast by Environmental Applications,2022-2032 (US$ billion, AGR%, CAGR%)
Table 159 China Synthetic Biology Market Forecast,2022-2032 (US$ billion, AGR%, CAGR%)
Table 160 China Synthetic Biology Market Forecast by Product Type,2022-2032 (US$ billion, AGR%, CAGR%)
Table 161 China Synthetic Biology Market Forecast by Technology,2022-2032 (US$ billion, AGR%, CAGR%)
Table 162 China Synthetic Biology Market Forecast by Application,2022-2032 (US$ billion, AGR%, CAGR%)
Table 163 China Synthetic Biology Market Forecast by Medical & Pharmaceutical Applications,2022-2032 (US$ billion, AGR%, CAGR%)
Table 164 China Synthetic Biology Market Forecast by Drug Discovery and Therapeutics,2022-2032 (US$ billion, AGR%, CAGR%)
Table 165 China Synthetic Biology Market Forecast by Artificial Tissue & Tissue Regeneration,2022-2032 (US$ billion, AGR%, CAGR%)
Table 166 China Synthetic Biology Market Forecast by Industrial Applications,2022-2032 (US$ billion, AGR%, CAGR%)
Table 167 China Synthetic Biology Market Forecast by Industrial Enzymes,2022-2032 (US$ billion, AGR%, CAGR%)
Table 168 China Synthetic Biology Market Forecast by Environmental Applications,2022-2032 (US$ billion, AGR%, CAGR%)
Table 169 Japan Synthetic Biology Market Forecast,2022-2032 (US$ billion, AGR%, CAGR%)
Table 170 Japan Synthetic Biology Market Forecast by Product Type,2022-2032 (US$ billion, AGR%, CAGR%)
Table 171 Japan Synthetic Biology Market Forecast by Technology,2022-2032 (US$ billion, AGR%, CAGR%)
Table 172 Japan Synthetic Biology Market Forecast by Application,2022-2032 (US$ billion, AGR%, CAGR%)
Table 173 Japan Synthetic Biology Market Forecast by Medical & Pharmaceutical Applications,2022-2032 (US$ billion, AGR%, CAGR%)
Table 174 Japan Synthetic Biology Market Forecast by Drug Discovery and Therapeutics,2022-2032 (US$ billion, AGR%, CAGR%)
Table 175 Japan Synthetic Biology Market Forecast by Artificial Tissue & Tissue Regeneration,2022-2032 (US$ billion, AGR%, CAGR%)
Table 176 Japan Synthetic Biology Market Forecast by Industrial Applications,2022-2032 (US$ billion, AGR%, CAGR%)
Table 177 Japan Synthetic Biology Market Forecast by Industrial Enzymes,2022-2032 (US$ billion, AGR%, CAGR%)
Table 178 Japan Synthetic Biology Market Forecast by Environmental Applications,2022-2032 (US$ billion, AGR%, CAGR%)
Table 179 India Synthetic Biology Market Forecast,2022-2032 (US$ billion, AGR%, CAGR%)
Table 180 India Synthetic Biology Market Forecast by Product Type,2022-2032 (US$ billion, AGR%, CAGR%)
Table 181 India Synthetic Biology Market Forecast by Technology,2022-2032 (US$ billion, AGR%, CAGR%)
Table 182 India Synthetic Biology Market Forecast by Application,2022-2032 (US$ billion, AGR%, CAGR%)
Table 183 India Synthetic Biology Market Forecast by Medical & Pharmaceutical Applications,2022-2032 (US$ billion, AGR%, CAGR%)
Table 184 India Synthetic Biology Market Forecast by Drug Discovery and Therapeutics,2022-2032 (US$ billion, AGR%, CAGR%)
Table 185 India Synthetic Biology Market Forecast by Artificial Tissue & Tissue Regeneration,2022-2032 (US$ billion, AGR%, CAGR%)
Table 186 India Synthetic Biology Market Forecast by Industrial Applications,2022-2032 (US$ billion, AGR%, CAGR%)
Table 187 India Synthetic Biology Market Forecast by Industrial Enzymes,2022-2032 (US$ billion, AGR%, CAGR%)
Table 188 India Synthetic Biology Market Forecast by Environmental Applications,2022-2032 (US$ billion, AGR%, CAGR%)
Table 189 Australia Synthetic Biology Market Forecast,2022-2032 (US$ billion, AGR%, CAGR%)
Table 190 Australia Synthetic Biology Market Forecast by Product Type,2022-2032 (US$ billion, AGR%, CAGR%)
Table 191 Australia Synthetic Biology Market Forecast by Technology,2022-2032 (US$ billion, AGR%, CAGR%)
Table 192 Australia Synthetic Biology Market Forecast by Application,2022-2032 (US$ billion, AGR%, CAGR%)
Table 193 Australia Synthetic Biology Market Forecast by Medical & Pharmaceutical Applications,2022-2032 (US$ billion, AGR%, CAGR%)
Table 194 Australia Synthetic Biology Market Forecast by Drug Discovery and Therapeutics,2022-2032 (US$ billion, AGR%, CAGR%)
Table 195 Australia Synthetic Biology Market Forecast by Artificial Tissue & Tissue Regeneration,2022-2032 (US$ billion, AGR%, CAGR%)
Table 196 Australia Synthetic Biology Market Forecast by Industrial Applications,2022-2032 (US$ billion, AGR%, CAGR%)
Table 197 Australia Synthetic Biology Market Forecast by Industrial Enzymes,2022-2032 (US$ billion, AGR%, CAGR%)
Table 198 Australia Synthetic Biology Market Forecast by Environmental Applications,2022-2032 (US$ billion, AGR%, CAGR%)
Table 199 South Korea Synthetic Biology Market Forecast,2022-2032 (US$ billion, AGR%, CAGR%)
Table 200 South Korea Synthetic Biology Market Forecast by Product Type,2022-2032 (US$ billion, AGR%, CAGR%)
Table 201 South Korea Synthetic Biology Market Forecast by Technology,2022-2032 (US$ billion, AGR%, CAGR%)
Table 202 South Korea Synthetic Biology Market Forecast by Application,2022-2032 (US$ billion, AGR%, CAGR%)
Table 203 South Korea Synthetic Biology Market Forecast by Medical & Pharmaceutical Applications,2022-2032 (US$ billion, AGR%, CAGR%)
Table 204 South Korea Synthetic Biology Market Forecast by Drug Discovery and Therapeutics,2022-2032 (US$ billion, AGR%, CAGR%)
Table 205 South Korea Synthetic Biology Market Forecast by Artificial Tissue & Tissue Regeneration,2022-2032 (US$ billion, AGR%, CAGR%)
Table 206 South Korea Synthetic Biology Market Forecast by Industrial Applications,2022-2032 (US$ billion, AGR%, CAGR%)
Table 207 South Korea Synthetic Biology Market Forecast by Industrial Enzymes,2022-2032 (US$ billion, AGR%, CAGR%)
Table 208 South Korea Synthetic Biology Market Forecast by Environmental Applications,2022-2032 (US$ billion, AGR%, CAGR%)
Table 209 Rest of Asia Pacific Synthetic Biology Market Forecast,2022-2032 (US$ billion, AGR%, CAGR%)
Table 210 Rest of Asia Pacific Synthetic Biology Market Forecast by Product Type,2022-2032 (US$ billion, AGR%, CAGR%)
Table 211 Rest of Asia Pacific Synthetic Biology Market Forecast by Technology,2022-2032 (US$ billion, AGR%, CAGR%)
Table 212 Rest of Asia Pacific Synthetic Biology Market Forecast by Application,2022-2032 (US$ billion, AGR%, CAGR%)
Table 213 Rest of Asia Pacific Synthetic Biology Market Forecast by Medical & Pharmaceutical Applications,2022-2032 (US$ billion, AGR%, CAGR%)
Table 214 Rest of Asia Pacific Synthetic Biology Market Forecast by Drug Discovery and Therapeutics,2022-2032 (US$ billion, AGR%, CAGR%)
Table 215 Rest of Asia Pacific Synthetic Biology Market Forecast by Artificial Tissue & Tissue Regeneration,2022-2032 (US$ billion, AGR%, CAGR%)
Table 216 Rest of Asia Pacific Synthetic Biology Market Forecast by Industrial Applications,2022-2032 (US$ billion, AGR%, CAGR%)
Table 217 Rest of Asia Pacific Synthetic Biology Market Forecast by Industrial Enzymes,2022-2032 (US$ billion, AGR%, CAGR%)
Table 218 Rest of Asia Pacific Synthetic Biology Market Forecast by Environmental Applications,2022-2032 (US$ billion, AGR%, CAGR%)
Table 219 Latin America Synthetic Biology Market Forecast by Country,2022-2032 (US$ billion, AGR%, CAGR%)
Table 220 Latin America Synthetic Biology Market Forecast by Product Type,2022-2032 (US$ billion, AGR%, CAGR%)
Table 221 Latin America Synthetic Biology Market Forecast by Technology,2022-2032 (US$ billion, AGR%, CAGR%)
Table 222 Latin America Synthetic Biology Market Forecast by Application,2022-2032 (US$ billion, AGR%, CAGR%)
Table 223 Latin America Synthetic Biology Market Forecast by Medical & Pharmaceutical Applications,2022-2032 (US$ billion, AGR%, CAGR%)
Table 224 Latin America Synthetic Biology Market Forecast by Drug Discovery and Therapeutics,2022-2032 (US$ billion, AGR%, CAGR%)
Table 225 Latin America Synthetic Biology Market Forecast by Artificial Tissue & Tissue Regeneration,2022-2032 (US$ billion, AGR%, CAGR%)
Table 226 Latin America Synthetic Biology Market Forecast by Industrial Applications,2022-2032 (US$ billion, AGR%, CAGR%)
Table 227 Latin America Synthetic Biology Market Forecast by Industrial Enzymes,2022-2032 (US$ billion, AGR%, CAGR%)
Table 228 Latin America Synthetic Biology Market Forecast by Environmental Applications,2022-2032 (US$ billion, AGR%, CAGR%)
Table 229 Brazil Synthetic Biology Market Forecast,2022-2032 (US$ billion, AGR%, CAGR%)
Table 230 Brazil Synthetic Biology Market Forecast by Product Type,2022-2032 (US$ billion, AGR%, CAGR%)
Table 231 Brazil Synthetic Biology Market Forecast by Technology,2022-2032 (US$ billion, AGR%, CAGR%)
Table 232 Brazil Synthetic Biology Market Forecast by Application,2022-2032 (US$ billion, AGR%, CAGR%)
Table 233 Brazil Synthetic Biology Market Forecast by Medical & Pharmaceutical Applications,2022-2032 (US$ billion, AGR%, CAGR%)
Table 234 Brazil Synthetic Biology Market Forecast by Drug Discovery and Therapeutics,2022-2032 (US$ billion, AGR%, CAGR%)
Table 235 Brazil Synthetic Biology Market Forecast by Artificial Tissue & Tissue Regeneration,2022-2032 (US$ billion, AGR%, CAGR%)
Table 236 Brazil Synthetic Biology Market Forecast by Industrial Applications,2022-2032 (US$ billion, AGR%, CAGR%)
Table 237 Brazil Synthetic Biology Market Forecast by Industrial Enzymes,2022-2032 (US$ billion, AGR%, CAGR%)
Table 238 Brazil Synthetic Biology Market Forecast by Environmental Applications,2022-2032 (US$ billion, AGR%, CAGR%)
Table 239 Mexico Synthetic Biology Market Forecast,2022-2032 (US$ billion, AGR%, CAGR%)
Table 240 Mexico Synthetic Biology Market Forecast by Product Type,2022-2032 (US$ billion, AGR%, CAGR%)
Table 241 Mexico Synthetic Biology Market Forecast by Technology,2022-2032 (US$ billion, AGR%, CAGR%)
Table 242 Mexico Synthetic Biology Market Forecast by Application,2022-2032 (US$ billion, AGR%, CAGR%)
Table 243 Mexico Synthetic Biology Market Forecast by Medical & Pharmaceutical Applications,2022-2032 (US$ billion, AGR%, CAGR%)
Table 244 Mexico Synthetic Biology Market Forecast by Drug Discovery and Therapeutics,2022-2032 (US$ billion, AGR%, CAGR%)
Table 245 Mexico Synthetic Biology Market Forecast by Artificial Tissue & Tissue Regeneration,2022-2032 (US$ billion, AGR%, CAGR%)
Table 246 Mexico Synthetic Biology Market Forecast by Industrial Applications,2022-2032 (US$ billion, AGR%, CAGR%)
Table 247 Mexico Synthetic Biology Market Forecast by Industrial Enzymes,2022-2032 (US$ billion, AGR%, CAGR%)
Table 248 Mexico Synthetic Biology Market Forecast by Environmental Applications,2022-2032 (US$ billion, AGR%, CAGR%)
Table 249 Argentina Synthetic Biology Market Forecast,2022-2032 (US$ billion, AGR%, CAGR%)
Table 250 Argentina Synthetic Biology Market Forecast by Product Type,2022-2032 (US$ billion, AGR%, CAGR%)
Table 251 Argentina Synthetic Biology Market Forecast by Technology,2022-2032 (US$ billion, AGR%, CAGR%)
Table 252 Argentina Synthetic Biology Market Forecast by Application,2022-2032 (US$ billion, AGR%, CAGR%)
Table 253 Argentina Synthetic Biology Market Forecast by Medical & Pharmaceutical Applications,2022-2032 (US$ billion, AGR%, CAGR%)
Table 254 Argentina Synthetic Biology Market Forecast by Drug Discovery and Therapeutics,2022-2032 (US$ billion, AGR%, CAGR%)
Table 255 Argentina Synthetic Biology Market Forecast by Artificial Tissue & Tissue Regeneration,2022-2032 (US$ billion, AGR%, CAGR%)
Table 256 Argentina Synthetic Biology Market Forecast by Industrial Applications,2022-2032 (US$ billion, AGR%, CAGR%)
Table 257 Argentina Synthetic Biology Market Forecast by Industrial Enzymes,2022-2032 (US$ billion, AGR%, CAGR%)
Table 258 Argentina Synthetic Biology Market Forecast by Environmental Applications,2022-2032 (US$ billion, AGR%, CAGR%)
Table 259 Rest of Latin America Synthetic Biology Market Forecast,2022-2032 (US$ billion, AGR%, CAGR%)
Table 260 Rest of Latin America Synthetic Biology Market Forecast by Product Type,2022-2032 (US$ billion, AGR%, CAGR%)
Table 261 Rest of Latin America Synthetic Biology Market Forecast by Technology,2022-2032 (US$ billion, AGR%, CAGR%)
Table 262 Rest of Latin America Synthetic Biology Market Forecast by Application,2022-2032 (US$ billion, AGR%, CAGR%)
Table 263 Rest of Latin America Synthetic Biology Market Forecast by Medical & Pharmaceutical Applications,2022-2032 (US$ billion, AGR%, CAGR%)
Table 264 Rest of Latin America Synthetic Biology Market Forecast by Drug Discovery and Therapeutics,2022-2032 (US$ billion, AGR%, CAGR%)
Table 265 Rest of Latin America Synthetic Biology Market Forecast by Artificial Tissue & Tissue Regeneration,2022-2032 (US$ billion, AGR%, CAGR%)
Table 266 Rest of Latin America Synthetic Biology Market Forecast by Industrial Applications,2022-2032 (US$ billion, AGR%, CAGR%)
Table 267 Rest of Latin America Synthetic Biology Market Forecast by Industrial Enzymes,2022-2032 (US$ billion, AGR%, CAGR%)
Table 268 Rest of Latin America Synthetic Biology Market Forecast by Environmental Applications,2022-2032 (US$ billion, AGR%, CAGR%)
Table 269 MEA Synthetic Biology Market Forecast by Country,2022-2032 (US$ billion, AGR%, CAGR%)
Table 270 MEA Synthetic Biology Market Forecast by Product Type,2022-2032 (US$ billion, AGR%, CAGR%)
Table 271 MEA Synthetic Biology Market Forecast by Technology,2022-2032 (US$ billion, AGR%, CAGR%)
Table 272 MEA Synthetic Biology Market Forecast by Application,2022-2032 (US$ billion, AGR%, CAGR%)
Table 273 MEA Synthetic Biology Market Forecast by Medical & Pharmaceutical Applications,2022-2032 (US$ billion, AGR%, CAGR%)
Table 274 MEA Synthetic Biology Market Forecast by Drug Discovery and Therapeutics,2022-2032 (US$ billion, AGR%, CAGR%)
Table 275 MEA Synthetic Biology Market Forecast by Artificial Tissue & Tissue Regeneration,2022-2032 (US$ billion, AGR%, CAGR%)
Table 276 MEA Synthetic Biology Market Forecast by Industrial Applications,2022-2032 (US$ billion, AGR%, CAGR%)
Table 277 MEA Synthetic Biology Market Forecast by Industrial Enzymes,2022-2032 (US$ billion, AGR%, CAGR%)
Table 278 MEA Synthetic Biology Market Forecast by Environmental Applications,2022-2032 (US$ billion, AGR%, CAGR%)
Table 279 Turkey Synthetic Biology Market Forecast,2022-2032 (US$ billion, AGR%, CAGR%)
Table 280 Turkey Synthetic Biology Market Forecast by Product Type,2022-2032 (US$ billion, AGR%, CAGR%)
Table 281 Turkey Synthetic Biology Market Forecast by Technology,2022-2032 (US$ billion, AGR%, CAGR%)
Table 282 Turkey Synthetic Biology Market Forecast by Application,2022-2032 (US$ billion, AGR%, CAGR%)
Table 283 Turkey Synthetic Biology Market Forecast by Medical & Pharmaceutical Applications,2022-2032 (US$ billion, AGR%, CAGR%)
Table 284 Turkey Synthetic Biology Market Forecast by Drug Discovery and Therapeutics,2022-2032 (US$ billion, AGR%, CAGR%)
Table 285 Turkey Synthetic Biology Market Forecast by Artificial Tissue & Tissue Regeneration,2022-2032 (US$ billion, AGR%, CAGR%)
Table 286 Turkey Synthetic Biology Market Forecast by Industrial Applications,2022-2032 (US$ billion, AGR%, CAGR%)
Table 287 Turkey Synthetic Biology Market Forecast by Industrial Enzymes,2022-2032 (US$ billion, AGR%, CAGR%)
Table 288 Turkey Synthetic Biology Market Forecast by Environmental Applications,2022-2032 (US$ billion, AGR%, CAGR%)
Table 289 Saudi Arabia Synthetic Biology Market Forecast,2022-2032 (US$ billion, AGR%, CAGR%)
Table 290 Saudi Arabia Synthetic Biology Market Forecast by Product Type,2022-2032 (US$ billion, AGR%, CAGR%)
Table 291 Saudi Arabia Synthetic Biology Market Forecast by Technology,2022-2032 (US$ billion, AGR%, CAGR%)
Table 292 Saudi Arabia Synthetic Biology Market Forecast by Application,2022-2032 (US$ billion, AGR%, CAGR%)
Table 293 Saudi Arabia Synthetic Biology Market Forecast by Medical & Pharmaceutical Applications,2022-2032 (US$ billion, AGR%, CAGR%)
Table 294 Saudi Arabia Synthetic Biology Market Forecast by Drug Discovery and Therapeutics,2022-2032 (US$ billion, AGR%, CAGR%)
Table 295 Saudi Arabia Synthetic Biology Market Forecast by Artificial Tissue & Tissue Regeneration,2022-2032 (US$ billion, AGR%, CAGR%)
Table 296 Saudi Arabia Synthetic Biology Market Forecast by Industrial Applications,2022-2032 (US$ billion, AGR%, CAGR%)
Table 297 Saudi Arabia Synthetic Biology Market Forecast by Industrial Enzymes,2022-2032 (US$ billion, AGR%, CAGR%)
Table 298 Saudi Arabia Synthetic Biology Market Forecast by Environmental Applications,2022-2032 (US$ billion, AGR%, CAGR%)
Table 299 South Africa Synthetic Biology Market Forecast,2022-2032 (US$ billion, AGR%, CAGR%)
Table 300 South Africa Synthetic Biology Market Forecast by Product Type,2022-2032 (US$ billion, AGR%, CAGR%)
Table 301 South Africa Synthetic Biology Market Forecast by Technology,2022-2032 (US$ billion, AGR%, CAGR%)
Table 302 South Africa Synthetic Biology Market Forecast by Application,2022-2032 (US$ billion, AGR%, CAGR%)
Table 303 South Africa Synthetic Biology Market Forecast by Medical & Pharmaceutical Applications,2022-2032 (US$ billion, AGR%, CAGR%)
Table 304 South Africa Synthetic Biology Market Forecast by Drug Discovery and Therapeutics,2022-2032 (US$ billion, AGR%, CAGR%)
Table 305 South Africa Synthetic Biology Market Forecast by Artificial Tissue & Tissue Regeneration,2022-2032 (US$ billion, AGR%, CAGR%)
Table 306 South Africa Synthetic Biology Market Forecast by Industrial Applications,2022-2032 (US$ billion, AGR%, CAGR%)
Table 307 South Africa Synthetic Biology Market Forecast by Industrial Enzymes,2022-2032 (US$ billion, AGR%, CAGR%)
Table 308 South Africa Synthetic Biology Market Forecast by Environmental Applications,2022-2032 (US$ billion, AGR%, CAGR%)
Table 309 UAE Synthetic Biology Market Forecast,2022-2032 (US$ billion, AGR%, CAGR%)
Table 310 UAE Synthetic Biology Market Forecast by Product Type,2022-2032 (US$ billion, AGR%, CAGR%)
Table 311 UAE Synthetic Biology Market Forecast by Technology,2022-2032 (US$ billion, AGR%, CAGR%)
Table 312 UAE Synthetic Biology Market Forecast by Application,2022-2032 (US$ billion, AGR%, CAGR%)
Table 313 UAE Synthetic Biology Market Forecast by Medical & Pharmaceutical Applications,2022-2032 (US$ billion, AGR%, CAGR%)
Table 314 UAE Synthetic Biology Market Forecast by Drug Discovery and Therapeutics,2022-2032 (US$ billion, AGR%, CAGR%)
Table 315 UAE Synthetic Biology Market Forecast by Artificial Tissue & Tissue Regeneration,2022-2032 (US$ billion, AGR%, CAGR%)
Table 316 UAE Synthetic Biology Market Forecast by Industrial Applications,2022-2032 (US$ billion, AGR%, CAGR%)
Table 317 MEA Synthetic Biology Market Forecast by Industrial Enzymes,2022-2032 (US$ billion, AGR%, CAGR%)
Table 318 UAE Synthetic Biology Market Forecast by Environmental Applications,2022-2032 (US$ billion, AGR%, CAGR%)
Table 319 Egypt Synthetic Biology Market Forecast,2022-2032 (US$ billion, AGR%, CAGR%)
Table 320 Egypt Synthetic Biology Market Forecast by Product Type,2022-2032 (US$ billion, AGR%, CAGR%)
Table 321 Egypt Synthetic Biology Market Forecast by Technology,2022-2032 (US$ billion, AGR%, CAGR%)
Table 322 Egypt Synthetic Biology Market Forecast by Application,2022-2032 (US$ billion, AGR%, CAGR%)
Table 323 Egypt Synthetic Biology Market Forecast by Medical & Pharmaceutical Applications,2022-2032 (US$ billion, AGR%, CAGR%)
Table 324 MEA Synthetic Biology Market Forecast by Drug Discovery and Therapeutics,2022-2032 (US$ billion, AGR%, CAGR%)
Table 325 Egypt Synthetic Biology Market Forecast by Artificial Tissue & Tissue Regeneration,2022-2032 (US$ billion, AGR%, CAGR%)
Table 326 Egypt Synthetic Biology Market Forecast by Industrial Applications,2022-2032 (US$ billion, AGR%, CAGR%)
Table 327 Egypt Synthetic Biology Market Forecast by Industrial Enzymes,2022-2032 (US$ billion, AGR%, CAGR%)
Table 328 Egypt Synthetic Biology Market Forecast by Environmental Applications,2022-2032 (US$ billion, AGR%, CAGR%)
Table 329 Rest of MEA Synthetic Biology Market Forecast,2022-2032 (US$ billion, AGR%, CAGR%)
Table 330 Rest of MEA Synthetic Biology Market Forecast by Product Type,2022-2032 (US$ billion, AGR%, CAGR%)
Table 331 Rest of MEA Synthetic Biology Market Forecast by Technology,2022-2032 (US$ billion, AGR%, CAGR%)
Table 332 Rest of MEA Synthetic Biology Market Forecast by Application,2022-2032 (US$ billion, AGR%, CAGR%)
Table 333 Rest of MEA Synthetic Biology Market Forecast by Medical & Pharmaceutical Applications,2022-2032 (US$ billion, AGR%, CAGR%)
Table 334 Rest of MEA Synthetic Biology Market Forecast by Drug Discovery and Therapeutics,2022-2032 (US$ billion, AGR%, CAGR%)
Table 335 Rest of MEA Synthetic Biology Market Forecast by Artificial Tissue & Tissue Regeneration,2022-2032 (US$ billion, AGR%, CAGR%)
Table 336 Rest of MEA Synthetic Biology Market Forecast by Industrial Applications,2022-2032 (US$ billion, AGR%, CAGR%)
Table 337 Rest of MEA Synthetic Biology Market Forecast by Industrial Enzymes,2022-2032 (US$ billion, AGR%, CAGR%)
Table 338 Rest of MEA Synthetic Biology Market Forecast by Environmental Applications,2022-2032 (US$ billion, AGR%, CAGR%)
Table 1 Thermo Fisher Scientific Inc.: Key Details, (CEO, HQ, Revenue, Founded, No. of Employees, Company Type, Website, Business Segment)
Table 2 Thermo Fisher Scientific Inc.: Product Benchmarking
Table 3 Thermo Fisher Scientific Inc.: Strategic Outlook
Table 4 Agilent Technologies Inc.: Key Details, (CEO, HQ, Revenue, Founded, No. of Employees, Company Type, Website, Business Segment)
Table 5 Agilent Technologies Inc.: Product Benchmarking
Table 6 Agilent Technologies Inc.: Strategic Outlook
Table 7 Merck KGaA: Key Details, (CEO, HQ, Revenue, Founded, No. of Employees, Company Type, Website, Business Segment)
Table 8 Merck KGaA: Product Benchmarking
Table 9 Merck KGaA.: Strategic Outlook
Table 10 Genscript Biotech Corporation: Key Details, (CEO, HQ, Revenue, Founded, No. of Employees, Company Type, Website, Business Segment)
Table 11 Genscript Biotech Corporation: Product Benchmarking
Table 12 Genscript Biotech Corporation.: Strategic Outlook
Table 13 Precigen Inc.: Key Details, (CEO, HQ, Revenue, Founded, No. of Employees, Company Type, Website, Business Segment)
Table 14 Precigen Inc.: Product Benchmarking
Table 15 Precigen Inc..: Strategic Outlook
Table 16 Synthetic Genomics (Viridos): Key Details, (CEO, HQ, Revenue, Founded, No. of Employees, Company Type, Website, Business Segment)
Table 17 Synthetic Genomics (Viridos): Product Benchmarking
Table 18 Synthetic Genomics (Viridos).: Strategic Outlook
Table 19 Ginkgo Bioworks: Key Details, (CEO, HQ, Revenue, Founded, No. of Employees, Company Type, Website, Business Segment)
Table 20 Ginkgo Bioworks: Product Benchmarking
Table 21 Ginkgo Bioworks.: Strategic Outlook
Table 22 New England Biolabs: Key Details, (CEO, HQ, Revenue, Founded, No. of Employees, Company Type, Website, Business Segment)
Table 23 New England Biolabs: Product Benchmarking
Table 24 New England Biolabs.: Strategic Outlook
Table 25 Danaher Corporation: Key Details, (CEO, HQ, Revenue, Founded, No. of Employees, Company Type, Website, Business Segment)
Table 26 Danaher Corporation: Product Benchmarking
Table 27 Danaher Corporation.: Strategic Outlook
Table 28 Twist Bioscience Corp.: Key Details, (CEO, HQ, Revenue, Founded, No. of Employees, Company Type, Website, Business Segment)
Table 29 Twist Bioscience Corp.: Product Benchmarking
Table 30 Twist Bioscience Corp.: Strategic Outlook
Table 31 Codexis, Inc.: Key Details, (CEO, HQ, Revenue, Founded, No. of Employees, Company Type, Website, Business Segment)
Table 32 Codexis, Inc.: Product Benchmarking
Table 33 Codexis, Inc.: Strategic Outlook
Table 34 Amyris, Inc.: Key Details, (CEO, HQ, Revenue, Founded, No. of Employees, Company Type, Website, Business Segment)
Table 35 Amyris, Inc.: Product Benchmarking
Table 36 Amyris, Inc.: Strategic Outlook
Table 37 GRO Biosciences: Key Details, (CEO, HQ, Revenue, Founded, No. of Employees, Company Type, Website, Business Segment)
Table 38 GRO Biosciences: Product Benchmarking
Table 39 Synlogic: Key Details, (CEO, HQ, Revenue, Founded, No. of Employees, Company Type, Website, Business Segment)
Table 40 Synlogic: Product Benchmarking
Table 41 Synlogic: Strategic Outlook
Table 42 ElevateBio: Key Details, (CEO, HQ, Revenue, Founded, No. of Employees, Company Type, Website, Business Segment)
Table 43 ElevateBio: Product Benchmarking
Table 44 ElevateBio: Strategic Outlook
List of Figures
Figure 1 Global Synthetic Biology Market Segmentation
Figure 2 Global Synthetic Biology Market Forecast by Region: Market Attractiveness Index
Figure 3 Global Synthetic Biology Market by Product Type: Market Attractiveness Index
Figure 4 Global Synthetic Biology Market by Technology: Market Attractiveness Index
Figure 5 Global Synthetic Biology Market by Application: Market Attractiveness Index
Figure 6 Global Synthetic Biology Market: Market Dynamics
Figure 7 Global COVID Impact Analysis: Synthetic Biology Market Recovery Scenarios
Figure 8 Global Synthetic Biology Market by Region, 2022-2032 (USD billion, AGR (%), CAGR (%)): “V” Shaped Recovery
Figure 9 Global Synthetic Biology Market by Region, 2022-2032 (USD billion, AGR (%), CAGR (%)): “U” Shaped Recovery
Figure 10 Global Synthetic Biology Market by Region, 2022-2032 (USD billion, AGR (%), CAGR (%)): “W” Shaped Recovery
Figure 11 Global Synthetic Biology Market by Region, 2022-2032 (USD billion, AGR (%), CAGR (%)): “L” Shaped Recovery
Figure 12 Global Synthetic Biology Market: Porter’s Five Forces Analysis
Figure 13 Global Synthetic Biology Market Forecast by Therapeutics 2022, 2027, 2032 (Revenue, CAGR%)
Figure 14 Global Synthetic Biology Market Share Forecast by Therapeutics, 2022, 2032 (%)
Figure 15 Oligonucleotides & Synthetic DNA Market Forecast by Region, 2022-2032 (US$ billion)
Figure 16 Oligonucleotides & Synthetic DNA Market Share Forecast by Region, 2022-2032 (%)
Figure 17 Enzymes Market Forecast by Region, 2022-2032 (US$ billion)
Figure 18 Enzymes Market Share Forecast by Region, 2022-2032 (%)
Figure 19 Cloning Technology Kits Market Forecast by Region, 2022-2032 (US$ billion)
Figure 20 Cloning Technology Kits Market Share Forecast by Region, 2022-2032 (%)
Figure 21 Synthetic Cells Market Forecast by Region, 2022-2032 (US$ billion)
Figure 22 Synthetic Cells Market Share Forecast by Region, 2022-2032 (%)
Figure 23 Synthetic Genes Market Forecast by Region, 2022-2032 (US$ billion)
Figure 24 Synthetic Genes Market Share Forecast by Region, 2022-2032 (%)
Figure 25 Synthetic Clones Market Forecast by Region, 2022-2032 (US$ billion)
Figure 26 Synthetic Clones Market Share Forecast by Region, 2022-2032 (%)
Figure 27 Chassis Organisms Market Forecast by Region, 2022-2032 (US$ billion)
Figure 28 Chassis Organisms Market Share Forecast by Region, 2022-2032 (%)
Figure 29 Xeno-Nucleic Acids Market Forecast by Region, 2022-2032 (US$ billion)
Figure 30 Xeno-Nucleic Acids Market Share Forecast by Region, 2022-2032 (%)
Figure 31 Other Product Types Market Forecast by Region, 2022-2032 (US$ billion)
Figure 32 Other Product Types Market Share Forecast by Region, 2022-2032 (%)
Figure 33 Global Synthetic Biology Market Forecast by Product Type, 2022-2032 (US$ billion, AGR %)
Figure 34 Global Synthetic Biology Market Share Forecast by Therapeutics, 2022, 2027, 2032 (%)
Figure 35 Global Synthetic Biology Market Forecast by Therapeutics 2022, 2027, 2032 (Revenue, CAGR%)
Figure 36 Global Synthetic Biology Market Share Forecast by Technology, 2022, 2032 (%)
Figure 37 Gene Synthesis Market Forecast by Region, 2022-2032 (US$ billion)
Figure 38 Gene Synthesis Market Share Forecast by Region, 2022-2032 (%)
Figure 39 Genome Engineering Market Forecast by Region, 2022-2032 (US$ billion)
Figure 40 Genome Engineering Market Share Forecast by Region, 2022-2032 (%)
Figure 41 Sequencing Market Forecast by Region, 2022-2032 (US$ billion)
Figure 42 Sequencing Market Share Forecast by Region, 2022-2032 (%)
Figure 43 Bioinformatics Market Forecast by Region, 2022-2032 (US$ billion)
Figure 44 Bioinformatics Market Share Forecast by Region, 2022-2032 (%)
Figure 45 Cloning Market Forecast by Region, 2022-2032 (US$ billion)
Figure 46 Cloning Market Share Forecast by Region, 2022-2032 (%)
Figure 47 Site-Directed Mutagenesis Market Forecast by Region, 2022-2032 (US$ billion)
Figure 48 Site-Directed Mutagenesis Market Share Forecast by Region, 2022-2032 (%)
Figure 49 Measurement & Modelling Market Forecast by Region, 2022-2032 (US$ billion)
Figure 50 Measurement & Modelling Market Share Forecast by Region, 2022-2032 (%)
Figure 51 Microfluidics Market Forecast by Region, 2022-2032 (US$ billion)
Figure 52 Microfluidics Market Share Forecast by Region, 2022-2032 (%)
Figure 53 Nanotechnology Market Forecast by Region, 2022-2032 (US$ billion)
Figure 54 Nanotechnology Market Share Forecast by Region, 2022-2032 (%)
Figure 55 Other Technologies Market Forecast by Region, 2022-2032 (US$ billion)
Figure 56 Other Technologies Market Share Forecast by Region, 2022-2032 (%)
Figure 57 Global Synthetic Biology Market Forecast by Technology, 2022-2032 (US$ billion, AGR %)
Figure 58 Global Synthetic Biology Market Share Forecast by Therapeutics, 2022, 2027, 2032 (%)
Figure 59 Global Synthetic Biology Market Forecast by Therapeutics 2022, 2027, 2032 (Revenue, CAGR%)
Figure 60 Global Synthetic Biology Market Share Forecast by Application, 2022, 2032 (%)
Figure 61 Medical & Pharmaceutical Applications Market Forecast by Region, 2022-2032 (US$ billion)
Figure 62 Medical & Pharmaceutical Applications Market Share Forecast by Region, 2022-2032 (%)
Figure 63 Drug Discovery and Therapeutics Market Forecast by Region, 2022-2032 (US$ billion)
Figure 64 Drug Discovery and Therapeutics Market Share Forecast by Region, 2022-2032 (%)
Figure 65 Cancer Detection & Diagnostics Market Forecast by Region, 2022-2032 (US$ billion)
Figure 66 Cancer Detection & Diagnostics Market Share Forecast by Region, 2022-2032 (%)
Figure 67 Other Drug Discovery and Therapeutic Applications Market Forecast by Region, 2022-2032 (US$ billion)
Figure 68 Other Drug Discovery and Therapeutic Applications Market Share Forecast by Region, 2022-2032 (%)
Figure 69 Artificial Tissue & Tissue Regeneration Market Forecast by Region, 2022-2032 (US$ billion)
Figure 70 Artificial Tissue & Tissue Regeneration Market Share Forecast by Region, 2022-2032 (%)
Figure 71 Bio-Synthesis Market Forecast by Region, 2022-2032 (US$ billion)
Figure 72 Bio-Synthesis Market Share Forecast by Region, 2022-2032 (%)
Figure 73 Stem Cell Regulation Market Forecast by Region, 2022-2032 (US$ billion)
Figure 74 Stem Cell Regulation Market Share Forecast by Region, 2022-2032 (%)
Figure 75 Other Artificial Tissue and Tissue Regeneration Applications Market Forecast by Region, 2022-2032 (US$ billion)
Figure 76 Other Artificial Tissue and Tissue Regeneration Applications Market Share Forecast by Region, 2022-2032 (%)
Figure 77 Industrial Applications Market Forecast by Region, 2022-2032 (US$ billion)
Figure 78 Industrial Applications Market Share Forecast by Region, 2022-2032 (%)
Figure 79 Biofuel and Renewable Energy Market Forecast by Region, 2022-2032 (US$ billion)
Figure 80 Biofuel and Renewable Energy Market Share Forecast by Region, 2022-2032 (%)
Figure 81 Industrial Enzymes Market Forecast by Region, 2022-2032 (US$ billion)
Figure 82 Industrial Enzymes Market Share Forecast by Region, 2022-2032 (%)
Figure 83 Textile Industry Market Forecast by Region, 2022-2032 (US$ billion)
Figure 84 Textile Industry Market Share Forecast by Region, 2022-2032 (%)
Figure 85 Paper Industry Market Forecast by Region, 2022-2032 (US$ billion)
Figure 86 Paper Industry Market Share Forecast by Region, 2022-2032 (%)
Figure 87 Other Industries Market Forecast by Region, 2022-2032 (US$ billion)
Figure 88 Other Industries Market Share Forecast by Region, 2022-2032 (%)
Figure 89 Biomaterials & Green Chemicals Market Forecast by Region, 2022-2032 (US$ billion)
Figure 90 Biomaterials & Green Chemicals Market Share Forecast by Region, 2022-2032 (%)
Figure 91 Food & Agriculture Market Forecast by Region, 2022-2032 (US$ billion)
Figure 92 Food & Agriculture Market Share Forecast by Region, 2022-2032 (%)
Figure 93 Environmental Applications Market Forecast by Region, 2022-2032 (US$ billion)
Figure 94 Environmental Applications Market Share Forecast by Region, 2022-2032 (%)
Figure 95 Bioremediation Market Forecast by Region, 2022-2032 (US$ billion)
Figure 96 Bioremediation Market Share Forecast by Region, 2022-2032 (%)
Figure 97 Biosensing Market Forecast by Region, 2022-2032 (US$ billion)
Figure 98 Biosensing Market Share Forecast by Region, 2022-2032 (%)
Figure 99 Other Applications Market Forecast by Region, 2022-2032 (US$ billion)
Figure 100 Other Applications Market Share Forecast by Region, 2022-2032 (%)
Figure 101 Global Synthetic Biology Market Forecast by Therapeutics, 2022-2032 (US$ billion, AGR %)
Figure 102 Global Synthetic Biology Market Share Forecast by Application, 2022, 2027, 2032 (%)
Figure 103 Global Synthetic Biology Market Forecast by Region 2022, 2027, 2032 (Revenue, CAGR%)
Figure 104 Global Synthetic Biology Market Share Forecast by Region 2022, 2027, 2032(%)
Figure 105 Global Synthetic Biology Market by Region, 2022-2032 (USD billion, AGR (%), CAGR (%))
Figure 106 North America Synthetic Biology Market Attractiveness Index
Figure 107 North America Synthetic Biology Market by Region, 2022, 2027 & 2032 (US$ billion)
Figure 108 North America Synthetic Biology Market Forecast by Country, 2022-2032 (US$ billion, AGR %)
Figure 109 North America Synthetic Biology Market Share Forecast by Country, 2022 & 2032 (%)
Figure 110 North America Synthetic Biology Market Forecast by Product Type, 2022-2032 (US$ billion, AGR %)
Figure 111 North America Synthetic Biology Market Share Forecast by Product Type, 2022 & 2032 (%)
Figure 112 North America Synthetic Biology Market Forecast by Technology, 2022-2032 (US$ billion, AGR %)
Figure 113 North America Synthetic Biology Market Share Forecast by Technology, 2022 & 2032 (%)
Figure 114 North America Synthetic Biology Market Forecast by Application, 2022-2032 (US$ billion, AGR %)
Figure 115 North America Synthetic Biology Market Share Forecast by Application, 2022 & 2032 (%)
Figure 116 North America Synthetic Biology Market Forecast by Medical & Pharmaceutical Applications, 2022-2032 (US$ billion, AGR %)
Figure 117 North America Synthetic Biology Market Share Forecast by Medical & Pharmaceutical Applications, 2022 & 2032 (%)
Figure 118 North America Synthetic Biology Market Forecast by Drug Discovery and Therapeutics, 2022-2032 (US$ billion, AGR %)
Figure 119 North America Synthetic Biology Market Share Forecast by Drug Discovery and Therapeutics, 2022 & 2032 (%)
Figure 120 North America Synthetic Biology Market Forecast by Artificial Tissue & Tissue Regeneration, 2022-2032 (US$ billion, AGR %)
Figure 121 North America Synthetic Biology Market Share Forecast by Artificial Tissue & Tissue Regeneration, 2022 & 2032 (%)
Figure 122 North America Synthetic Biology Market Forecast by Industrial Applications, 2022-2032 (US$ billion, AGR %)
Figure 123 North America Synthetic Biology Market Share Forecast by Industrial Applications, 2022 & 2032 (%)
Figure 124 North America Synthetic Biology Market Forecast by Industrial Enzymes, 2022-2032 (US$ billion, AGR %)
Figure 125 North America Synthetic Biology Market Share Forecast by Industrial Enzymes, 2022 & 2032 (%)
Figure 126 North America Synthetic Biology Market Forecast by Environmental Applications, 2022-2032 (US$ billion, AGR %)
Figure 127 North America Synthetic Biology Market Share Forecast by Environmental Applications, 2022 & 2032 (%)
Figure 128 U.S. Synthetic Biology Market Forecast, 2022-2032 (US$ billion, AGR %)
Figure 129 U.S. Synthetic Biology Market Forecast by Product Type, 2022-2032 (US$ billion, AGR %)
Figure 130 U.S. Synthetic Biology Market Share Forecast by Product Type, 2022 & 2032 (%)
Figure 131 U.S. Synthetic Biology Market Forecast by Technology, 2022-2032 (US$ billion, AGR %)
Figure 132 U.S. Synthetic Biology Market Share Forecast by Technology, 2022 & 2032 (%)
Figure 133 U.S. Synthetic Biology Market Forecast by Application, 2022-2032 (US$ billion, AGR %)
Figure 134 U.S. Synthetic Biology Market Share Forecast by Application, 2022 & 2032 (%)
Figure 135 U.S. Synthetic Biology Market Forecast by Medical & Pharmaceutical Applications, 2022-2032 (US$ billion, AGR %)
Figure 136 U.S. Synthetic Biology Market Share Forecast by Medical & Pharmaceutical Applications, 2022 & 2032 (%)
Figure 137 U.S. Synthetic Biology Market Forecast by Drug Discovery and Therapeutics, 2022-2032 (US$ billion, AGR %)
Figure 138 U.S. Synthetic Biology Market Share Forecast by Drug Discovery and Therapeutics, 2022 & 2032 (%)
Figure 139 U.S. Synthetic Biology Market Forecast by Artificial Tissue & Tissue Regeneration, 2022-2032 (US$ billion, AGR %)
Figure 140 U.S. Synthetic Biology Market Share Forecast by Artificial Tissue & Tissue Regeneration, 2022 & 2032 (%)
Figure 141 U.S. Synthetic Biology Market Forecast by Industrial Applications, 2022-2032 (US$ billion, AGR %)
Figure 142 U.S. Synthetic Biology Market Share Forecast by Industrial Applications, 2022 & 2032 (%)
Figure 143 U.S. Synthetic Biology Market Forecast by Industrial Enzymes, 2022-2032 (US$ billion, AGR %)
Figure 144 U.S. Synthetic Biology Market Share Forecast by Industrial Enzymes, 2022 & 2032 (%)
Figure 145 U.S. Synthetic Biology Market Forecast by Environmental Applications, 2022-2032 (US$ billion, AGR %)
Figure 146 U.S. Synthetic Biology Market Share Forecast by Environmental Applications, 2022 & 2032 (%)
Figure 147 Canada Synthetic Biology Market Forecast, 2022-2032 (US$ billion, AGR %)
Figure 148 Canada Synthetic Biology Market Forecast by Product Type, 2022-2032 (US$ billion, AGR %)
Figure 149 Canada Synthetic Biology Market Share Forecast by Product Type, 2022 & 2032 (%)
Figure 150 Canada Synthetic Biology Market Forecast by Technology, 2022-2032 (US$ billion, AGR %)
Figure 151 Canada Synthetic Biology Market Share Forecast by Technology, 2022 & 2032 (%)
Figure 152 Canada Synthetic Biology Market Forecast by Application, 2022-2032 (US$ billion, AGR %)
Figure 153 Canada Synthetic Biology Market Share Forecast by End-users, 2022 & 2032 (%)
Figure 154 Canada Synthetic Biology Market Forecast by Medical & Pharmaceutical Applications, 2022-2032 (US$ billion, AGR %)
Figure 155 Canada Synthetic Biology Market Share Forecast by Medical & Pharmaceutical Applications, 2022 & 2032 (%)
Figure 156 Canada Synthetic Biology Market Forecast by Drug Discovery and Therapeutics, 2022-2032 (US$ billion, AGR %)
Figure 157 Canada Synthetic Biology Market Share Forecast by Drug Discovery and Therapeutics, 2022 & 2032 (%)
Figure 158 Canada Synthetic Biology Market Forecast by Artificial Tissue & Tissue Regeneration, 2022-2032 (US$ billion, AGR %)
Figure 159 Canada Synthetic Biology Market Share Forecast by Artificial Tissue & Tissue Regeneration, 2022 & 2032 (%)
Figure 160 Canada Synthetic Biology Market Forecast by Industrial Applications, 2022-2032 (US$ billion, AGR %)
Figure 161 Canada Synthetic Biology Market Share Forecast by Industrial Applications, 2022 & 2032 (%)
Figure 162 Canada Synthetic Biology Market Forecast by Industrial Enzymes, 2022-2032 (US$ billion, AGR %)
Figure 163 Canada Synthetic Biology Market Share Forecast by Industrial Enzymes, 2022 & 2032 (%)
Figure 164 Canada Synthetic Biology Market Forecast by Environmental Applications, 2022-2032 (US$ billion, AGR %)
Figure 165 Canada Synthetic Biology Market Share Forecast by Environmental Applications, 2022 & 2032 (%)
Figure 166 Europe Synthetic Biology Market Attractiveness Index
Figure 167 Europe Synthetic Biology Market by Region, 2022, 2027 & 2032 (US$ billion)
Figure 168 Europe Synthetic Biology Market Forecast by Country, 2022-2032 (US$ billion, AGR %)
Figure 169 Europe Synthetic Biology Market Share Forecast by Country, 2022 & 2032 (%)
Figure 170 Europe Synthetic Biology Market Forecast by Product Type, 2022-2032 (US$ billion, AGR %)
Figure 171 Europe Synthetic Biology Market Share Forecast by Product Type, 2022 & 2032 (%)
Figure 172 Europe Synthetic Biology Market Forecast by Technology, 2022-2032 (US$ billion, AGR %)
Figure 173 Europe Synthetic Biology Market Share Forecast by Technology, 2022 & 2032 (%)
Figure 174 Europe Synthetic Biology Market Forecast by Application, 2022-2032 (US$ billion, AGR %)
Figure 175 Europe Synthetic Biology Market Share Forecast by Application, 2022 & 2032 (%)
Figure 176 Europe Synthetic Biology Market Forecast by Medical & Pharmaceutical Applications, 2022-2032 (US$ billion, AGR %)
Figure 177 Europe Synthetic Biology Market Share Forecast by Medical & Pharmaceutical Applications, 2022 & 2032 (%)
Figure 178 Europe Synthetic Biology Market Forecast by Drug Discovery and Therapeutics, 2022-2032 (US$ billion, AGR %)
Figure 179 Europe Synthetic Biology Market Share Forecast by Drug Discovery and Therapeutics, 2022 & 2032 (%)
Figure 180 Europe Synthetic Biology Market Forecast by Artificial Tissue & Tissue Regeneration, 2022-2032 (US$ billion, AGR %)
Figure 181 Europe Synthetic Biology Market Share Forecast by Artificial Tissue & Tissue Regeneration, 2022 & 2032 (%)
Figure 182 Europe Synthetic Biology Market Forecast by Industrial Applications, 2022-2032 (US$ billion, AGR %)
Figure 183 Europe Synthetic Biology Market Share Forecast by Industrial Applications, 2022 & 2032 (%)
Figure 184 Europe Synthetic Biology Market Forecast by Industrial Enzymes, 2022-2032 (US$ billion, AGR %)
Figure 185 Europe Synthetic Biology Market Share Forecast by Industrial Enzymes, 2022 & 2032 (%)
Figure 186 Europe Synthetic Biology Market Forecast by Environmental Applications, 2022-2032 (US$ billion, AGR %)
Figure 187 Europe Synthetic Biology Market Share Forecast by Environmental Applications, 2022 & 2032 (%)
Figure 188 Germany Synthetic Biology Market Forecast, 2022-2032 (US$ billion, AGR %)
Figure 189 Germany Synthetic Biology Market Forecast by Product Type, 2022-2032 (US$ billion, AGR %)
Figure 190 Germany Synthetic Biology Market Share Forecast by Product Type, 2022 & 2032 (%)
Figure 191 Germany Synthetic Biology Market Forecast by Technology, 2022-2032 (US$ billion, AGR %)
Figure 192 Germany Synthetic Biology Market Share Forecast by Technology, 2022 & 2032 (%)
Figure 193 Germany Synthetic Biology Market Forecast by Application, 2022-2032 (US$ billion, AGR %)
Figure 194 Germany Synthetic Biology Market Share Forecast by Application, 2022 & 2032 (%)
Figure 195 Germany Synthetic Biology Market Forecast by Medical & Pharmaceutical Applications, 2022-2032 (US$ billion, AGR %)
Figure 196 Germany Synthetic Biology Market Share Forecast by Medical & Pharmaceutical Applications, 2022 & 2032 (%)
Figure 197 Germany Synthetic Biology Market Forecast by Drug Discovery and Therapeutics, 2022-2032 (US$ billion, AGR %)
Figure 198 Germany Synthetic Biology Market Share Forecast by Drug Discovery and Therapeutics, 2022 & 2032 (%)
Figure 199 Germany Synthetic Biology Market Forecast by Artificial Tissue & Tissue Regeneration, 2022-2032 (US$ billion, AGR %)
Figure 200 Germany Synthetic Biology Market Share Forecast by Artificial Tissue & Tissue Regeneration, 2022 & 2032 (%)
Figure 201 Germany Synthetic Biology Market Forecast by Industrial Applications, 2022-2032 (US$ billion, AGR %)
Figure 202 Germany Synthetic Biology Market Share Forecast by Industrial Applications, 2022 & 2032 (%)
Figure 203 Germany Synthetic Biology Market Forecast by Industrial Enzymes, 2022-2032 (US$ billion, AGR %)
Figure 204 Germany Synthetic Biology Market Share Forecast by Industrial Enzymes, 2022 & 2032 (%)
Figure 205 Germany Synthetic Biology Market Forecast by Environmental Applications, 2022-2032 (US$ billion, AGR %)
Figure 206 Germany Synthetic Biology Market Share Forecast by Environmental Applications, 2022 & 2032 (%)
Figure 207 France Synthetic Biology Market Forecast, 2022-2032 (US$ billion, AGR %)
Figure 208 France Synthetic Biology Market Forecast by Product Type, 2022-2032 (US$ billion, AGR %)
Figure 209 France Synthetic Biology Market Share Forecast by Product Type, 2022 & 2032 (%)
Figure 210 France Synthetic Biology Market Forecast by Technology, 2022-2032 (US$ billion, AGR %)
Figure 211 France Synthetic Biology Market Share Forecast by Technology, 2022 & 2032 (%)
Figure 212 France Synthetic Biology Market Forecast by Application, 2022-2032 (US$ billion, AGR %)
Figure 213 France Synthetic Biology Market Share Forecast by End-users, 2022 & 2032 (%)
Figure 214 France Synthetic Biology Market Forecast by Medical & Pharmaceutical Applications, 2022-2032 (US$ billion, AGR %)
Figure 215 France Synthetic Biology Market Share Forecast by Medical & Pharmaceutical Applications, 2022 & 2032 (%)
Figure 216 France Synthetic Biology Market Forecast by Drug Discovery and Therapeutics, 2022-2032 (US$ billion, AGR %)
Figure 217 France Synthetic Biology Market Share Forecast by Drug Discovery and Therapeutics, 2022 & 2032 (%)
Figure 218 France Synthetic Biology Market Forecast by Artificial Tissue & Tissue Regeneration, 2022-2032 (US$ billion, AGR %)
Figure 219 France Synthetic Biology Market Share Forecast by Artificial Tissue & Tissue Regeneration, 2022 & 2032 (%)
Figure 220 France Synthetic Biology Market Forecast by Industrial Applications, 2022-2032 (US$ billion, AGR %)
Figure 221 France Synthetic Biology Market Share Forecast by Industrial Applications, 2022 & 2032 (%)
Figure 222 France Synthetic Biology Market Forecast by Industrial Enzymes, 2022-2032 (US$ billion, AGR %)
Figure 223 France Synthetic Biology Market Share Forecast by Industrial Enzymes, 2022 & 2032 (%)
Figure 224 France Synthetic Biology Market Forecast by Environmental Applications, 2022-2032 (US$ billion, AGR %)
Figure 225 France Synthetic Biology Market Share Forecast by Environmental Applications, 2022 & 2032 (%)
Figure 226 UK Synthetic Biology Market Forecast, 2022-2032 (US$ billion, AGR %)
Figure 227 UK Synthetic Biology Market Forecast by Product Type, 2022-2032 (US$ billion, AGR %)
Figure 228 UK Synthetic Biology Market Share Forecast by Product Type, 2022 & 2032 (%)
Figure 229 UK Synthetic Biology Market Forecast by Technology, 2022-2032 (US$ billion, AGR %)
Figure 230 UK Synthetic Biology Market Share Forecast by Technology, 2022 & 2032 (%)
Figure 231 UK Synthetic Biology Market Forecast by Application, 2022-2032 (US$ billion, AGR %)
Figure 232 UK Synthetic Biology Market Share Forecast by Application, 2022 & 2032 (%)
Figure 233 UK Synthetic Biology Market Forecast by Medical & Pharmaceutical Applications, 2022-2032 (US$ billion, AGR %)
Figure 234 UK Synthetic Biology Market Share Forecast by Medical & Pharmaceutical Applications, 2022 & 2032 (%)
Figure 235 UK Synthetic Biology Market Forecast by Drug Discovery and Therapeutics, 2022-2032 (US$ billion, AGR %)
Figure 236 UK Synthetic Biology Market Share Forecast by Drug Discovery and Therapeutics, 2022 & 2032 (%)
Figure 237 UK Synthetic Biology Market Forecast by Artificial Tissue & Tissue Regeneration, 2022-2032 (US$ billion, AGR %)
Figure 238 UK Synthetic Biology Market Share Forecast by Artificial Tissue & Tissue Regeneration, 2022 & 2032 (%)
Figure 239 UK Synthetic Biology Market Forecast by Industrial Applications, 2022-2032 (US$ billion, AGR %)
Figure 240 UK Synthetic Biology Market Share Forecast by Industrial Applications, 2022 & 2032 (%)
Figure 241 UK Synthetic Biology Market Forecast by Industrial Enzymes, 2022-2032 (US$ billion, AGR %)
Figure 242 UK Synthetic Biology Market Share Forecast by Industrial Enzymes, 2022 & 2032 (%)
Figure 243 UK Synthetic Biology Market Forecast by Environmental Applications, 2022-2032 (US$ billion, AGR %)
Figure 244 UK Synthetic Biology Market Share Forecast by Environmental Applications, 2022 & 2032 (%)
Figure 245 Italy Synthetic Biology Market Forecast, 2022-2032 (US$ billion, AGR %)
Figure 246 Italy Synthetic Biology Market Forecast by Product Type, 2022-2032 (US$ billion, AGR %)
Figure 247 Italy Synthetic Biology Market Share Forecast by Product Type, 2022 & 2032 (%)
Figure 248 Italy Synthetic Biology Market Forecast by Technology, 2022-2032 (US$ billion, AGR %)
Figure 249 Italy Synthetic Biology Market Share Forecast by Technology, 2022 & 2032 (%)
Figure 250 Italy Synthetic Biology Market Forecast by Application, 2022-2032 (US$ billion, AGR %)
Figure 251 Italy Synthetic Biology Market Share Forecast by End-users, 2022 & 2032 (%)
Figure 252 Italy Synthetic Biology Market Forecast by Medical & Pharmaceutical Applications, 2022-2032 (US$ billion, AGR %)
Figure 253 Italy Synthetic Biology Market Share Forecast by Medical & Pharmaceutical Applications, 2022 & 2032 (%)
Figure 254 Italy Synthetic Biology Market Forecast by Drug Discovery and Therapeutics, 2022-2032 (US$ billion, AGR %)
Figure 255 Italy Synthetic Biology Market Share Forecast by Drug Discovery and Therapeutics, 2022 & 2032 (%)
Figure 256 Italy Synthetic Biology Market Forecast by Artificial Tissue & Tissue Regeneration, 2022-2032 (US$ billion, AGR %)
Figure 257 Italy Synthetic Biology Market Share Forecast by Artificial Tissue & Tissue Regeneration, 2022 & 2032 (%)
Figure 258 Italy Synthetic Biology Market Forecast by Industrial Applications, 2022-2032 (US$ billion, AGR %)
Figure 259 Italy Synthetic Biology Market Share Forecast by Industrial Applications, 2022 & 2032 (%)
Figure 260 Italy Synthetic Biology Market Forecast by Industrial Enzymes, 2022-2032 (US$ billion, AGR %)
Figure 261 Italy Synthetic Biology Market Share Forecast by Industrial Enzymes, 2022 & 2032 (%)
Figure 262 Italy Synthetic Biology Market Forecast by Environmental Applications, 2022-2032 (US$ billion, AGR %)
Figure 263 Italy Synthetic Biology Market Share Forecast by Environmental Applications, 2022 & 2032 (%)
Figure 264 Spain Synthetic Biology Market Forecast, 2022-2032 (US$ billion, AGR %)
Figure 265 Spain Synthetic Biology Market Forecast by Product Type, 2022-2032 (US$ billion, AGR %)
Figure 266 Spain Synthetic Biology Market Share Forecast by Product Type, 2022 & 2032 (%)
Figure 267 Spain Synthetic Biology Market Forecast by Technology, 2022-2032 (US$ billion, AGR %)
Figure 268 Spain Synthetic Biology Market Share Forecast by Technology, 2022 & 2032 (%)
Figure 269 Spain Synthetic Biology Market Forecast by Application, 2022-2032 (US$ billion, AGR %)
Figure 270 Spain Synthetic Biology Market Share Forecast by Application, 2022 & 2032 (%)
Figure 271 Spain Synthetic Biology Market Forecast by Medical & Pharmaceutical Applications, 2022-2032 (US$ billion, AGR %)
Figure 272 Spain Synthetic Biology Market Share Forecast by Medical & Pharmaceutical Applications, 2022 & 2032 (%)
Figure 273 Spain Synthetic Biology Market Forecast by Drug Discovery and Therapeutics, 2022-2032 (US$ billion, AGR %)
Figure 274 Spain Synthetic Biology Market Share Forecast by Drug Discovery and Therapeutics, 2022 & 2032 (%)
Figure 275 Spain Synthetic Biology Market Forecast by Artificial Tissue & Tissue Regeneration, 2022-2032 (US$ billion, AGR %)
Figure 276 Spain Synthetic Biology Market Share Forecast by Artificial Tissue & Tissue Regeneration, 2022 & 2032 (%)
Figure 277 Spain Synthetic Biology Market Forecast by Industrial Applications, 2022-2032 (US$ billion, AGR %)
Figure 278 Spain Synthetic Biology Market Share Forecast by Industrial Applications, 2022 & 2032 (%)
Figure 279 Spain Synthetic Biology Market Forecast by Industrial Enzymes, 2022-2032 (US$ billion, AGR %)
Figure 280 Spain Synthetic Biology Market Share Forecast by Industrial Enzymes, 2022 & 2032 (%)
Figure 281 Spain Synthetic Biology Market Forecast by Environmental Applications, 2022-2032 (US$ billion, AGR %)
Figure 282 Spain Synthetic Biology Market Share Forecast by Environmental Applications, 2022 & 2032 (%)
Figure 283 Rest of Europe Synthetic Biology Market Forecast, 2022-2032 (US$ billion, AGR %)
Figure 284 Rest of Europe Synthetic Biology Market Forecast by Product Type, 2022-2032 (US$ billion, AGR %)
Figure 285 Rest of Europe Synthetic Biology Market Share Forecast by Product Type, 2022 & 2032 (%)
Figure 286 Rest of Europe Synthetic Biology Market Forecast by Technology, 2022-2032 (US$ billion, AGR %)
Figure 287 Rest of Europe Synthetic Biology Market Share Forecast by Technology, 2022 & 2032 (%)
Figure 288 Rest of Europe Synthetic Biology Market Forecast by Application, 2022-2032 (US$ billion, AGR %)
Figure 289 Rest of Europe Synthetic Biology Market Share Forecast by End-users, 2022 & 2032 (%)
Figure 290 Rest of Europe Synthetic Biology Market Forecast by Medical & Pharmaceutical Applications, 2022-2032 (US$ billion, AGR %)
Figure 291 Rest of Europe Synthetic Biology Market Share Forecast by Medical & Pharmaceutical Applications, 2022 & 2032 (%)
Figure 292 Rest of Europe Synthetic Biology Market Forecast by Drug Discovery and Therapeutics, 2022-2032 (US$ billion, AGR %)
Figure 293 Rest of Europe Synthetic Biology Market Share Forecast by Drug Discovery and Therapeutics, 2022 & 2032 (%)
Figure 294 Rest of Europe Synthetic Biology Market Forecast by Artificial Tissue & Tissue Regeneration, 2022-2032 (US$ billion, AGR %)
Figure 295 Rest of Europe Synthetic Biology Market Share Forecast by Artificial Tissue & Tissue Regeneration, 2022 & 2032 (%)
Figure 296 Rest of Europe Synthetic Biology Market Forecast by Industrial Applications, 2022-2032 (US$ billion, AGR %)
Figure 297 Rest of Europe Synthetic Biology Market Share Forecast by Industrial Applications, 2022 & 2032 (%)
Figure 298 Rest of Europe Synthetic Biology Market Forecast by Industrial Enzymes, 2022-2032 (US$ billion, AGR %)
Figure 299 Rest of Europe Synthetic Biology Market Share Forecast by Industrial Enzymes, 2022 & 2032 (%)
Figure 300 Rest of Europe Synthetic Biology Market Forecast by Environmental Applications, 2022-2032 (US$ billion, AGR %)
Figure 301 Rest of Europe Synthetic Biology Market Share Forecast by Environmental Applications, 2022 & 2032 (%)
Figure 302 Asia Pacific Synthetic Biology Market Attractiveness Index
Figure 303 Asia Pacific Synthetic Biology Market by Region, 2022, 2027 & 2032 (US$ billion)
Figure 304 Asia Pacific Synthetic Biology Market Forecast by Country, 2022-2032 (US$ billion, AGR %)
Figure 305 Asia Pacific Synthetic Biology Market Share Forecast by Country, 2022 & 2032 (%)
Figure 306 Asia Pacific Synthetic Biology Market Forecast by Product Type, 2022-2032 (US$ billion, AGR %)
Figure 307 Asia Pacific Synthetic Biology Market Share Forecast by Product Type, 2022 & 2032 (%)
Figure 308 Asia Pacific Synthetic Biology Market Forecast by Technology, 2022-2032 (US$ billion, AGR %)
Figure 309 Asia Pacific Synthetic Biology Market Share Forecast by Technology, 2022 & 2032 (%)
Figure 310 Asia Pacific Synthetic Biology Market Forecast by Application, 2022-2032 (US$ billion, AGR %)
Figure 311 Asia Pacific Synthetic Biology Market Share Forecast by Application, 2022 & 2032 (%)
Figure 312 Asia Pacific Synthetic Biology Market Forecast by Medical & Pharmaceutical Applications, 2022-2032 (US$ billion, AGR %)
Figure 313 Asia Pacific Synthetic Biology Market Share Forecast by Medical & Pharmaceutical Applications, 2022 & 2032 (%)
Figure 314 Asia Pacific Synthetic Biology Market Forecast by Drug Discovery and Therapeutics, 2022-2032 (US$ billion, AGR %)
Figure 315 Asia Pacific Synthetic Biology Market Share Forecast by Drug Discovery and Therapeutics, 2022 & 2032 (%)
Figure 316 Asia Pacific Synthetic Biology Market Forecast by Artificial Tissue & Tissue Regeneration, 2022-2032 (US$ billion, AGR %)
Figure 317 Asia Pacific Synthetic Biology Market Share Forecast by Artificial Tissue & Tissue Regeneration, 2022 & 2032 (%)
Figure 318 Asia Pacific Synthetic Biology Market Forecast by Industrial Applications, 2022-2032 (US$ billion, AGR %)
Figure 319 Asia Pacific Synthetic Biology Market Share Forecast by Industrial Applications, 2022 & 2032 (%)
Figure 320 Asia Pacific Synthetic Biology Market Forecast by Industrial Enzymes, 2022-2032 (US$ billion, AGR %)
Figure 321 Asia Pacific Synthetic Biology Market Share Forecast by Industrial Enzymes, 2022 & 2032 (%)
Figure 322 Asia Pacific Synthetic Biology Market Forecast by Environmental Applications, 2022-2032 (US$ billion, AGR %)
Figure 323 Asia Pacific Synthetic Biology Market Share Forecast by Environmental Applications, 2022 & 2032 (%)
Figure 324 China Synthetic Biology Market Forecast, 2022-2032 (US$ billion, AGR %)
Figure 325 China Synthetic Biology Market Forecast by Product Type, 2022-2032 (US$ billion, AGR %)
Figure 326 China Synthetic Biology Market Share Forecast by Product Type, 2022 & 2032 (%)
Figure 327 China Synthetic Biology Market Forecast by Technology, 2022-2032 (US$ billion, AGR %)
Figure 328 China Synthetic Biology Market Share Forecast by Technology, 2022 & 2032 (%)
Figure 329 China Synthetic Biology Market Forecast by Application, 2022-2032 (US$ billion, AGR %)
Figure 330 China Synthetic Biology Market Share Forecast by Application, 2022 & 2032 (%)
Figure 331 China Synthetic Biology Market Forecast by Medical & Pharmaceutical Applications, 2022-2032 (US$ billion, AGR %)
Figure 332 China Synthetic Biology Market Share Forecast by Medical & Pharmaceutical Applications, 2022 & 2032 (%)
Figure 333 China Synthetic Biology Market Forecast by Drug Discovery and Therapeutics, 2022-2032 (US$ billion, AGR %)
Figure 334 China Synthetic Biology Market Share Forecast by Drug Discovery and Therapeutics, 2022 & 2032 (%)
Figure 335 China Synthetic Biology Market Forecast by Artificial Tissue & Tissue Regeneration, 2022-2032 (US$ billion, AGR %)
Figure 336 China Synthetic Biology Market Share Forecast by Artificial Tissue & Tissue Regeneration, 2022 & 2032 (%)
Figure 337 China Synthetic Biology Market Forecast by Industrial Applications, 2022-2032 (US$ billion, AGR %)
Figure 338 China Synthetic Biology Market Share Forecast by Industrial Applications, 2022 & 2032 (%)
Figure 339 China Synthetic Biology Market Forecast by Industrial Enzymes, 2022-2032 (US$ billion, AGR %)
Figure 340 China Synthetic Biology Market Share Forecast by Industrial Enzymes, 2022 & 2032 (%)
Figure 341 China Synthetic Biology Market Forecast by Environmental Applications, 2022-2032 (US$ billion, AGR %)
Figure 342 China Synthetic Biology Market Share Forecast by Environmental Applications, 2022 & 2032 (%)
Figure 343 Japan Synthetic Biology Market Forecast, 2022-2032 (US$ billion, AGR %)
Figure 344 Japan Synthetic Biology Market Forecast by Product Type, 2022-2032 (US$ billion, AGR %)
Figure 345 Japan Synthetic Biology Market Share Forecast by Product Type, 2022 & 2032 (%)
Figure 346 Japan Synthetic Biology Market Forecast by Technology, 2022-2032 (US$ billion, AGR %)
Figure 347 Japan Synthetic Biology Market Share Forecast by Technology, 2022 & 2032 (%)
Figure 348 Japan Synthetic Biology Market Forecast by Application, 2022-2032 (US$ billion, AGR %)
Figure 349 Japan Synthetic Biology Market Share Forecast by End-users, 2022 & 2032 (%)
Figure 350 Japan Synthetic Biology Market Forecast by Medical & Pharmaceutical Applications, 2022-2032 (US$ billion, AGR %)
Figure 351 Japan Synthetic Biology Market Share Forecast by Medical & Pharmaceutical Applications, 2022 & 2032 (%)
Figure 352 Japan Synthetic Biology Market Forecast by Drug Discovery and Therapeutics, 2022-2032 (US$ billion, AGR %)
Figure 353 Japan Synthetic Biology Market Share Forecast by Drug Discovery and Therapeutics, 2022 & 2032 (%)
Figure 354 Japan Synthetic Biology Market Forecast by Artificial Tissue & Tissue Regeneration, 2022-2032 (US$ billion, AGR %)
Figure 355 Japan Synthetic Biology Market Share Forecast by Artificial Tissue & Tissue Regeneration, 2022 & 2032 (%)
Figure 356 Japan Synthetic Biology Market Forecast by Industrial Applications, 2022-2032 (US$ billion, AGR %)
Figure 357 Japan Synthetic Biology Market Share Forecast by Industrial Applications, 2022 & 2032 (%)
Figure 358 Japan Synthetic Biology Market Forecast by Industrial Enzymes, 2022-2032 (US$ billion, AGR %)
Figure 359 Japan Synthetic Biology Market Share Forecast by Industrial Enzymes, 2022 & 2032 (%)
Figure 360 Japan Synthetic Biology Market Forecast by Environmental Applications, 2022-2032 (US$ billion, AGR %)
Figure 361 Japan Synthetic Biology Market Share Forecast by Environmental Applications, 2022 & 2032 (%)
Figure 362 India Synthetic Biology Market Forecast, 2022-2032 (US$ billion, AGR %)
Figure 363 India Synthetic Biology Market Forecast by Product Type, 2022-2032 (US$ billion, AGR %)
Figure 364 India Synthetic Biology Market Share Forecast by Product Type, 2022 & 2032 (%)
Figure 365 India Synthetic Biology Market Forecast by Technology, 2022-2032 (US$ billion, AGR %)
Figure 366 India Synthetic Biology Market Share Forecast by Technology, 2022 & 2032 (%)
Figure 367 India Synthetic Biology Market Forecast by Application, 2022-2032 (US$ billion, AGR %)
Figure 368 India Synthetic Biology Market Share Forecast by Application, 2022 & 2032 (%)
Figure 369 India Synthetic Biology Market Forecast by Medical & Pharmaceutical Applications, 2022-2032 (US$ billion, AGR %)
Figure 370 India Synthetic Biology Market Share Forecast by Medical & Pharmaceutical Applications, 2022 & 2032 (%)
Figure 371 India Synthetic Biology Market Forecast by Drug Discovery and Therapeutics, 2022-2032 (US$ billion, AGR %)
Figure 372 India Synthetic Biology Market Share Forecast by Drug Discovery and Therapeutics, 2022 & 2032 (%)
Figure 373 India Synthetic Biology Market Forecast by Artificial Tissue & Tissue Regeneration, 2022-2032 (US$ billion, AGR %)
Figure 374 India Synthetic Biology Market Share Forecast by Artificial Tissue & Tissue Regeneration, 2022 & 2032 (%)
Figure 375 India Synthetic Biology Market Forecast by Industrial Applications, 2022-2032 (US$ billion, AGR %)
Figure 376 India Synthetic Biology Market Share Forecast by Industrial Applications, 2022 & 2032 (%)
Figure 377 India Synthetic Biology Market Forecast by Industrial Enzymes, 2022-2032 (US$ billion, AGR %)
Figure 378 India Synthetic Biology Market Share Forecast by Industrial Enzymes, 2022 & 2032 (%)
Figure 379 India Synthetic Biology Market Forecast by Environmental Applications, 2022-2032 (US$ billion, AGR %)
Figure 380 India Synthetic Biology Market Share Forecast by Environmental Applications, 2022 & 2032 (%)
Figure 381 Australia Synthetic Biology Market Forecast, 2022-2032 (US$ billion, AGR %)
Figure 382 Australia Synthetic Biology Market Forecast by Product Type, 2022-2032 (US$ billion, AGR %)
Figure 383 Australia Synthetic Biology Market Share Forecast by Product Type, 2022 & 2032 (%)
Figure 384 Australia Synthetic Biology Market Forecast by Technology, 2022-2032 (US$ billion, AGR %)
Figure 385 Australia Synthetic Biology Market Share Forecast by Technology, 2022 & 2032 (%)
Figure 386 Australia Synthetic Biology Market Forecast by Application, 2022-2032 (US$ billion, AGR %)
Figure 387 Australia Synthetic Biology Market Share Forecast by End-users, 2022 & 2032 (%)
Figure 388 Australia Synthetic Biology Market Forecast by Medical & Pharmaceutical Applications, 2022-2032 (US$ billion, AGR %)
Figure 389 Australia Synthetic Biology Market Share Forecast by Medical & Pharmaceutical Applications, 2022 & 2032 (%)
Figure 390 Australia Synthetic Biology Market Forecast by Drug Discovery and Therapeutics, 2022-2032 (US$ billion, AGR %)
Figure 391 Australia Synthetic Biology Market Share Forecast by Drug Discovery and Therapeutics, 2022 & 2032 (%)
Figure 392 Australia Synthetic Biology Market Forecast by Artificial Tissue & Tissue Regeneration, 2022-2032 (US$ billion, AGR %)
Figure 393 Australia Synthetic Biology Market Share Forecast by Artificial Tissue & Tissue Regeneration, 2022 & 2032 (%)
Figure 394 Australia Synthetic Biology Market Forecast by Industrial Applications, 2022-2032 (US$ billion, AGR %)
Figure 395 Australia Synthetic Biology Market Share Forecast by Industrial Applications, 2022 & 2032 (%)
Figure 396 Australia Synthetic Biology Market Forecast by Industrial Enzymes, 2022-2032 (US$ billion, AGR %)
Figure 397 Australia Synthetic Biology Market Share Forecast by Industrial Enzymes, 2022 & 2032 (%)
Figure 398 Australia Synthetic Biology Market Forecast by Environmental Applications, 2022-2032 (US$ billion, AGR %)
Figure 399 Australia Synthetic Biology Market Share Forecast by Environmental Applications, 2022 & 2032 (%)
Figure 400 South Korea Synthetic Biology Market Forecast, 2022-2032 (US$ billion, AGR %)
Figure 401 South Korea Synthetic Biology Market Forecast by Product Type, 2022-2032 (US$ billion, AGR %)
Figure 402 South Korea Synthetic Biology Market Share Forecast by Product Type, 2022 & 2032 (%)
Figure 403 South Korea Synthetic Biology Market Forecast by Technology, 2022-2032 (US$ billion, AGR %)
Figure 404 South Korea Synthetic Biology Market Share Forecast by Technology, 2022 & 2032 (%)
Figure 405 South Korea Synthetic Biology Market Forecast by Application, 2022-2032 (US$ billion, AGR %)
Figure 406 South Korea Synthetic Biology Market Share Forecast by Application, 2022 & 2032 (%)
Figure 407 South Korea Synthetic Biology Market Forecast by Medical & Pharmaceutical Applications, 2022-2032 (US$ billion, AGR %)
Figure 408 South Korea Synthetic Biology Market Share Forecast by Medical & Pharmaceutical Applications, 2022 & 2032 (%)
Figure 409 South Korea Synthetic Biology Market Forecast by Drug Discovery and Therapeutics, 2022-2032 (US$ billion, AGR %)
Figure 410 South Korea Synthetic Biology Market Share Forecast by Drug Discovery and Therapeutics, 2022 & 2032 (%)
Figure 411 South Korea Synthetic Biology Market Forecast by Artificial Tissue & Tissue Regeneration, 2022-2032 (US$ billion, AGR %)
Figure 412 South Korea Synthetic Biology Market Share Forecast by Artificial Tissue & Tissue Regeneration, 2022 & 2032 (%)
Figure 413 South Korea Synthetic Biology Market Forecast by Industrial Applications, 2022-2032 (US$ billion, AGR %)
Figure 414 South Korea Synthetic Biology Market Share Forecast by Industrial Applications, 2022 & 2032 (%)
Figure 415 South Korea Synthetic Biology Market Forecast by Industrial Enzymes, 2022-2032 (US$ billion, AGR %)
Figure 416 South Korea Synthetic Biology Market Share Forecast by Industrial Enzymes, 2022 & 2032 (%)
Figure 417 South Korea Synthetic Biology Market Forecast by Environmental Applications, 2022-2032 (US$ billion, AGR %)
Figure 418 South Korea Synthetic Biology Market Share Forecast by Environmental Applications, 2022 & 2032 (%)
Figure 419 Rest of Asia Pacific Synthetic Biology Market Forecast, 2022-2032 (US$ billion, AGR %)
Figure 420 Rest of Asia Pacific Synthetic Biology Market Forecast by Product Type, 2022-2032 (US$ billion, AGR %)
Figure 421 Rest of Asia Pacific Synthetic Biology Market Share Forecast by Product Type, 2022 & 2032 (%)
Figure 422 Rest of Asia Pacific Synthetic Biology Market Forecast by Technology, 2022-2032 (US$ billion, AGR %)
Figure 423 Rest of Asia Pacific Synthetic Biology Market Share Forecast by Technology, 2022 & 2032 (%)
Figure 424 Rest of Asia Pacific Synthetic Biology Market Forecast by Application, 2022-2032 (US$ billion, AGR %)
Figure 425 Rest of Asia Pacific Synthetic Biology Market Share Forecast by End-users, 2022 & 2032 (%)
Figure 426 Rest of Asia Pacific Synthetic Biology Market Forecast by Medical & Pharmaceutical Applications, 2022-2032 (US$ billion, AGR %)
Figure 427 Rest of Asia Pacific Synthetic Biology Market Share Forecast by Medical & Pharmaceutical Applications, 2022 & 2032 (%)
Figure 428 Rest of Asia Pacific Synthetic Biology Market Forecast by Drug Discovery and Therapeutics, 2022-2032 (US$ billion, AGR %)
Figure 429 Rest of Asia Pacific Synthetic Biology Market Share Forecast by Drug Discovery and Therapeutics, 2022 & 2032 (%)
Figure 430 Rest of Asia Pacific Synthetic Biology Market Forecast by Artificial Tissue & Tissue Regeneration, 2022-2032 (US$ billion, AGR %)
Figure 431 Rest of Asia Pacific Synthetic Biology Market Share Forecast by Artificial Tissue & Tissue Regeneration, 2022 & 2032 (%)
Figure 432 Rest of Asia Pacific Synthetic Biology Market Forecast by Industrial Applications, 2022-2032 (US$ billion, AGR %)
Figure 433 Rest of Asia Pacific Synthetic Biology Market Share Forecast by Industrial Applications, 2022 & 2032 (%)
Figure 434 Rest of Asia Pacific Synthetic Biology Market Forecast by Industrial Enzymes, 2022-2032 (US$ billion, AGR %)
Figure 435 Rest of Asia Pacific Synthetic Biology Market Share Forecast by Industrial Enzymes, 2022 & 2032 (%)
Figure 436 Rest of Asia Pacific Synthetic Biology Market Forecast by Environmental Applications, 2022-2032 (US$ billion, AGR %)
Figure 437 Rest of Asia Pacific Synthetic Biology Market Share Forecast by Environmental Applications, 2022 & 2032 (%)
Figure 438 Latin America Synthetic Biology Market Attractiveness Index
Figure 439 Latin America Synthetic Biology Market by Region, 2022, 2027 & 2032 (US$ billion)
Figure 440 Latin America Synthetic Biology Market Forecast by Country, 2022-2032 (US$ billion, AGR %)
Figure 441 Latin America Synthetic Biology Market Share Forecast by Country, 2022 & 2032 (%)
Figure 442 Latin America Synthetic Biology Market Forecast by Product Type, 2022-2032 (US$ billion, AGR %)
Figure 443 Latin America Synthetic Biology Market Share Forecast by Product Type, 2022 & 2032 (%)
Figure 444 Latin America Synthetic Biology Market Forecast by Technology, 2022-2032 (US$ billion, AGR %)
Figure 445 Latin America Synthetic Biology Market Share Forecast by Technology, 2022 & 2032 (%)
Figure 446 Latin America Synthetic Biology Market Forecast by Application, 2022-2032 (US$ billion, AGR %)
Figure 447 Latin America Synthetic Biology Market Share Forecast by Application, 2022 & 2032 (%)
Figure 448 Latin America Synthetic Biology Market Forecast by Medical & Pharmaceutical Applications, 2022-2032 (US$ billion, AGR %)
Figure 449 Latin America Synthetic Biology Market Share Forecast by Medical & Pharmaceutical Applications, 2022 & 2032 (%)
Figure 450 Latin America Synthetic Biology Market Forecast by Drug Discovery and Therapeutics, 2022-2032 (US$ billion, AGR %)
Figure 451 Latin America Synthetic Biology Market Share Forecast by Drug Discovery and Therapeutics, 2022 & 2032 (%)
Figure 452 Latin America Synthetic Biology Market Forecast by Artificial Tissue & Tissue Regeneration, 2022-2032 (US$ billion, AGR %)
Figure 453 Latin America Synthetic Biology Market Share Forecast by Artificial Tissue & Tissue Regeneration, 2022 & 2032 (%)
Figure 454 Latin America Synthetic Biology Market Forecast by Industrial Applications, 2022-2032 (US$ billion, AGR %)
Figure 455 Latin America Synthetic Biology Market Share Forecast by Industrial Applications, 2022 & 2032 (%)
Figure 456 Latin America Synthetic Biology Market Forecast by Industrial Enzymes, 2022-2032 (US$ billion, AGR %)
Figure 457 Latin America Synthetic Biology Market Share Forecast by Industrial Enzymes, 2022 & 2032 (%)
Figure 458 Latin America Synthetic Biology Market Forecast by Environmental Applications, 2022-2032 (US$ billion, AGR %)
Figure 459 Latin America Synthetic Biology Market Share Forecast by Environmental Applications, 2022 & 2032 (%)
Figure 460 Brazil Synthetic Biology Market Forecast, 2022-2032 (US$ billion, AGR %)
Figure 461 Brazil Synthetic Biology Market Forecast by Product Type, 2022-2032 (US$ billion, AGR %)
Figure 462 Brazil Synthetic Biology Market Share Forecast by Product Type, 2022 & 2032 (%)
Figure 463 Brazil Synthetic Biology Market Forecast by Technology, 2022-2032 (US$ billion, AGR %)
Figure 464 Brazil Synthetic Biology Market Share Forecast by Technology, 2022 & 2032 (%)
Figure 465 Brazil Synthetic Biology Market Forecast by Application, 2022-2032 (US$ billion, AGR %)
Figure 466 Brazil Synthetic Biology Market Share Forecast by Application, 2022 & 2032 (%)
Figure 467 Brazil Synthetic Biology Market Forecast by Medical & Pharmaceutical Applications, 2022-2032 (US$ billion, AGR %)
Figure 468 Brazil Synthetic Biology Market Share Forecast by Medical & Pharmaceutical Applications, 2022 & 2032 (%)
Figure 469 Brazil Synthetic Biology Market Forecast by Drug Discovery and Therapeutics, 2022-2032 (US$ billion, AGR %)
Figure 470 Brazil Synthetic Biology Market Share Forecast by Drug Discovery and Therapeutics, 2022 & 2032 (%)
Figure 471 Brazil Synthetic Biology Market Forecast by Artificial Tissue & Tissue Regeneration, 2022-2032 (US$ billion, AGR %)
Figure 472 Brazil Synthetic Biology Market Share Forecast by Artificial Tissue & Tissue Regeneration, 2022 & 2032 (%)
Figure 473 Brazil Synthetic Biology Market Forecast by Industrial Applications, 2022-2032 (US$ billion, AGR %)
Figure 474 Brazil Synthetic Biology Market Share Forecast by Industrial Applications, 2022 & 2032 (%)
Figure 475 Brazil Synthetic Biology Market Forecast by Industrial Enzymes, 2022-2032 (US$ billion, AGR %)
Figure 476 Brazil Synthetic Biology Market Share Forecast by Industrial Enzymes, 2022 & 2032 (%)
Figure 477 Brazil Synthetic Biology Market Forecast by Environmental Applications, 2022-2032 (US$ billion, AGR %)
Figure 478 Brazil Synthetic Biology Market Share Forecast by Environmental Applications, 2022 & 2032 (%)
Figure 479 Mexico Synthetic Biology Market Forecast, 2022-2032 (US$ billion, AGR %)
Figure 480 Mexico Synthetic Biology Market Forecast by Product Type, 2022-2032 (US$ billion, AGR %)
Figure 481 Mexico Synthetic Biology Market Share Forecast by Product Type, 2022 & 2032 (%)
Figure 482 Mexico Synthetic Biology Market Forecast by Technology, 2022-2032 (US$ billion, AGR %)
Figure 483 Mexico Synthetic Biology Market Share Forecast by Technology, 2022 & 2032 (%)
Figure 484 Mexico Synthetic Biology Market Forecast by Application, 2022-2032 (US$ billion, AGR %)
Figure 485 Mexico Synthetic Biology Market Share Forecast by End-users, 2022 & 2032 (%)
Figure 486 Mexico Synthetic Biology Market Forecast by Medical & Pharmaceutical Applications, 2022-2032 (US$ billion, AGR %)
Figure 487 Mexico Synthetic Biology Market Share Forecast by Medical & Pharmaceutical Applications, 2022 & 2032 (%)
Figure 488 Mexico Synthetic Biology Market Forecast by Drug Discovery and Therapeutics, 2022-2032 (US$ billion, AGR %)
Figure 489 Mexico Synthetic Biology Market Share Forecast by Drug Discovery and Therapeutics, 2022 & 2032 (%)
Figure 490 Mexico Synthetic Biology Market Forecast by Artificial Tissue & Tissue Regeneration, 2022-2032 (US$ billion, AGR %)
Figure 491 Mexico Synthetic Biology Market Share Forecast by Artificial Tissue & Tissue Regeneration, 2022 & 2032 (%)
Figure 492 Mexico Synthetic Biology Market Forecast by Industrial Applications, 2022-2032 (US$ billion, AGR %)
Figure 493 Mexico Synthetic Biology Market Share Forecast by Industrial Applications, 2022 & 2032 (%)
Figure 494 Mexico Synthetic Biology Market Forecast by Industrial Enzymes, 2022-2032 (US$ billion, AGR %)
Figure 495 Mexico Synthetic Biology Market Share Forecast by Industrial Enzymes, 2022 & 2032 (%)
Figure 496 Mexico Synthetic Biology Market Forecast by Environmental Applications, 2022-2032 (US$ billion, AGR %)
Figure 497 Mexico Synthetic Biology Market Share Forecast by Environmental Applications, 2022 & 2032 (%)
Figure 498 Argentina Synthetic Biology Market Forecast, 2022-2032 (US$ billion, AGR %)
Figure 499 Argentina Synthetic Biology Market Forecast by Product Type, 2022-2032 (US$ billion, AGR %)
Figure 500 Argentina Synthetic Biology Market Share Forecast by Product Type, 2022 & 2032 (%)
Figure 501 Argentina Synthetic Biology Market Forecast by Technology, 2022-2032 (US$ billion, AGR %)
Figure 502 Argentina Synthetic Biology Market Share Forecast by Technology, 2022 & 2032 (%)
Figure 503 Argentina Synthetic Biology Market Forecast by Application, 2022-2032 (US$ billion, AGR %)
Figure 504 Argentina Synthetic Biology Market Share Forecast by Application, 2022 & 2032 (%)
Figure 505 Argentina Synthetic Biology Market Forecast by Medical & Pharmaceutical Applications, 2022-2032 (US$ billion, AGR %)
Figure 506 Argentina Synthetic Biology Market Share Forecast by Medical & Pharmaceutical Applications, 2022 & 2032 (%)
Figure 507 Argentina Synthetic Biology Market Forecast by Drug Discovery and Therapeutics, 2022-2032 (US$ billion, AGR %)
Figure 508 Argentina Synthetic Biology Market Share Forecast by Drug Discovery and Therapeutics, 2022 & 2032 (%)
Figure 509 Argentina Synthetic Biology Market Forecast by Artificial Tissue & Tissue Regeneration, 2022-2032 (US$ billion, AGR %)
Figure 510 Argentina Synthetic Biology Market Share Forecast by Artificial Tissue & Tissue Regeneration, 2022 & 2032 (%)
Figure 511 Argentina Synthetic Biology Market Forecast by Industrial Applications, 2022-2032 (US$ billion, AGR %)
Figure 512 Argentina Synthetic Biology Market Share Forecast by Industrial Applications, 2022 & 2032 (%)
Figure 513 Argentina Synthetic Biology Market Forecast by Industrial Enzymes, 2022-2032 (US$ billion, AGR %)
Figure 514 Argentina Synthetic Biology Market Share Forecast by Industrial Enzymes, 2022 & 2032 (%)
Figure 515 Argentina Synthetic Biology Market Forecast by Environmental Applications, 2022-2032 (US$ billion, AGR %)
Figure 516 Argentina Synthetic Biology Market Share Forecast by Environmental Applications, 2022 & 2032 (%)
Figure 517 Rest of Latin America Synthetic Biology Market Forecast, 2022-2032 (US$ billion, AGR %)
Figure 518 Rest of Latin America Synthetic Biology Market Forecast by Product Type, 2022-2032 (US$ billion, AGR %)
Figure 519 Rest of Latin America Synthetic Biology Market Share Forecast by Product Type, 2022 & 2032 (%)
Figure 520 Rest of Latin America Synthetic Biology Market Forecast by Technology, 2022-2032 (US$ billion, AGR %)
Figure 521 Rest of Latin America Synthetic Biology Market Share Forecast by Technology, 2022 & 2032 (%)
Figure 522 Rest of Latin America Synthetic Biology Market Forecast by Application, 2022-2032 (US$ billion, AGR %)
Figure 523 Rest of Latin America Synthetic Biology Market Share Forecast by End-users, 2022 & 2032 (%)
Figure 524 Rest of Latin America Synthetic Biology Market Forecast by Medical & Pharmaceutical Applications, 2022-2032 (US$ billion, AGR %)
Figure 525 Rest of Latin America Synthetic Biology Market Share Forecast by Medical & Pharmaceutical Applications, 2022 & 2032 (%)
Figure 526 Rest of Latin America Synthetic Biology Market Forecast by Drug Discovery and Therapeutics, 2022-2032 (US$ billion, AGR %)
Figure 527 Rest of Latin America Synthetic Biology Market Share Forecast by Drug Discovery and Therapeutics, 2022 & 2032 (%)
Figure 528 Rest of Latin America Synthetic Biology Market Forecast by Artificial Tissue & Tissue Regeneration, 2022-2032 (US$ billion, AGR %)
Figure 529 Rest of Latin America Synthetic Biology Market Share Forecast by Artificial Tissue & Tissue Regeneration, 2022 & 2032 (%)
Figure 530 Rest of Latin America Synthetic Biology Market Forecast by Industrial Applications, 2022-2032 (US$ billion, AGR %)
Figure 531 Rest of Latin America Synthetic Biology Market Share Forecast by Industrial Applications, 2022 & 2032 (%)
Figure 532 Rest of Latin America Synthetic Biology Market Forecast by Industrial Enzymes, 2022-2032 (US$ billion, AGR %)
Figure 533 Rest of Latin America Synthetic Biology Market Share Forecast by Industrial Enzymes, 2022 & 2032 (%)
Figure 534 Rest of Latin America Synthetic Biology Market Forecast by Environmental Applications, 2022-2032 (US$ billion, AGR %)
Figure 535 Rest of Latin America Synthetic Biology Market Share Forecast by Environmental Applications, 2022 & 2032 (%)
Figure 536 MEA Synthetic Biology Market Attractiveness Index
Figure 537 MEA Synthetic Biology Market by Region, 2022, 2027 & 2032 (US$ billion)
Figure 538 MEA Synthetic Biology Market Forecast by Country, 2022-2032 (US$ billion, AGR %)
Figure 539 MEA Synthetic Biology Market Share Forecast by Country, 2022 & 2032 (%)
Figure 540 MEA Synthetic Biology Market Forecast by Product Type, 2022-2032 (US$ billion, AGR %)
Figure 541 MEA Synthetic Biology Market Share Forecast by Product Type, 2022 & 2032 (%)
Figure 542 MEA Synthetic Biology Market Forecast by Technology, 2022-2032 (US$ billion, AGR %)
Figure 543 MEA Synthetic Biology Market Share Forecast by Technology, 2022 & 2032 (%)
Figure 544 MEA Synthetic Biology Market Forecast by Application, 2022-2032 (US$ billion, AGR %)
Figure 545 MEA Synthetic Biology Market Share Forecast by Application, 2022 & 2032 (%)
Figure 546 MEA Synthetic Biology Market Forecast by Medical & Pharmaceutical Applications, 2022-2032 (US$ billion, AGR %)
Figure 547 MEA Synthetic Biology Market Share Forecast by Medical & Pharmaceutical Applications, 2022 & 2032 (%)
Figure 548 MEA Synthetic Biology Market Forecast by Drug Discovery and Therapeutics, 2022-2032 (US$ billion, AGR %)
Figure 549 MEA Synthetic Biology Market Share Forecast by Drug Discovery and Therapeutics, 2022 & 2032 (%)
Figure 550 MEA Synthetic Biology Market Forecast by Artificial Tissue & Tissue Regeneration, 2022-2032 (US$ billion, AGR %)
Figure 551 MEA Synthetic Biology Market Share Forecast by Artificial Tissue & Tissue Regeneration, 2022 & 2032 (%)
Figure 552 MEA Synthetic Biology Market Forecast by Industrial Applications, 2022-2032 (US$ billion, AGR %)
Figure 553 MEA Synthetic Biology Market Share Forecast by Industrial Applications, 2022 & 2032 (%)
Figure 554 MEA Synthetic Biology Market Forecast by Industrial Enzymes, 2022-2032 (US$ billion, AGR %)
Figure 555 MEA Synthetic Biology Market Share Forecast by Industrial Enzymes, 2022 & 2032 (%)
Figure 556 MEA Synthetic Biology Market Forecast by Environmental Applications, 2022-2032 (US$ billion, AGR %)
Figure 557 MEA Synthetic Biology Market Share Forecast by Environmental Applications, 2022 & 2032 (%)
Figure 558 Turkey Synthetic Biology Market Forecast, 2022-2032 (US$ billion, AGR %)
Figure 559 Turkey Synthetic Biology Market Forecast by Product Type, 2022-2032 (US$ billion, AGR %)
Figure 560 Turkey Synthetic Biology Market Share Forecast by Product Type, 2022 & 2032 (%)
Figure 561 Turkey Synthetic Biology Market Forecast by Technology, 2022-2032 (US$ billion, AGR %)
Figure 562 Turkey Synthetic Biology Market Share Forecast by Technology, 2022 & 2032 (%)
Figure 563 Turkey Synthetic Biology Market Forecast by Application, 2022-2032 (US$ billion, AGR %)
Figure 564 Turkey Synthetic Biology Market Share Forecast by Application, 2022 & 2032 (%)
Figure 565 Turkey Synthetic Biology Market Forecast by Medical & Pharmaceutical Applications, 2022-2032 (US$ billion, AGR %)
Figure 566 Turkey Synthetic Biology Market Share Forecast by Medical & Pharmaceutical Applications, 2022 & 2032 (%)
Figure 567 Turkey Synthetic Biology Market Forecast by Drug Discovery and Therapeutics, 2022-2032 (US$ billion, AGR %)
Figure 568 Turkey Synthetic Biology Market Share Forecast by Drug Discovery and Therapeutics, 2022 & 2032 (%)
Figure 569 Turkey Synthetic Biology Market Forecast by Artificial Tissue & Tissue Regeneration, 2022-2032 (US$ billion, AGR %)
Figure 570 Turkey Synthetic Biology Market Share Forecast by Artificial Tissue & Tissue Regeneration, 2022 & 2032 (%)
Figure 571 Turkey Synthetic Biology Market Forecast by Industrial Applications, 2022-2032 (US$ billion, AGR %)
Figure 572 Turkey Synthetic Biology Market Share Forecast by Industrial Applications, 2022 & 2032 (%)
Figure 573 Turkey Synthetic Biology Market Forecast by Industrial Enzymes, 2022-2032 (US$ billion, AGR %)
Figure 574 Turkey Synthetic Biology Market Share Forecast by Industrial Enzymes, 2022 & 2032 (%)
Figure 575 Turkey Synthetic Biology Market Forecast by Environmental Applications, 2022-2032 (US$ billion, AGR %)
Figure 576 Turkey Synthetic Biology Market Share Forecast by Environmental Applications, 2022 & 2032 (%)
Figure 577 Saudi Arabia Synthetic Biology Market Forecast, 2022-2032 (US$ billion, AGR %)
Figure 578 Saudi Arabia Synthetic Biology Market Forecast by Product Type, 2022-2032 (US$ billion, AGR %)
Figure 579 Saudi Arabia Synthetic Biology Market Share Forecast by Product Type, 2022 & 2032 (%)
Figure 580 Saudi Arabia Synthetic Biology Market Forecast by Technology, 2022-2032 (US$ billion, AGR %)
Figure 581 Saudi Arabia Synthetic Biology Market Share Forecast by Technology, 2022 & 2032 (%)
Figure 582 Saudi Arabia Synthetic Biology Market Forecast by Application, 2022-2032 (US$ billion, AGR %)
Figure 583 Saudi Arabia Synthetic Biology Market Share Forecast by End-users, 2022 & 2032 (%)
Figure 584 Saudi Arabia Synthetic Biology Market Forecast by Medical & Pharmaceutical Applications, 2022-2032 (US$ billion, AGR %)
Figure 585 Saudi Arabia Synthetic Biology Market Share Forecast by Medical & Pharmaceutical Applications, 2022 & 2032 (%)
Figure 586 Saudi Arabia Synthetic Biology Market Forecast by Drug Discovery and Therapeutics, 2022-2032 (US$ billion, AGR %)
Figure 587 Saudi Arabia Synthetic Biology Market Share Forecast by Drug Discovery and Therapeutics, 2022 & 2032 (%)
Figure 588 Saudi Arabia Synthetic Biology Market Forecast by Artificial Tissue & Tissue Regeneration, 2022-2032 (US$ billion, AGR %)
Figure 589 Saudi Arabia Synthetic Biology Market Share Forecast by Artificial Tissue & Tissue Regeneration, 2022 & 2032 (%)
Figure 590 Saudi Arabia Synthetic Biology Market Forecast by Industrial Applications, 2022-2032 (US$ billion, AGR %)
Figure 591 Saudi Arabia Synthetic Biology Market Share Forecast by Industrial Applications, 2022 & 2032 (%)
Figure 592 Saudi Arabia Synthetic Biology Market Forecast by Industrial Enzymes, 2022-2032 (US$ billion, AGR %)
Figure 593 Saudi Arabia Synthetic Biology Market Share Forecast by Industrial Enzymes, 2022 & 2032 (%)
Figure 594 Saudi Arabia Synthetic Biology Market Forecast by Environmental Applications, 2022-2032 (US$ billion, AGR %)
Figure 595 Saudi Arabia Synthetic Biology Market Share Forecast by Environmental Applications, 2022 & 2032 (%)
Figure 596 South Africa Synthetic Biology Market Forecast, 2022-2032 (US$ billion, AGR %)
Figure 597 South Africa Synthetic Biology Market Forecast by Product Type, 2022-2032 (US$ billion, AGR %)
Figure 598 South Africa Synthetic Biology Market Share Forecast by Product Type, 2022 & 2032 (%)
Figure 599 South Africa Synthetic Biology Market Forecast by Technology, 2022-2032 (US$ billion, AGR %)
Figure 600 South Africa Synthetic Biology Market Share Forecast by Technology, 2022 & 2032 (%)
Figure 601 South Africa Synthetic Biology Market Forecast by Application, 2022-2032 (US$ billion, AGR %)
Figure 602 South Africa Synthetic Biology Market Share Forecast by Application, 2022 & 2032 (%)
Figure 603 South Africa Synthetic Biology Market Forecast by Medical & Pharmaceutical Applications, 2022-2032 (US$ billion, AGR %)
Figure 604 South Africa Synthetic Biology Market Share Forecast by Medical & Pharmaceutical Applications, 2022 & 2032 (%)
Figure 605 South Africa Synthetic Biology Market Forecast by Drug Discovery and Therapeutics, 2022-2032 (US$ billion, AGR %)
Figure 606 South Africa Synthetic Biology Market Share Forecast by Drug Discovery and Therapeutics, 2022 & 2032 (%)
Figure 607 South Africa Synthetic Biology Market Forecast by Artificial Tissue & Tissue Regeneration, 2022-2032 (US$ billion, AGR %)
Figure 608 South Africa Synthetic Biology Market Share Forecast by Artificial Tissue & Tissue Regeneration, 2022 & 2032 (%)
Figure 609 South Africa Synthetic Biology Market Forecast by Industrial Applications, 2022-2032 (US$ billion, AGR %)
Figure 610 South Africa Synthetic Biology Market Share Forecast by Industrial Applications, 2022 & 2032 (%)
Figure 611 South Africa Synthetic Biology Market Forecast by Industrial Enzymes, 2022-2032 (US$ billion, AGR %)
Figure 612 South Africa Synthetic Biology Market Share Forecast by Industrial Enzymes, 2022 & 2032 (%)
Figure 613 South Africa Synthetic Biology Market Forecast by Environmental Applications, 2022-2032 (US$ billion, AGR %)
Figure 614 South Africa Synthetic Biology Market Share Forecast by Environmental Applications, 2022 & 2032 (%)
Figure 615 UAE Synthetic Biology Market Forecast, 2022-2032 (US$ billion, AGR %)
Figure 616 UAE Synthetic Biology Market Forecast by Product Type, 2022-2032 (US$ billion, AGR %)
Figure 617 UAE Synthetic Biology Market Share Forecast by Product Type, 2022 & 2032 (%)
Figure 618 UAE Synthetic Biology Market Forecast by Technology, 2022-2032 (US$ billion, AGR %)
Figure 619 UAE Synthetic Biology Market Share Forecast by Technology, 2022 & 2032 (%)
Figure 620 UAE Synthetic Biology Market Forecast by Application, 2022-2032 (US$ billion, AGR %)
Figure 621 UAE Synthetic Biology Market Share Forecast by End-users, 2022 & 2032 (%)
Figure 622 UAE Synthetic Biology Market Forecast by Medical & Pharmaceutical Applications, 2022-2032 (US$ billion, AGR %)
Figure 623 UAE Synthetic Biology Market Share Forecast by Medical & Pharmaceutical Applications, 2022 & 2032 (%)
Figure 624 UAE Synthetic Biology Market Forecast by Drug Discovery and Therapeutics, 2022-2032 (US$ billion, AGR %)
Figure 625 UAE Synthetic Biology Market Share Forecast by Drug Discovery and Therapeutics, 2022 & 2032 (%)
Figure 626 UAE Synthetic Biology Market Forecast by Artificial Tissue & Tissue Regeneration, 2022-2032 (US$ billion, AGR %)
Figure 627 UAE Synthetic Biology Market Share Forecast by Artificial Tissue & Tissue Regeneration, 2022 & 2032 (%)
Figure 628 UAE Synthetic Biology Market Forecast by Industrial Applications, 2022-2032 (US$ billion, AGR %)
Figure 629 UAE Synthetic Biology Market Share Forecast by Industrial Applications, 2022 & 2032 (%)
Figure 630 UAE Synthetic Biology Market Forecast by Industrial Enzymes, 2022-2032 (US$ billion, AGR %)
Figure 631 UAE Synthetic Biology Market Share Forecast by Industrial Enzymes, 2022 & 2032 (%)
Figure 632 UAE Synthetic Biology Market Forecast by Environmental Applications, 2022-2032 (US$ billion, AGR %)
Figure 633 UAE Synthetic Biology Market Share Forecast by Environmental Applications, 2022 & 2032 (%)
Figure 634 Egypt Synthetic Biology Market Forecast, 2022-2032 (US$ billion, AGR %)
Figure 635 Egypt Synthetic Biology Market Forecast by Product Type, 2022-2032 (US$ billion, AGR %)
Figure 636 Egypt Synthetic Biology Market Share Forecast by Product Type, 2022 & 2032 (%)
Figure 637 Egypt Synthetic Biology Market Forecast by Technology, 2022-2032 (US$ billion, AGR %)
Figure 638 Egypt Synthetic Biology Market Share Forecast by Technology, 2022 & 2032 (%)
Figure 639 Egypt Synthetic Biology Market Forecast by Application, 2022-2032 (US$ billion, AGR %)
Figure 640 Egypt Synthetic Biology Market Share Forecast by Application, 2022 & 2032 (%)
Figure 641 Egypt Synthetic Biology Market Forecast by Medical & Pharmaceutical Applications, 2022-2032 (US$ billion, AGR %)
Figure 642 Egypt Synthetic Biology Market Share Forecast by Medical & Pharmaceutical Applications, 2022 & 2032 (%)
Figure 643 Egypt Synthetic Biology Market Forecast by Drug Discovery and Therapeutics, 2022-2032 (US$ billion, AGR %)
Figure 644 Egypt Synthetic Biology Market Share Forecast by Drug Discovery and Therapeutics, 2022 & 2032 (%)
Figure 645 Egypt Synthetic Biology Market Forecast by Artificial Tissue & Tissue Regeneration, 2022-2032 (US$ billion, AGR %)
Figure 646 Egypt Synthetic Biology Market Share Forecast by Artificial Tissue & Tissue Regeneration, 2022 & 2032 (%)
Figure 647 Egypt Synthetic Biology Market Forecast by Industrial Applications, 2022-2032 (US$ billion, AGR %)
Figure 648 Egypt Synthetic Biology Market Share Forecast by Industrial Applications, 2022 & 2032 (%)
Figure 649 Egypt Synthetic Biology Market Forecast by Industrial Enzymes, 2022-2032 (US$ billion, AGR %)
Figure 650 Egypt Synthetic Biology Market Share Forecast by Industrial Enzymes, 2022 & 2032 (%)
Figure 651 Egypt Synthetic Biology Market Forecast by Environmental Applications, 2022-2032 (US$ billion, AGR %)
Figure 652 Egypt Synthetic Biology Market Share Forecast by Environmental Applications, 2022 & 2032 (%)
Figure 653 Rest of MEA Synthetic Biology Market Forecast, 2022-2032 (US$ billion, AGR %)
Figure 654 Rest of MEA Synthetic Biology Market Forecast by Product Type, 2022-2032 (US$ billion, AGR %)
Figure 655 Rest of MEA Synthetic Biology Market Share Forecast by Product Type, 2022 & 2032 (%)
Figure 656 Rest of MEA Synthetic Biology Market Forecast by Technology, 2022-2032 (US$ billion, AGR %)
Figure 657 Rest of MEA Synthetic Biology Market Share Forecast by Technology, 2022 & 2032 (%)
Figure 658 Rest of MEA Synthetic Biology Market Forecast by Application, 2022-2032 (US$ billion, AGR %)
Figure 659 Rest of MEA Synthetic Biology Market Share Forecast by End-users, 2022 & 2032 (%)
Figure 660 Rest of MEA Synthetic Biology Market Forecast by Medical & Pharmaceutical Applications, 2022-2032 (US$ billion, AGR %)
Figure 661 Rest of MEA Synthetic Biology Market Share Forecast by Medical & Pharmaceutical Applications, 2022 & 2032 (%)
Figure 662 Rest of MEA Synthetic Biology Market Forecast by Drug Discovery and Therapeutics, 2022-2032 (US$ billion, AGR %)
Figure 663 Rest of MEA Synthetic Biology Market Share Forecast by Drug Discovery and Therapeutics, 2022 & 2032 (%)
Figure 664 Rest of MEA Synthetic Biology Market Forecast by Artificial Tissue & Tissue Regeneration, 2022-2032 (US$ billion, AGR %)
Figure 665 Rest of MEA Synthetic Biology Market Share Forecast by Artificial Tissue & Tissue Regeneration, 2022 & 2032 (%)
Figure 666 Rest of MEA Synthetic Biology Market Forecast by Industrial Applications, 2022-2032 (US$ billion, AGR %)
Figure 667 Rest of MEA Synthetic Biology Market Share Forecast by Industrial Applications, 2022 & 2032 (%)
Figure 668 Rest of MEA Synthetic Biology Market Forecast by Industrial Enzymes, 2022-2032 (US$ billion, AGR %)
Figure 669 Rest of MEA Synthetic Biology Market Share Forecast by Industrial Enzymes, 2022 & 2032 (%)
Figure 670 Rest of MEA Synthetic Biology Market Forecast by Environmental Applications, 2022-2032 (US$ billion, AGR %)
Figure 671 Rest of MEA Synthetic Biology Market Share Forecast by Environmental Applications, 2022 & 2032 (%)
Figure 672 Global Synthetic Biology Market: Company Share Analysis, 2021
Figure 673 Thermo Fisher Scientific Inc.: Net Revenue, 2017-2021 (US$ million, AGR%)
Figure 674 Thermo Fisher Scientific Inc.: Regional Market Shares, 2021
Figure 675 Thermo Fisher Scientific Inc.: Gross Profit, 2017-2021 (US$ million, AGR%)
Figure 676 Thermo Fisher Scientific Inc.: R&D, 2017-2021 (US$ million, AGR%)
Figure 677 Agilent Technologies Inc.: Net Revenue, 2017-2021 (US$ million, AGR%)
Figure 678 Agilent Technologies Inc.: Regional Market Shares, 2021
Figure 679 Agilent Technologies Inc.: Gross Profit, 2017-2021 (US$ million, AGR%)
Figure 680 Agilent Technologies Inc.: R&D, 2017-2021 (US$ million, AGR%)
Figure 681 Merck KGaA: Net Revenue, 2017-2021 (US$ million, AGR%)
Figure 682 Merck KGaA: Regional Market Shares, 2021
Figure 683 Merck KGaA: Gross Profit, 2017-2021 (US$ million, AGR%)
Figure 684 Merck KGaA: R&D, 2017-2021 (US$ million, AGR%)
Figure 685 Genscript Biotech Corporation: Net Revenue, 2017-2021 (US$ million, AGR%)
Figure 686 Genscript Biotech Corporation: Gross Profit, 2017-2021 (US$ million, AGR%)
Figure 687 Genscript Biotech Corporation: R&D, 2017-2021 (US$ million, AGR%)
Figure 688 Precigen Inc.: Net Revenue, 2017-2021 (US$ million, AGR%)
Figure 689 Precigen Inc.: Gross Profit, 2017-2021 (US$ million, AGR%)
Figure 690 Precigen Inc.: R&D, 2017-2021 (US$ million, AGR%)
Figure 691 Ginkgo Bioworks: Net Revenue, 2017-2021 (US$ million, AGR%)
Figure 692 Ginkgo Bioworks: Regional Market Shares, 2021
Figure 693 Ginkgo Bioworks: Gross Profit, 2017-2021 (US$ million, AGR%)
Figure 694 Ginkgo Bioworks: R&D, 2017-2021 (US$ million, AGR%)
Figure 695 Danaher Corporation: Net Revenue, 2017-2021 (US$ million, AGR%)
Figure 696 Danaher Corporation: Regional Market Shares, 2021
Figure 697 Danaher Corporation: Gross Profit, 2017-2021 (US$ million, AGR%)
Figure 698 Danaher Corporation: R&D, 2017-2021 (US$ million, AGR%)
Figure 699 Twist Bioscience Corp.: Net Revenue, 2017-2021 (US$ million, AGR%)
Figure 700 Twist Bioscience Corp.: Regional Market Shares, 2021
Figure 701 Twist Bioscience Corp.: Gross Profit, 2017-2021 (US$ million, AGR%)
Figure 702 Twist Bioscience Corp.: R&D, 2017-2021 (US$ million, AGR%)
Figure 703 Codexis, Inc.: Net Revenue, 2017-2021 (US$ million, AGR%)
Figure 704 Codexis, Inc.: Regional Market Shares, 2021
Figure 705 Codexis, Inc.: Gross Profit, 2017-2021 (US$ million, AGR%)
Figure 706 Codexis, Inc.: R&D, 2017-2021 (US$ million, AGR%)
Figure 707 Amyris, Inc.: Net Revenue, 2017-2021 (US$ million, AGR%)
Figure 708 Amyris, Inc.: Gross Profit, 2017-2021 (US$ million, AGR%)
Figure 709 Amyris, Inc.: R&D, 2017-2021 (US$ million, AGR%)
Figure 710 Synlogic: Net Revenue, 2017-2021 (US$ million, AGR%)
ページTOPに戻る
本レポートと同じKEY WORD(t)の最新刊レポート
- 本レポートと同じKEY WORDの最新刊レポートはありません。
よくあるご質問
Visiongain社はどのような調査会社ですか?
英国の調査会社ヴィジョンゲイン社(Visiongain)は、通信とエネルギーのほか、自動車や化学・医薬品、金属など、広範な市場を対象に調査を行っています。自動車市場については、市場全般に関する調査のほ... もっと見る
調査レポートの納品までの日数はどの程度ですか?
在庫のあるものは速納となりますが、平均的には 3-4日と見て下さい。
但し、一部の調査レポートでは、発注を受けた段階で内容更新をして納品をする場合もあります。
発注をする前のお問合せをお願いします。
注文の手続きはどのようになっていますか?
1)お客様からの御問い合わせをいただきます。
2)見積書やサンプルの提示をいたします。
3)お客様指定、もしくは弊社の発注書をメール添付にて発送してください。
4)データリソース社からレポート発行元の調査会社へ納品手配します。
5) 調査会社からお客様へ納品されます。最近は、pdfにてのメール納品が大半です。
お支払方法の方法はどのようになっていますか?
納品と同時にデータリソース社よりお客様へ請求書(必要に応じて納品書も)を発送いたします。
お客様よりデータリソース社へ(通常は円払い)の御振り込みをお願いします。
請求書は、納品日の日付で発行しますので、翌月最終営業日までの当社指定口座への振込みをお願いします。振込み手数料は御社負担にてお願いします。
お客様の御支払い条件が60日以上の場合は御相談ください。
尚、初めてのお取引先や個人の場合、前払いをお願いすることもあります。ご了承のほど、お願いします。
データリソース社はどのような会社ですか?
当社は、世界各国の主要調査会社・レポート出版社と提携し、世界各国の市場調査レポートや技術動向レポートなどを日本国内の企業・公官庁及び教育研究機関に提供しております。
世界各国の「市場・技術・法規制などの」実情を調査・収集される時には、データリソース社にご相談ください。
お客様の御要望にあったデータや情報を抽出する為のレポート紹介や調査のアドバイスも致します。
|
|


