レドーム市場レポート 2022-2032
Radome Market Report 2022-2032
レポート詳細
レドーム市場レポート 2022-2032 :本レポートは、新たな収益の柱を目指すリーディングカンパニーが、業界とその背景にあるダイナミクスをより深く理解する上で、非常に有益なものとなる... もっと見る
※上記価格は部署ライセンス(Departmental licence)価格です。
その他の価格についてはデータリソースまでお問合せください。
日本語のページは自動翻訳を利用し作成しています。
実際のレポートは英文のみでご納品いたします。
サマリー
レポート詳細
レドーム市場レポート 2022-2032:本レポートは、新たな収益の柱を目指すリーディングカンパニーが、業界とその背景にあるダイナミクスをより深く理解する上で、非常に有益なものとなるでしょう。また、異業種への進出や新地域での既存事業の拡大を目指す企業にとっても有用なレポートです。
無人航空機(UAV)向けレドーム需要の増加
無人航空機(UAV)は、軍事用途、特に偵察機として古くから使用されており、技術の進歩に伴い、防衛用途も拡大し続けている。ドローンの開発は、中国の台頭などの地政学的な要因によって加速度的に進んでいる。中国が地域の覇権を握ろうとする中で、ドローン技術の開発は極めて重要である。2020年のドローンの需要は、軍事・法執行機関を含む政府カテゴリーが中心で、世界市場の70%以上を占めている。
軍用ドローンの需要増は、世界のレドームビジネスの主要な成長要因となっています。軍用ドローンは、ナビゲーションシステム、機体、接点接続、オートパイロット、エンジン、センサーパッケージなど、さまざまな機器を搭載しています。また、軍事・国家安全保障上の脅威が発展するにつれ、軍事用空中情報・監視・偵察(ISR)技術の複雑さと能力は、その要求に応えるために成長する必要があります。情報、監視、偵察(ISR)に使用されるチャンネルとデータの種類は増加し、より多くのデータ処理、ストレージ、セキュリティ、配信が必要になっています。これらの要因は、予測期間中にレドーム市場の集中のための新しい道を開くと予想されます。
マーケットリサーチレポートを購入する前に、どのような質問をすべきでしょうか?
- レドーム市場はどのように進化しているのか?
- レドーム市場の推進要因と抑制要因は何か?
- 各レドームサブマーケットセグメントは予測期間中にどのように成長し、2032年にどれだけの収益を占めるようになるのか?
- 2022年から2032年にかけて、各レドームサブマーケットの市場シェアはどのように推移するのでしょうか?
- 2022年から2032年にかけて、市場全体の主要なドライバーは何でしょうか?
- 主要なレドーム市場はマクロ経済のダイナミクスに概ね追随するのか、それとも個々の国内市場が他を凌駕するのか?
- 2032年までに各国市場のシェアはどのように変化し、どの地域が2032年に市場をリードするのか?
- 主要プレイヤーは誰か、また予測期間中の見通しは?
- これらのリーディングカンパニーのレドームプロジェクトはどのようなものですか?
- 2020年から2032年にかけて、業界はどのように進化していくのでしょうか?現在および今後10年間に実施されるレドームプロジェクトにはどのような意味があるのでしょうか?
- レドーム市場をさらに拡大するために、製品の商業化の必要性は高まっているのか?
- レドーム市場はどこへ向かっているのか、そして市場の最前線に立つにはどうすればいいのか?
これが現在、そして今後10年間のレドーム市場にどのような影響を与えるかを見極める必要があります。
- 本レポートは247ページにわたり、102の表と137のグラフを掲載しています。
- このレポートでは、業界における主要な収益性の高い分野をハイライトしているため、今すぐターゲットを絞ることができます。
- 世界、地域、国別の売上高と成長率を詳細に分析しています。
- 競合他社が成功した主要なトレンド、変化、収益予測をハイライトしています。
このレポートは、レドーム市場が今後10年間にどのように発展し、COVID-19の景気後退とバウンスの変動に合わせて発展していくかを教えてくれるものです。この市場は、過去10年間のどの時点よりも今が重要なのです。
があります。レポートでは、COVID-19のバリエーションや経済データなど、お客様の市場に特化した独自の情報をお届けしています。
2032年までの予測やその他の分析により、商業的な展望が見えてくる
- 2032年までの収益予測に加え、直近の実績、成長率、市場シェアもご覧いただけます。
- ビジネスの展望や展開など、独自の分析もご覧いただけます。
- 定性的分析(市場力学、ドライバー、機会、阻害要因、課題など)、サプライチェーン分析、最近の動向をご覧いただけます。
本レポートでは、COVID-19が業界と貴社にどのような影響を与えるかについて、データ分析と貴重な洞察を掲載しています。本レポートでは、COVID-19の4つの回収パターンとその影響、すなわち「V」、「L」、「W」、「U」について論じています。
報告書の対象セグメント
素材別
- ガラス繊維
- PVC
- PE
- PTFE
- 石英
- その他
- 下流プロセス
用途別
・地上
- 無線アンテナ
- 航空交通管制(ATC)
- その他
・ 航空機
- 軍用機
- 民間機・ビジネス機
・船舶
- 軍用船舶
- 商業船舶
世界市場全体とセグメントの収益予測に加え、5つの地域と18の主要国市場の収益予測も掲載しています。
北アメリカ
- 米国
- カナダ
欧州
- ドイツ
- スペイン
- イギリス
- ロシア
- フランス
- イタリア
- その他の欧州
アジア太平洋
- 中国
- 日本
- インド
- オーストラリア
- 南朝鮮
- その他のアジア太平洋地域
ラテンアメリカ
- ブラジル
- メキシコ
- アルゼンチン
- ラテンアメリカのその他の地域
中東・アフリカ
- GCC
- 南アフリカ
レドーム市場の主要企業のプロファイルと2022年から2032年まで、これらの企業のこのセグメントに焦点を当てたものも含まれています。
主要企業と市場成長の可能性
・ Astronics Corporation
・ BAE Systems
・ Boeing
・ Comtech Telecommunications
・ CPI International
・ Flir Systems
・ General Dynamics Corporation
・ Kitsap Composites
・ Lockheed Martin
・ Lufthansa Technik
・ Meggitt PLC
・ NORDAM Group, Inc.
・ Northrop Grumman Corp.
・ Saint-Gobain Performance Plastics
・ Starwin Industries
レドーム市場の世界全体の収益、金額で2022年から2032年まで、市場は2022年に17億米ドルを超えると、我々の仕事は計算されます。2032年までの間に収益が大きく伸びると予測している。弊社では、最も大きな可能性を秘めた企業を特定しています。彼らの能力、進歩、商業的展望を知ることで、一歩先を行くことができます。
レドーム市場、2022年から2032年までの市場レポートはどのように役立つのでしょうか?
240ページを超えるレポートでは、要約すると以下のような知識を得ることができます。
- レドーム市場、2022年から2032年までの収益予測 世界と地域レベルでの材料、用途、各予測を掲載 - 業界の展望を見出し、投資と収益に最も有利な場所を見つける。
- 5地域と18主要国市場の2032年までの収益予測 - 北米、欧州、アジア太平洋、中南米、中東&アフリカのレドーム市場、2022年から2032年までの市場予測をご覧いただけます。また、米国、カナダ、メキシコ、ブラジル、ドイツ、フランス、英国、イタリア、スペイン、ロシア、中国、インド、日本、オーストラリアなどの主要経済圏における市場規模の推定と予測も行っています。
- レドーム市場に関わる主要企業15社の企業プロファイルを含む、2022年から2032年までの既存企業および市場参入を目指す企業にとっての展望。
定量的・定性的な分析と独自の予測をご覧いただけます。私たちのレポートだけが持つ情報を入手し、貴重なビジネスインテリジェンスを得ることができます。
他にはない情報
私たちの新しいレポートがあれば、知識の遅れを取り戻し、チャンスを逃す可能性が低くなります。私たちの研究が貴社の研究、分析、意思決定にどのように役立つかをご覧ください。Visiongainの調査は、レドーム市場、2022年から2032年、市場をリードする企業のための商業分析を必要とするすべての人のためのものです。データ、トレンド、予測をご覧いただけます。
ページTOPに戻る
目次
目次
1.レポートの概要
1.1 研究の目的
1.2 レドーム市場の紹介
1.3 本レポートが提供するもの
1.4 なぜ本レポートを読むべきなのか?
1.5 本分析レポートが回答する重要な質問
1.6 本レポートは誰のためのものなのか?
1.7 方法論
1.7.1 市場の定義
1.7.2 市場評価・予測手法
1.7.3 データの検証
1.8 よくある質問と回答(FAQ)
1.9 関連するVisiongainレポート
1.10 Visiongainについて
2 エグゼクティブサマリー
3 プレミアムインサイト
3.1 地域別スナップショット。レドームの世界市場
3.2 材料別セグメント市場魅力度指数
3.3 アプリケーションセグメント市場魅力度指数
4 市場の概要
4.1 市場のダイナミクス
4.1.1 市場の推進要因
4.1.2 市場の抑制要因
4.1.3 市場機会
4.2 COVID-19影響度分析
4.3 ポーターのファイブフォース分析
4.3.1 サプライヤーパワー
4.3.2 バイヤーパワー
4.3.3 競争相手との競合
4.3.4 代替品による脅威
4.3.5 新規参入者の脅威
4.4 PEST分析
4.5 サプライチェーン分析
4.5.1 レドーム材料
4.5.2 材料供給者
4.5.3 メーカーとエンドユーザー
5 世界のレドーム市場分析:素材別
5.1 主な調査結果
5.2 材料別成長展望
5.3 レドームの素材別世界市場シェア(2022年・2032年)
5.4 ガラス繊維
5.4.1 ガラス繊維製レドームの長所
5.4.2 ガラス繊維の地域別市場予測(2022年~2032年)(単位:百万米ドル)
5.5 ポリ塩化ビニル(PVC)
5.5.1 PVC地域別市場予測、2022-2032年 (百万米ドル)
5.6 ポリウレタン(PE)
5.6.1 レドームにおけるポリウレタン発泡体
5.6.2 PE地域別市場予測、2022-2032年(百万米ドル)
5.7 ポリテトラフルオロエチレン(PTFE)
5.7.1 テフロンレドーム建設に有効な材料として利用可能
5.7.2 PTFE地域別市場予測、2022-2032年 (百万米ドル)
5.8 石英
5.8.1 航空宇宙用レドームにおける石英ファイバー
5.8.2 石英の地域別市場予測、2022-2032年(百万米ドル)
5.9 その他の材料
5.9.1 その他の材料の地域別市場予測、2022-2032年 (百万米ドル)
6 世界のレドーム市場分析:用途別
6.1 主な調査結果
6.2 アプリケーション別成長展望
6.3 レドームのアプリケーション別世界市場シェア(2022年・2032年)
6.4 地上アプリケーション
6.4.1 Sheergard(Saint-Gobain)社製サンドイッチ型レドーム
6.4.2 地上用レドームの地域別市場規模(2022年~2032年)(単位:百万米ドル)
6.4.3 地上用レドーム市場:タイプ別、2022年~2032年(百万米ドル)
6.5 航空機用途
6.5.1 航空機向けレドーム市場:地域別、2022-2032年 (百万米ドル)
6.5.2 航空機向けレドーム市場:タイプ別、2022年〜2032年(USD百万ドル)
6.6 船舶用途
6.6.1 船舶用途のレドーム市場:地域別、2022-2032 (百万米ドル)
6.6.2 船舶用途向けレドーム市場:タイプ別、2022-2032 (百万米ドル)
7 世界のレドーム市場分析:地域別
7.1 主な調査結果
7.2 地域別市場規模の推定と予測
7.3 COVID-19の影響度分析。回復シナリオ(V, U, W, L)
8 北米のレドーム市場分析
8.1 主な調査結果
8.2 北米レドーム市場魅力度指数
8.3 北米レドーム国別市場:2022年、2027年&2032年(USD Million)
8.4 北米レドーム市場の国別市場規模予測・予想
8.5 北米レドーム市場の素材別市場規模予測・予想
8.6 北米レドーム市場の用途別市場規模予測・予想
8.7 米国レドーム市場
8.8 カナダ レドーム市場
9 欧州のレドーム市場分析
9.1 主な調査結果
9.2 欧州レドーム市場魅力度指数
9.3 欧州レドーム国別市場:2022年、2027年&2032年(USD Million)
9.4 欧州レドーム市場 国別市場規模予測・予測
9.5 欧州レドーム市場の素材別市場規模予測・予測
9.6 欧州レドーム市場の用途別市場規模予測・予想
9.7 ドイツ レドーム市場
9.7.1 Vincorion社がユーロファイター「Quadriga」用レドームを供給
9.8 イギリス レドーム市場
9.9 フランス レドーム市場
9.9.1 フランスは3つの空軍基地にインドラ社のレーダーシステムを採用
9.10 イタリア レドーム市場
9.11 スペイン レドーム市場
9.12 ロシア レドーム市場
9.13 その他の欧州レドーム市場
10 アジア太平洋地域のレドーム市場分析
10.1 主な調査結果
10.2 アジア太平洋地域のレドーム市場魅力度指数
10.3 アジア太平洋地域のレドーム市場:国別、2022年、2027年&2032年(百万米ドル)
10.4 アジア太平洋地域のレドーム市場の国別市場規模予測・予想
10.5 アジア太平洋地域のレドーム市場の素材別市場規模予測・予想
10.6 アジア太平洋地域のレドーム市場の用途別市場規模予測・予想
10.7 中国レドーム市場
10.7.1 中国軍はインドと中国の国境沿いにレーダーを設置・更新している
10.7.2 サンゴバンが中国で初のレドームプロジェクトを完了
10.8 日本レドーム市場
10.8.1 シンセプティック社とセーレン社が覚書締結
10.9 インド レドーム市場
10.9.1 LCA-Tejasフリート用の新しいレドームのテスト
10.10 オーストラリア レドーム市場
10.11 韓国レドーム市場
10.12 東南アジアのレドーム市場
10.12.1 レオナルドがインドネシア空軍にレーダーシステムを提供
10.12.2 マレーシアのレドーム
10.13 その他のアジア太平洋地域のレドーム市場
10.13.1 中国軍機を監視する台湾のアップグレードされたレーダー
10.13.2 パキスタンはレーダーシステムを強化中
11 ラテンアメリカのレドーム市場分析
11.1 主要な調査結果
11.2 中南米レドーム市場魅力度指数
11.3 中南米のレドーム市場:国別、2022年、2027年&2032年 (百万USドル)
11.4 中南米レドーム市場の国別市場規模予測・予想
11.5 中南米レドーム市場の素材別市場規模予測・予想
11.6 中南米レドーム市場の用途別市場規模予測・予想
11.7 ブラジル レドーム市場
11.8 アルゼンチン レドーム市場
11.9 メキシコのレドーム市場
11.10 その他のラテンアメリカ地域のレドーム市場
11.10.1 Thales がチリに太陽電池駆動の航空管制レーダーステーションを配備
11.10.2 コロンビアの航空宇宙産業
12 中東・アフリカ地域のレドーム市場分析
12.1 主な調査結果
12.2 中東・アフリカ地域のレドーム市場魅力度指数
12.3 中東・アフリカ地域のレドーム国別市場:2022年、2027年、2032年 (百万米ドル)
12.4 中東・アフリカ地域の国別レドーム市場規模予測・予想
12.5 中東・アフリカ地域のレドーム市場の素材別市場規模予測・予想
12.6 中東・アフリカ地域のレドーム市場の用途別市場規模予測・予想
12.7 GCCレドーム市場
12.7.1 インドラがサウジアラビアにATCセンターを展開
12.8 南アフリカのレドーム市場
12.8.1 Hensoldt SAが新型海軍監視レーダーを発売
12.9 中東・アフリカその他の地域レドーム市場
13 競合他社の状況
13.1 企業シェア分析
13.2 主要事業戦略分析
14 主要企業のプロフィール
14.1 BAEシステムズ
14.1.1 会社概要
14.1.2 会社概要
14.1.3 会社の能力
14.1.4 財務分析
14.1.5 製品ベンチマーク
14.1.6 戦略的な展望
14.2 ゼネラルダイナミクス社
14.2.1 会社概要
14.2.2 会社概要
14.2.3 軍用機用レドーム
14.2.4 主要能力
14.2.5 レドームの資格取得実績
14.2.6 財務分析
14.2.7 製品ベンチマーク
14.2.8 戦略的展望
14.3 ロッキード・マーチン
14.3.1 企業スナップショット
14.3.2 会社概要
14.3.3 航空技術
14.3.4 ミサイル・火器管制
14.3.5 ロータリー&ミッションシステム
14.3.6 スペースシステム
14.3.7 財務分析
14.3.8 製品ベンチマーク
14.3.9 戦略的展望
14.4 キサップコンポジット
14.4.1 会社概要
14.4.2 会社概要
14.4.3 製品ベンチマーク
14.5 メギットPLC
14.5.1 企業スナップショット
14.5.2 会社概要
14.5.3 民生・軍事用レドーム
14.5.4 レドームの顧客
14.5.5 財務分析
14.5.6 製品ベンチマーク
14.5.7 戦略的展望
14.6 ノルダム・グループ
14.6.1 企業スナップショット
14.6.2 会社概要
14.6.3 製品ベンチマーク
14.6.4 戦略的展望
14.7 ノースロップグラマン社
14.7.1 企業スナップショット
14.7.2 会社概要
14.7.3 航空用EO/IR
14.7.4 陸上用EO/IR
14.7.5 海上用EO/IR
14.7.6 財務分析
14.7.7 製品ベンチマーク
14.7.8 戦略的展望
14.8 サンゴバン パフォーマンス プラスチックス
14.8.1 企業スナップショット
14.8.2 会社概要
14.8.3 製品ベンチマーク
14.8.4 戦略的展望
14.9 スターウィン・インダストリーズ
14.9.1 企業スナップショット
14.9.2 会社概要
14.9.3 レドーム
14.9.4 軍用機・艦艇用レドーム
14.9.5 ベンチマーキング
14.9.6 戦略的展望
14.10 CPI International Inc.
14.10.1 会社概要
14.10.2 会社概要
14.10.3 ビジネスユニット
14.10.4 製品ベンチマーク
14.10.5 戦略的展望
14.11 アストロニクス株式会社
14.11.1 企業スナップショット
14.11.2 会社概要
14.11.3 当社の製品ポートフォリオとソリューション
14.11.4 子会社
14.11.5 財務分析
14.11.6 製品ベンチマーク
14.11.7 戦略的な展望
14.12 コムテック・テレコミュニケーションズ
14.12.1 会社概要
14.12.2 会社概要
14.12.3 財務分析
14.12.4 製品ベンチマーク
14.12.5 戦略的展望
14.13 ルフトハンザ テクニーク
14.13.1 企業スナップショット
14.13.2 会社概要
14.13.3 専門的なOEM構造の構築
14.13.4 財務分析
14.13.5 製品ベンチマーク
14.13.6 戦略的な展望
14.14 フリアーシステムズ
14.14.1 企業スナップショット
14.14.2 会社概要
14.14.3 ベンチマーキング
14.14.4 戦略的展望
14.15 ボーイング
14.15.1 企業スナップショット
14.15.2 会社概要
14.15.3 民間航空機部門
14.15.4 防衛・宇宙・セキュリティ分野
14.15.5 グローバルサービス部門
14.15.6 ボーイング・キャピタル
14.15.7 ボーイングINEXAソリューションズ
14.15.8 財務分析
14.15.9 製品ベンチマーク
14.15.10 戦略的展望
15 結論と提言
15.1 ヴィジョンゲインからの結論
15.2 市場関係者への提言
15.2.1 発展途上国での拡大
15.2.2 レドーム構造における技術アップグレードの必要性
15.2.3 環境と信号に関する課題
用語集
表の一覧
Table 1 Global Radome Market Snapshot, 2022 & 2032 (USD Million, CAGR %)
Table 2 Global Radome Market Size by Glass-Fiber Material, 2022-2032 (USD Million, AGR %, CAGR %)
Table 3 Global Radome Market Size by PVC Material, 2022-2032 (USD Million, AGR %, CAGR %)
Table 4 Global Radome Market Size by PE Material, 2022-2032 (USD Million, AGR %, CAGR %)
Table 5 Global Radome Market Size by PTFE Material, 2022-2032 (USD Million, AGR %, CAGR %)
Table 6 Global Radome Market Size by Quartz Material, 2022-2032 (USD Million, AGR %, CAGR %)
Table 7 Global Radome Market Size by Other Materials Material, 2022-2032 (USD Million, AGR %, CAGR %)
Table 8 Global Radome Market Size by Ground Application, 2022-2032 (USD Million, AGR %, CAGR %)
Table 9 Global Radome Market Size for Ground Application by Type, 2022-2032 (USD Million, AGR %, CAGR %)
Table 10 Global Radome Market Size by Airborne Application, 2022-2032 (USD Million, AGR %, CAGR %)
Table 11 Global Radome Market Size for Airborne Application by Type, 2022-2032 (USD Million, AGR %, CAGR %)
Table 12 Global Radome Market Size by Shipboard Application, 2022-2032 (USD Million, AGR %, CAGR %)
Table 13 Global Radome Market Size for Shipboard Application by Type, 2022-2032 (USD Million, AGR %, CAGR %)
Table 14 Global Radome Market Size for Region, 2022-2032 (USD Million, AGR %, CAGR %)
Table 15 Global Radome Market Size for Region, 2022-2032 (USD Million, AGR %, CAGR %): V-Shaped Recovery
Table 16 Global Radome Market Size for Region, 2022-2032 (USD Million, AGR %, CAGR %): U-Shaped Recovery
Table 17 Global Radome Market Size for Region, 2022-2032 (USD Million, AGR %, CAGR %): W-Shaped Recovery
Table 18 Global Radome Market Size for Region, 2022-2032 (USD Million, AGR %, CAGR %): L-Shaped Recovery
Table 19 North America Radome Market Forecast by Country, 2022-2032 (USD Million, AGR%, CAGR%)
Table 20 North America Radome Market Forecast by Material, 2022-2032 (USD Million, AGR%, CAGR%)
Table 21 North America Radome Market Forecast by Application, 2022-2032 (USD Million, AGR%, CAGR%)
Table 22 U.S. Radome Market Forecast, 2022-2032 (USD Million, AGR%, CAGR%)
Table 23 Canada Radome Market Forecast, 2022-2032 (USD Million, AGR%, CAGR%)
Table 24 Europe Radome Market Forecast by Country, 2022-2032 (USD Million, AGR%, CAGR%)
Table 25 Europe Radome Market Forecast by Material, 2022-2032 (USD Million, AGR%, CAGR%)
Table 26 Europe Radome Market Forecast by Application, 2022-2032 (USD Million, AGR%, CAGR%)
Table 27 Germany Radome Market Forecast, 2022-2032 (USD Million, AGR%, CAGR%)
Table 28 UK Radome Market Forecast, 2022-2032 (USD Million, AGR%, CAGR%)
Table 29 France Radome Market Forecast, 2022-2032 (USD Million, AGR%, CAGR%)
Table 30 Italy Radome Market Forecast, 2022-2032 (USD Million, AGR%, CAGR%)
Table 31 Spain Radome Market Forecast, 2022-2032 (USD Million, AGR%, CAGR%)
Table 32 Russia Radome Market Forecast, 2022-2032 (USD Million, AGR%, CAGR%)
Table 33 Rest of Europe Radome Market Forecast, 2022-2032 (USD Million, AGR%, CAGR%)
Table 34 Asia Pacific Radome Market Forecast by Country, 2022-2032 (USD Million, AGR%, CAGR%)
Table 35 Asia Pacific Radome Market Forecast by Material, 2022-2032 (USD Million, AGR%, CAGR%)
Table 36 Asia Pacific Radome Market Forecast by Application, 2022-2032 (USD Million, AGR%, CAGR%)
Table 37 China Radome Market Forecast, 2022-2032 (USD Million, AGR%, CAGR%)
Table 38 Japan Radome Market Forecast, 2022-2032 (USD Million, AGR%, CAGR%)
Table 39 India Radome Market Forecast, 2022-2032 (USD Million, AGR%, CAGR%)
Table 40 Australia Radome Market Forecast, 2022-2032 (USD Million, AGR%, CAGR%)
Table 41 South Korea Radome Market Forecast, 2022-2032 (USD Million, AGR%, CAGR%)
Table 42 Southeast Asia Radome Market Forecast, 2022-2032 (USD Million, AGR%, CAGR%)
Table 43 Rest of Asia Pacific Radome Market Forecast, 2022-2032 (USD Million, AGR%, CAGR%)
Table 44 Latin America Radome Market Forecast by Country, 2022-2032 (USD Million, AGR%, CAGR%)
Table 45 Latin America Radome Market Forecast by Material, 2022-2032 (USD Million, AGR%, CAGR%)
Table 46 Latin America Radome Market Forecast by Application, 2022-2032 (USD Million, AGR%, CAGR%)
Table 47 Brazil Radome Market Forecast, 2022-2032 (USD Million, AGR%, CAGR%)
Table 48 Argentina Radome Market Forecast, 2022-2032 (USD Million, AGR%, CAGR%)
Table 49 Mexico Radome Market Forecast, 2022-2032 (USD Million, AGR%, CAGR%)
Table 50 Rest of Latin America Radome Market Forecast, 2022-2032 (USD Million, AGR%, CAGR%)
Table 51 Middle East & Africa Radome Market Forecast by Country, 2022-2032 (USD Million, AGR%, CAGR%)
Table 52 Middle East & Africa Radome Market Forecast by Material, 2022-2032 (USD Million, AGR%, CAGR%)
Table 53 Middle East & Africa Radome Market Forecast by Application, 2022-2032 (USD Million, AGR%, CAGR%)
Table 54 GCC Radome Market Forecast, 2022-2032 (USD Million, AGR%, CAGR%)
Table 55 South Africa Radome Market Forecast, 2022-2032 (USD Million, AGR%, CAGR%)
Table 56 Rest of Middle East & Africa Radome Market Forecast, 2022-2032 (USD Million, AGR%, CAGR%)
Table 57 Company Ranking Analysis
Table 58 Key Business Strategies Adopted by Key Players in Global Radome Market
Table 59 BAE Systems: Key Details, (CEO, HQ, Revenue, Founded, No. of Employees, Company Type, Website, Business Segment)
Table 60 BAE Systems: Product Benchmarking
Table 61 BAE Systems: Strategic Outlook
Table 62 General Dynamics Corporation: Key Details, (CEO, HQ, Revenue, Founded, No. of Employees, Company Type, Website, Business Segment)
Table 63 General Dynamics Corporation: Product Benchmarking
Table 64 General Dynamics Corporation: Strategic Outlook
Table 65 Lockheed Martin: Key Details, (CEO, HQ, Revenue, Founded, No. of Employees, Company Type, Website, Business Segment)
Table 66 Lockheed Martin: Product Benchmarking
Table 67 Lockheed Martin: Strategic Outlook
Table 68 Kitsap Composites: Key Details, (CEO, HQ, Revenue, Founded, No. of Employees, Company Type, Website, Business Segment)
Table 69 Kitsap Composites: Product Benchmarking
Table 70 Meggitt PLC: Key Details, (CEO, HQ, Revenue, Founded, No. of Employees, Company Type, Website, Business Segment)
Table 71 Meggitt PLC: Product Benchmarking
Table 72 Meggitt PLC: Strategic Outlook
Table 73 NORDAM Group, Inc.: Key Details, (CEO, HQ, Revenue, Founded, No. of Employees, Company Type, Website, Business Segment)
Table 74 NORDAM Group, Inc.: Product Benchmarking
Table 75 NORDAM Group, Inc.: Strategic Outlook
Table 76 Northrop Grumman Corp.: Key Details, (CEO, HQ, Revenue, Founded, No. of Employees, Company Type, Website, Business Segment)
Table 77 Northrop Grumman Corp.: Product Benchmarking
Table 78 Northrop Grumman Corp.: Strategic Outlook
Table 79 Saint-Gobain Performance Plastics: Key Details, (CEO, HQ, Revenue, Founded, No. of Employees, Company Type, Website, Business Segment)
Table 80 Saint-Gobain Performance Plastics: Product Benchmarking
Table 81 Saint-Gobain Performance Plastics: Strategic Outlook
Table 82 Starwin Industries: Key Details, (CEO, HQ, Revenue, Founded, No. of Employees, Company Type, Website, Business Segment)
Table 83 Starwin Industries: Product Benchmarking
Table 84 Starwin Industries: Strategic Outlook
Table 85 CPI International Inc.: Key Details, (CEO, HQ, Revenue, Founded, No. of Employees, Company Type, Website, Business Segment)
Table 86 CPI International Inc.: Product Benchmarking
Table 87 CPI International Inc.: Strategic Outlook
Table 88 Astronics Corporation: Key Details, (CEO, HQ, Revenue, Founded, No. of Employees, Company Type, Website, Business Segment)
Table 89 Astronics Corporation: Product Benchmarking
Table 90 Astronics Corporation: Strategic Outlook
Table 91 Comtech Telecommunications: Key Details, (CEO, HQ, Revenue, Founded, No. of Employees, Company Type, Website, Business Segment)
Table 92 Comtech Telecommunications: Product Benchmarking
Table 93 Comtech Telecommunications: Strategic Outlook
Table 94 Lufthansa Technik: Key Details, (CEO, HQ, Revenue, Founded, No. of Employees, Company Type, Website, Business Segment)
Table 95 Lufthansa Technik: Product Benchmarking
Table 96 Lufthansa Technik: Strategic Outlook
Table 97 Flir Systems: Key Details, (CEO, HQ, Revenue, Founded, No. of Employees, Company Type, Website, Business Segment)
Table 98 Flir Systems: Product Benchmarking
Table 99 Flir Systems: Strategic Outlook
Table 100 Boeing: Key Details, (CEO, HQ, Revenue, Founded, No. of Employees, Company Type, Website, Business Segment)
Table 101 Boeing: Product Benchmarking
Table 102 Boeing: Strategic Outlook
図の一覧
Figure 1 Global Radome Market Segmentation
Figure 2 Global Radome Market Forecast by Region: Market Attractiveness Index
Figure 3 Global Radome Market by Material: Market Attractiveness Index
Figure 4 Global Radome Market by Application: Market Attractiveness Index
Figure 5 Global Radome Market: Market Dynamics
Figure 6 Global Radome Market: Market Dynamics
Figure 7 Global COVID Impact Analysis: Radome Market Recovery Scenarios
Figure 8 Global Radome Market: Porter’s Five Forces Analysis
Figure 9 Global Radome Market: PEST Analysis
Figure 10 Radome Industry: Supply Chain Analysis
Figure 11 Global Radome Market Forecast by Material
Figure 12 Global Radome Market Share Forecast by Material, 2022, 2032 (%)
Figure 13 Glass-Fiber Radome Market Forecast, 2022-2032 (US$ Million)
Figure 14 PVC Radome Market Forecast, 2022-2032 (US$ Million)
Figure 15 PE Radome Market Forecast, 2022-2032 (US$ Million)
Figure 16 PTFE Radome Market Forecast, 2022-2032 (US$ Million)
Figure 17 Quartz Radome Market Forecast, 2022-2032 (US$ Million)
Figure 18 Other Materials Radome Market Forecast, 2022-2032 (US$ Million)
Figure 19 Global Radome Market Forecast by Application
Figure 20 Global Radome Market Share Forecast by Application, 2022, 2032 (%)
Figure 21 Radome Market Forecast for Ground Application, 2022-2032 (US$ Million)
Figure 22 Global Radome Market Size for Ground Application by Type, 2022-2032 (US$ Million)
Figure 23 Radome Market Forecast for Airborne Application, 2022-2032 (US$ Million)
Figure 24 Global Radome Market Size for Airborne Application by Type, 2022-2032 (US$ Million)
Figure 25 Radome Market Forecast for Shipboard Application, 2022-2032 (US$ Million)
Figure 26 Global Radome Market Size for Shipboard Application by Type, 2022-2032 (US$ Million)
Figure 27 Global Radome Market Forecast by Region 2022, 2027, 2032 (Revenue, CAGR%)
Figure 28 Global Radome Market Share Forecast by Region 2022, 2027, 2032(%)
Figure 29 Global Radome Market by Region, 2022-2032 (USD Mn, AGR (%), CAGR (%))
Figure 30 Global Radome Market by Region, 2022-2032 (USD Mn, AGR (%), CAGR (%)): V-Shaped Recovery
Figure 31 Global Radome Market by Region, 2022-2032 (USD Mn, AGR (%), CAGR (%)): U-Shaped Recovery
Figure 32 Global Radome Market by Region, 2022-2032 (USD Mn, AGR (%), CAGR (%)): W-Shaped Recovery
Figure 33 Global Radome Market by Region, 2022-2032 (USD Mn, AGR (%), CAGR (%)): L-Shaped Recovery
Figure 34 North America Radome Market Attractiveness Index
Figure 35 North America Radome Market by Country, 2022, 2027 & 2032 (USD Million)
Figure 36 North America Radome Market Forecast by Country, 2022-2032 (USD Million, AGR %)
Figure 37 North America Radome Market Share Forecast by Country, 2022 & 2032 (%)
Figure 38 North America Radome Market Forecast by Material, 2022-2032 (USD Million, AGR %)
Figure 39 North America Radome Market Share Forecast by Material, 2022 & 2032 (%)
Figure 40 North America Radome Market Forecast by Application, 2022-2032 (USD Million, AGR %)
Figure 41 North America Radome Market Share Forecast by Application, 2022 & 2032 (%)
Figure 42 U.S. Radome Market Forecast, 2022-2032 (USD Million, AGR %)
Figure 43 Canada Radome Market Forecast, 2022-2032 (USD Million, AGR %)
Figure 44 Europe Radome Market Attractiveness Index
Figure 45 Europe Radome Market by Country, 2022, 2027 & 2032 (USD Million)
Figure 46 Europe Radome Market Forecast by Country, 2022-2032 (USD Million, AGR %)
Figure 47 Europe Radome Market Share Forecast by Country, 2022 & 2032 (%)
Figure 48 Europe Radome Market Forecast by Material, 2022-2032 (USD Million, AGR %)
Figure 49 Europe Radome Market Share Forecast by Material, 2022 & 2032 (%)
Figure 50 Europe Radome Market Forecast by Application, 2022-2032 (USD Million, AGR %)
Figure 51 Europe Radome Market Share Forecast by Application, 2022 & 2032 (%)
Figure 52 Germany Radome Market Forecast, 2022-2032 (USD Million, AGR %)
Figure 53 UK Radome Market Forecast, 2022-2032 (USD Million, AGR %)
Figure 54 France Radome Market Forecast, 2022-2032 (USD Million, AGR %)
Figure 55 Italy Radome Market Forecast, 2022-2032 (USD Million, AGR %)
Figure 56 Spain Radome Market Forecast, 2022-2032 (USD Million, AGR %)
Figure 57 Russia Radome Market Forecast, 2022-2032 (USD Million, AGR %)
Figure 58 Rest of Europe Radome Market Forecast, 2022-2032 (USD Million, AGR %)
Figure 59 Asia Pacific Radome Market Attractiveness Index
Figure 60 Asia Pacific Radome Market by Country, 2022, 2027 & 2032 (USD Million)
Figure 61 Asia Pacific Radome Market Forecast by Country, 2022-2032 (USD Million, AGR %)
Figure 62 Asia Pacific Radome Market Share Forecast by Country, 2022 & 2032 (%)
Figure 63 Asia Pacific Radome Market Forecast by Material, 2022-2032 (USD Million, AGR %)
Figure 64 Asia Pacific Radome Market Share Forecast by Material, 2022 & 2032 (%)
Figure 65 Asia Pacific Radome Market Forecast by Application, 2022-2032 (USD Million, AGR %)
Figure 66 Asia Pacific Radome Market Share Forecast by Application, 2022 & 2032 (%)
Figure 67 China Radome Market Forecast, 2022-2032 (USD Million, AGR %)
Figure 68 Japan Radome Market Forecast, 2022-2032 (USD Million, AGR %)
Figure 69 India Radome Market Forecast, 2022-2032 (USD Million, AGR %)
Figure 70 Australia Radome Market Forecast, 2022-2032 (USD Million, AGR %)
Figure 71 South Korea Radome Market Forecast, 2022-2032 (USD Million, AGR %)
Figure 72 Southeast Asia Radome Market Forecast, 2022-2032 (USD Million, AGR %)
Figure 73 Rest of Asia Pacific Radome Market Forecast, 2022-2032 (USD Million, AGR %)
Figure 74 Latin America Radome Market Attractiveness Index
Figure 75 Latin America Radome Market by Country, 2022, 2027 & 2032 (USD Million)
Figure 76 Latin America Radome Market Forecast by Country, 2022-2032 (USD Million, AGR %)
Figure 77 Latin America Radome Market Share Forecast by Country, 2022 & 2032 (%)
Figure 78 Latin America Radome Market Forecast by Material, 2022-2032 (USD Million, AGR %)
Figure 79 Latin America Radome Market Share Forecast by Material, 2022 & 2032 (%)
Figure 80 Latin America Radome Market Forecast by Application, 2022-2032 (USD Million, AGR %)
Figure 81 Latin America Radome Market Share Forecast by Application, 2022 & 2032 (%)
Figure 82 Brazil Radome Market Forecast, 2022-2032 (USD Million, AGR %)
Figure 83 Argentina Radome Market Forecast, 2022-2032 (USD Million, AGR %)
Figure 84 Mexico Radome Market Forecast, 2022-2032 (USD Million, AGR %)
Figure 85 Rest of Latin America Radome Market Forecast, 2022-2032 (USD Million, AGR %)
Figure 86 Middle East & Africa Radome Market Attractiveness Index
Figure 87 Middle East & Africa Radome Market by Country, 2022, 2027 & 2032 (USD Million)
Figure 88 Middle East & Africa Radome Market Forecast by Country, 2022-2032 (USD Million, AGR %)
Figure 89 Middle East & Africa Radome Market Share Forecast by Country, 2022 & 2032 (%)
Figure 90 Middle East & Africa Radome Market Forecast by Material, 2022-2032 (USD Million, AGR %)
Figure 91 Middle East & Africa Radome Market Share Forecast by Material, 2022 & 2032 (%)
Figure 92 Middle East & Africa Radome Market Forecast by Application, 2022-2032 (USD Million, AGR %)
Figure 93 Middle East & Africa Radome Market Share Forecast by Application, 2022 & 2032 (%)
Figure 94 GCC Radome Market Forecast, 2022-2032 (USD Million, AGR %)
Figure 95 South Africa Radome Market Forecast, 2022-2032 (USD Million, AGR %)
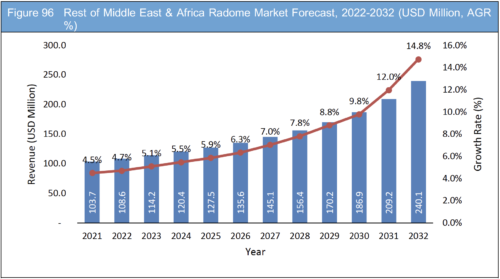
Figure 96 Rest of Middle East & Africa Radome Market Forecast, 2022-2032 (USD Million, AGR %)
Figure 97 BAE Systems: Net Revenue, 2017-2021 (US$ million, AGR%)
Figure 98 BAE Systems: Segment Market Shares, 2021
Figure 99 BAE Systems: Regional Market Shares, 2021
Figure 100 BAE Systems: Gross Profit, 2017-2021 (US$ million, AGR%)
Figure 101 BAE Systems: Operating Income, 2017-2021 (US$ million, AGR%)
Figure 102 General Dynamics Corporation: Net Revenue, 2017-2021 (US$ million, AGR%)
Figure 103 General Dynamics Corporation: Segment Market Shares, 2021
Figure 104 General Dynamics Corporation: Regional Market Shares, 2021
Figure 105 General Dynamics Corporation: Gross Profit, 2017-2021 (US$ million, AGR%)
Figure 106 General Dynamics Corporation: Operating Income, 2017-2021 (US$ million, AGR%)
Figure 107 Lockheed Martin: Net Revenue, 2017-2021 (US$ million, AGR%)
Figure 108 Lockheed Martin: Segment Market Shares, 2021
Figure 109 Lockheed Martin: Regional Market Shares, 2021
Figure 110 Lockheed Martin: Gross Profit, 2017-2021 (US$ million, AGR%)
Figure 111 Lockheed Martin: Operating Income, 2017-2021 (US$ million, AGR%)
Figure 112 Meggitt PLC: Net Revenue, 2017-2021 (US$ million, AGR%)
Figure 113 Meggitt PLC: Segment Market Shares, 2021
Figure 114 Meggitt PLC: Regional Market Shares, 2021
Figure 115 Meggitt PLC: Gross Profit, 2017-2021 (US$ million, AGR%)
Figure 116 Meggitt PLC: Operating Income, 2017-2021 (US$ million, AGR%)
Figure 117 Northrop Grumman Corp.: Net Revenue, 2017-2021 (US$ million, AGR%)
Figure 118 Northrop Grumman Corp.: Segment Market Shares, 2021
Figure 119 Northrop Grumman Corp.: Contract Type Market Shares, 2021
Figure 120 Northrop Grumman Corp.: Regional Market Shares, 2021
Figure 121 Northrop Grumman Corp.: Gross Profit, 2017-2021 (US$ million, AGR%)
Figure 122 Northrop Grumman Corp.: Operating Income, 2017-2021 (US$ million, AGR%)
Figure 123 Astronics Corporation: Net Revenue, 2017-2021 (US$ million, AGR%)
Figure 124 Astronics Corporation: Segment Market Shares, 2021
Figure 125 Astronics Corporation: Product Market Shares, 2021
Figure 126 Astronics Corporation: Regional Market Shares, 2021
Figure 127 Astronics Corporation: Gross Profit, 2017-2021 (US$ million, AGR%)
Figure 128 Astronics Corporation: Operating Income, 2017-2021 (US$ million, AGR%)
Figure 129 Comtech Telecommunications: Net Revenue, 2017-2021 (US$ million, AGR%)
Figure 130 Comtech Telecommunications: Regional Market Shares, 2021
Figure 131 Comtech Telecommunications: Gross Profit, 2017-2021 (US$ million, AGR%)
Figure 132 Comtech Telecommunications: Operating Income, 2017-2021 (US$ million, AGR%)
Figure 133 Lufthansa Technik: Net Revenue, 2017-2021 (US$ million, AGR%)
Figure 134 Lufthansa Technik: EBIT, 2017-2021 (US$ million, AGR%)
Figure 135 Boeing: Net Revenue, 2017-2021 (US$ million, AGR%)
Figure 136 Boeing: Segment Market Shares, 2021
Figure 137 Boeing: Gross Profit, 2016-2020 (US$ million, AGR%)
ページTOPに戻る
Summary
この調査レポートは世界のレドーム市場を調査し、素材別、用途別、、地域別に2022年から2032年までの予測結果を掲載しています。また関連企業情報を提供しています。
主な掲載内容(目次より抜粋)
-
レポート概要
-
エグゼクティブサマリー
-
プレミアムインサイト
-
市場概要
-
世界のレドーム市場分析:素材別
-
世界のレドーム市場分析:用途別
-
世界のレドーム市場分析:地域別
-
北米のレドーム市場分析
-
欧州のレドーム市場分析
-
アジア太平洋地域のレドーム市場分析
-
ラテンアメリカのレドーム市場分析
-
中東・アフリカのレドーム市場分析
-
競争状況
-
主要企業のプロフィール
Report Details
The Radome Market Report 2022-2032: This report will prove invaluable to leading firms striving for new revenue pockets if they wish to better understand the industry and its underlying dynamics. It will be useful for companies that would like to expand into different industries or to expand their existing operations in a new region.
Increasing Radome Demand for Unmanned aerial vehicles (UAVs)
Unmanned aerial vehicles (UAVs), sometimes known as drones, have long been a common sight in military applications, particularly surveillance, and the spectrum of defence uses continues to expand as technology advances. Drone development is continuing to accelerate, owing to geopolitical considerations such as China’s ascent. In its ongoing quest to impose itself as a regional hegemon, the development of drone technology is critical. The government category, which includes military and law enforcement organizations, was the primary demand driver for drones in 2020, accounting for more than 70% of the worldwide market.
The increased demand for military drones has been a key growth driver for the worldwide radome business. Military drones are equipped with a variety of equipment, including a navigation system, airframe, contact connection, autopilot, engine, and sensor package. In addition, as military and national security threats develop, the complexity and capabilities of military airborne intelligence, surveillance, and reconnaissance (ISR) technology must grow to meet the demands. The number of channels and data types used in intelligence, surveillance, and reconnaissance (ISR) is increasing, necessitating more data processing, storage, security, and delivery. These factors are expected to open new avenues for radome market concentration over the forecast period.
What Questions Should You Ask before Buying a Market Research Report?
• How is the radome market evolving?
• What is driving and restraining the radome market?
• How will each radome submarket segment grow over the forecast period and how much revenue will these submarkets account for in 2032?
• How will the market shares for each radome submarket develops from 2022 to 2032?
• What will be the main driver for the overall market from 2022 to 2032?
• Will leading radome markets broadly follow the macroeconomic dynamics, or will individual national markets outperform others?
• How will the market shares of the national markets change by 2032 and which geographical region will lead the market in 2032?
• Who are the leading players and what are their prospects over the forecast period?
• What are the radome projects for these leading companies?
• How will the industry evolve during the period between 2020 and 2032? What are the implications of radome projects taking place now and over the next 10 years?
• Is there a greater need for product commercialisation to further scale the radome market?
• Where is the radome market heading and how can you ensure you are at the forefront of the market?
You need to discover how this will impact the radome market today, and over the next 10 years:
• Our 247-page report provides 102 tables and 137 charts/graphs exclusively to you.
• The report highlights key lucrative areas in the industry so you can target them – NOW.
• It contains in-depth analysis of global, regional and national sales and growth.
• It highlights for you the key successful trends, changes and revenue projections made by your competitors.
This report tells you TODAY how the radome market will develop in the next 10 years, and in line with the variations in COVID-19 economic recession and bounce. This market is more critical now than at any point over the last 10 years.
The report delivers exclusive COVID-19 variations and economic data specific to your market.
Forecasts to 2032 and other analyses reveal commercial prospects
• In addition to revenue forecasting to 2032, our new study provides you with recent results, growth rates, and market shares.
• You will find original analyses, with business outlooks and developments.
• Discover qualitative analyses (including market dynamics, drivers, opportunities, restraints and challenges), supply chain analysis, and recent developments.
This report includes data analysis and invaluable insight into how COVID-19 will affect the industry and your company. Four COVID-19 recovery patterns and their impact, namely, “V”, “L”, “W” and “U” are discussed in this report.
Segments Covered in the Report
Material Outlook
• Glass-Fibre
• PVC
• PE
• PTFE
• Quartz
• Others
• Downstream Process
Application
• Ground
– Radio Antennas
– Airborne Traffic Control (ATC)
– Others
• Airborne
– Military Aircraft
– Commercial & Business Aircraft
• Shipboard
– Military Shipboard
– Commercial Shipboard
In addition to the revenue predictions for the overall world market and segments, you will also find revenue forecasts for five regional and 18 leading national markets:
North America
• U.S.
• Canada
Europe
• Germany
• Spain
• United Kingdom
• Russia
• France
• Italy
• Rest of Europe
Asia Pacific
• China
• Japan
• India
• Australia
• South Korea
• Rest of Asia Pacific
Latin America
• Brazil
• Mexico
• Argentina
• Rest of Latin America
Middle East & Africa
• GCC
• South Africa
The report also includes profiles and for some of the leading companies in the Radome Market, 2022 to 2032, with a focus on this segment of these companies’ operations.
Leading companies and the potential for market growth
• Astronics Corporation
• BAE Systems
• Boeing
• Comtech Telecommunications
• CPI International
• Flir Systems
• General Dynamics Corporation
• Kitsap Composites
• Lockheed Martin
• Lufthansa Technik
• Meggitt PLC
• NORDAM Group, Inc.
• Northrop Grumman Corp.
• Saint-Gobain Performance Plastics
• Starwin Industries
Overall world revenue for Radome Market, 2022 to 2032 in terms of value the market will surpass US$1.70 billion in 2022, our work calculates. We predict strong revenue growth through to 2032. Our work identifies which organisations hold the greatest potential. Discover their capabilities, progress, and commercial prospects, helping you stay ahead.
How will the Radome Market, 2022 to 2032 Market report help you?
In summary, our 240+ page report provides you with the following knowledge:
• Revenue forecasts to 2032 for Radome Market, 2022 to 2032 Market, with forecasts for material, application, and each forecast at a global and regional level – discover the industry’s prospects, finding the most lucrative places for investments and revenues.
• Revenue forecasts to 2032 for five regional and 18 key national markets – See forecasts for the Radome Market, 2022 to 2032 market in North America, Europe, Asia-Pacific, Latin America, and Middle East & Africa. Also market size estimation and forecast is provided for US, Canada, Mexico, Brazil, Germany, France, UK, Italy, Spain, Russia, China, India, Japan, and Australia among other prominent economies.
• Prospects for established firms and those seeking to enter the market – including company profiles for 15 of the major companies involved in the Radome Market, 2022 to 2032.
Find quantitative and qualitative analyses with independent predictions. Receive information that only our report contains, staying informed with invaluable business intelligence.
Information found nowhere else
With our new report, you are less likely to fall behind in knowledge or miss out on opportunities. See how our work could benefit your research, analyses, and decisions. Visiongain’s study is for everybody needing commercial analyses for the Radome Market, 2022 to 2032, market-leading companies. You will find data, trends and predictions.
ページTOPに戻る
Table of Contents
Table of Contents
1. Report Overview
1.1 Objectives of the Study
1.2 Introduction to Radome Market
1.3 What this Report Delivers?
1.4 Why You Should Read this Report?
1.5 Key Questions Answered by this Analytical Report
1.6 Who is This Report For?
1.7 Methodology
1.7.1 Market Definitions
1.7.2 Market Evaluation & Forecasting Methodology
1.7.3 Data Validation
1.8 Frequently Asked Questions (FAQs)
1.9 Associated Visiongain Reports
1.10 About Visiongain
2 Executive Summary
3 Premium Insights
3.1 Geographical Snapshot: Global Radome Market
3.2 Material Segment: Market Attractiveness Index
3.3 Application Segment: Market Attractiveness Index
4 Market Overview
4.1 Market Dynamics
4.1.1 Market Driving Factors
4.1.2 Market Restraining Factors
4.1.3 Market Opportunities
4.2 COVID-19 Impact Analysis
4.3 Porter’s Five Forces Analysis
4.3.1 Supplier Power
4.3.2 Buyer Power
4.3.3 Competitive Rivalry
4.3.4 Threat from Substitutes
4.3.5 Threat of New Entrants
4.4 PEST Analysis
4.5 Supply Chain Analysis
4.5.1 Radome Material
4.5.2 Material Suppliers
4.5.3 Manufacturers and End Users
5 Global Radome Market Analysis by Material
5.1 Key Findings
5.2 Material Segment Growth Prospects
5.3 Global Radome Market Share by Material, 2022 & 2032
5.4 Glass-Fiber
5.4.1 Advantages of Fiberglass Radome
5.4.2 Glass-Fiber Market Forecast by Region, 2022-2032 (USD Million)
5.5 Polyvinyl Chloride (PVC)
5.5.1 PVC Market Forecast by Region, 2022-2032 (USD Million)
5.6 Polyurethanes (PE)
5.6.1 Polyurethane Foams in Radomes
5.6.2 PE Market Forecast by Region, 2022-2032 (USD Million)
5.7 Polytetrafluoroethylene (PTFE)
5.7.1 Teflon: Effective Materials Available for Radome Construction
5.7.2 PTFE Market Forecast by Region, 2022-2032 (USD Million)
5.8 Quartz
5.8.1 Quartz Fiber in Aerospace Radomes
5.8.2 Quartz Market Forecast by Region, 2022-2032 (USD Million)
5.9 Other Materials
5.9.1 Other Materials Market Forecast by Region, 2022-2032 (USD Million)
6 Global Radome Market Analysis by Application
6.1 Key Findings
6.2 Application Segment Growth Prospects
6.3 Global Radome Market Share by Application, 2022 & 2032
6.4 Ground Application
6.4.1 Sheergard (Saint-Gobain) Sandwich Radomes
6.4.2 Radome Market for Ground Application by Region, 2022-2032 (USD Million)
6.4.3 Radome Market for Ground Application by Type, 2022-2032 (USD Million)
6.5 Airborne Application
6.5.1 Radome Market for Airborne Application by Region, 2022-2032 (USD Million)
6.5.2 Radome Market for Airborne Application by Type, 2022-2032 (USD Million)
6.6 Shipboard Application
6.6.1 Radome Market for Shipboard Application by Region, 2022-2032 (USD Million)
6.6.2 Radome Market for Shipboard Application by Type, 2022-2032 (USD Million)
7 Global Radome Market Analysis by Region
7.1 Key Findings
7.2 Regional Market Size Estimation and Forecast
7.3 COVID-19 Impact Analysis: Recovery Scenarios (V, U, W, L)
8 North America Radome Market Analysis
8.1 Key Findings
8.2 North America Radome Market Attractiveness Index
8.3 North America Radome Market by Country, 2022, 2027 & 2032 (USD Million)
8.4 North America Radome Market Size Estimation and Forecast by Country
8.5 North America Radome Market Size Estimation and Forecast by Material
8.6 North America Radome Market Size Estimation and Forecast by Application
8.7 U.S. Radome Market
8.8 Canada Radome Market
9 Europe Radome Market Analysis
9.1 Key Findings
9.2 Europe Radome Market Attractiveness Index
9.3 Europe Radome Market by Country, 2022, 2027 & 2032 (USD Million)
9.4 Europe Radome Market Size Estimation and Forecast by Country
9.5 Europe Radome Market Size Estimation and Forecast by Material
9.6 Europe Radome Market Size Estimation and Forecast by Application
9.7 Germany Radome Market
9.7.1 Vincorion Supplies Radomes for the “Quadriga” Eurofighter
9.8 UK Radome Market
9.9 France Radome Market
9.9.1 France selected Indra’s radar system for three air bases
9.10 Italy Radome Market
9.11 Spain Radome Market
9.12 Russia Radome Market
9.13 Rest of Europe Radome Market
10 Asia Pacific Radome Market Analysis
10.1 Key Findings
10.2 Asia Pacific Radome Market Attractiveness Index
10.3 Asia Pacific Radome Market by Country, 2022, 2027 & 2032 (USD Million)
10.4 Asia Pacific Radome Market Size Estimation and Forecast by Country
10.5 Asia Pacific Radome Market Size Estimation and Forecast by Material
10.6 Asia Pacific Radome Market Size Estimation and Forecast by Application
10.7 China Radome Market
10.7.1 The Chinese Army is installing and upgrading its radars along the India-China border
10.7.2 Saint-Gobain completed first radome project in China
10.8 Japan Radome Market
10.8.1 Synspective Inc. and Seiren Co., Ltd signed a memorandum of understanding
10.9 India Radome Market
10.9.1 Testing of a new radome for the LCA-Tejas fleet
10.10 Australia Radome Market
10.11 South Korea Radome Market
10.12 Southeast Asia Radome Market
10.12.1 Leonardo provided radar system to Indonesian Air Force
10.12.2 Radomes in Malaysia
10.13 Rest of Asia Pacific Radome Market
10.13.1 Taiwan's Upgraded Radar to Monitor Chinese Aircraft
10.13.2 Pakistan is Strengthening its Radar System
11 Latin America Radome Market Analysis
11.1 Key Findings
11.2 Latin America Radome Market Attractiveness Index
11.3 Latin America Radome Market by Country, 2022, 2027 & 2032 (USD Million)
11.4 Latin America Radome Market Size Estimation and Forecast by Country
11.5 Latin America Radome Market Size Estimation and Forecast by Material
11.6 Latin America Radome Market Size Estimation and Forecast by Application
11.7 Brazil Radome Market
11.8 Argentina Radome Market
11.9 Mexico Radome Market
11.10 Rest of Latin America Radome Market
11.10.1 Thales to Deploy Solar-Powered Air Traffic Control Radar Station in Chile
11.10.2 Columbia Aerospace Industry
12 Middle East & Africa Radome Market Analysis
12.1 Key Findings
12.2 Middle East & Africa Radome Market Attractiveness Index
12.3 Middle East & Africa Radome Market by Country, 2022, 2027 & 2032 (USD Million)
12.4 Middle East & Africa Radome Market Size Estimation and Forecast by Country
12.5 Middle East & Africa Radome Market Size Estimation and Forecast by Material
12.6 Middle East & Africa Radome Market Size Estimation and Forecast by Application
12.7 GCC Radome Market
12.7.1 Indra deployed ATC centres in Saudi Arabia
12.8 South Africa Radome Market
12.8.1 Hensoldt SA launched new naval surveillance radar
12.9 Rest of Middle East & Africa Radome Market
13 Competitive Landscape
13.1 Company Share Analysis
13.2 Key Business Strategy Analysis
14 Company Profiles
14.1 BAE Systems
14.1.1 Company Snapshot
14.1.2 Company Overview
14.1.3 Company’s Capabilities
14.1.4 Financial Analysis
14.1.5 Product Benchmarking
14.1.6 Strategic Outlook
14.2 General Dynamics Corporation
14.2.1 Company Snapshot
14.2.2 Company Overview
14.2.3 Military Aircraft Radomes
14.2.4 Key Capabilities
14.2.5 Radome Qualification Experience:
14.2.6 Financial Analysis
14.2.7 Product Benchmarking
14.2.8 Strategic Outlook
14.3 Lockheed Martin
14.3.1 Company Snapshot
14.3.2 Company Overview
14.3.3 Aeronautics
14.3.4 Missiles and Fire Control
14.3.5 Rotary and Mission Systems
14.3.6 Space Systems
14.3.7 Financial Analysis
14.3.8 Product Benchmarking
14.3.9 Strategic Outlook
14.4 Kitsap Composites
14.4.1 Company Snapshot
14.4.2 Company Overview
14.4.3 Product Benchmarking
14.5 Meggitt PLC
14.5.1 Company Snapshot
14.5.2 Company Overview
14.5.3 Civil & Military Radomes
14.5.4 Radome Customers
14.5.5 Financial Analysis
14.5.6 Product Benchmarking
14.5.7 Strategic Outlook
14.6 NORDAM Group, Inc.
14.6.1 Company Snapshot
14.6.2 Company Overview
14.6.3 Product Benchmarking
14.6.4 Strategic Outlook
14.7 Northrop Grumman Corp.
14.7.1 Company Snapshot
14.7.2 Company Overview
14.7.3 Air EO/IR
14.7.4 Land EO/IR
14.7.5 Maritime EO/IR
14.7.6 Financial Analysis
14.7.7 Product Benchmarking
14.7.8 Strategic Outlook
14.8 Saint-Gobain Performance Plastics
14.8.1 Company Snapshot
14.8.2 Company Overview
14.8.3 Product Benchmarking
14.8.4 Strategic Outlook
14.9 Starwin Industries
14.9.1 Company Snapshot
14.9.2 Company Overview
14.9.3 Radomes
14.9.4 Radomes for Military Aircraft & Naval Systems
14.9.5 Product Benchmarking
14.9.6 Strategic Outlook
14.10 CPI International Inc.
14.10.1 Company Snapshot
14.10.2 Company Overview
14.10.3 Business Units
14.10.4 Product Benchmarking
14.10.5 Strategic Outlook
14.11 Astronics Corporation
14.11.1 Company Snapshot
14.11.2 Company Overview
14.11.3 Company’s Product Portfolio and Solutions
14.11.4 Subsidiaries
14.11.5 Financial Analysis
14.11.6 Product Benchmarking
14.11.7 Strategic Outlook
14.12 Comtech Telecommunications
14.12.1 Company Snapshot
14.12.2 Company Overview
14.12.3 Financial Analysis
14.12.4 Product Benchmarking
14.12.5 Strategic Outlook
14.13 Lufthansa Technik
14.13.1 Company Snapshot
14.13.2 Company Overview
14.13.3 Building professional OEM structures
14.13.4 Financial Analysis
14.13.5 Product Benchmarking
14.13.6 Strategic Outlook
14.14 Flir Systems
14.14.1 Company Snapshot
14.14.2 Company Overview
14.14.3 Product Benchmarking
14.14.4 Strategic Outlook
14.15 Boeing
14.15.1 Company Snapshot
14.15.2 Company Overview
14.15.3 Commercial Airplanes Segment
14.15.4 Defence, Space & Security Segment
14.15.5 Global Services Segment
14.15.6 Boeing Capital Segment
14.15.7 Boeing INEXA Solutions
14.15.8 Financial Analysis
14.15.9 Product Benchmarking
14.15.10 Strategic Outlook
15 Conclusion and Recommendations
15.1 Concluding Remarks from Visiongain
15.2 Recommendations for Market Players
15.2.1 Expansion in developing economies
15.2.2 Necessity of technology upgradation in radome structure
15.2.3 Environmental and signal challenges
Glossary
List of Tables
Table 1 Global Radome Market Snapshot, 2022 & 2032 (USD Million, CAGR %)
Table 2 Global Radome Market Size by Glass-Fiber Material, 2022-2032 (USD Million, AGR %, CAGR %)
Table 3 Global Radome Market Size by PVC Material, 2022-2032 (USD Million, AGR %, CAGR %)
Table 4 Global Radome Market Size by PE Material, 2022-2032 (USD Million, AGR %, CAGR %)
Table 5 Global Radome Market Size by PTFE Material, 2022-2032 (USD Million, AGR %, CAGR %)
Table 6 Global Radome Market Size by Quartz Material, 2022-2032 (USD Million, AGR %, CAGR %)
Table 7 Global Radome Market Size by Other Materials Material, 2022-2032 (USD Million, AGR %, CAGR %)
Table 8 Global Radome Market Size by Ground Application, 2022-2032 (USD Million, AGR %, CAGR %)
Table 9 Global Radome Market Size for Ground Application by Type, 2022-2032 (USD Million, AGR %, CAGR %)
Table 10 Global Radome Market Size by Airborne Application, 2022-2032 (USD Million, AGR %, CAGR %)
Table 11 Global Radome Market Size for Airborne Application by Type, 2022-2032 (USD Million, AGR %, CAGR %)
Table 12 Global Radome Market Size by Shipboard Application, 2022-2032 (USD Million, AGR %, CAGR %)
Table 13 Global Radome Market Size for Shipboard Application by Type, 2022-2032 (USD Million, AGR %, CAGR %)
Table 14 Global Radome Market Size for Region, 2022-2032 (USD Million, AGR %, CAGR %)
Table 15 Global Radome Market Size for Region, 2022-2032 (USD Million, AGR %, CAGR %): V-Shaped Recovery
Table 16 Global Radome Market Size for Region, 2022-2032 (USD Million, AGR %, CAGR %): U-Shaped Recovery
Table 17 Global Radome Market Size for Region, 2022-2032 (USD Million, AGR %, CAGR %): W-Shaped Recovery
Table 18 Global Radome Market Size for Region, 2022-2032 (USD Million, AGR %, CAGR %): L-Shaped Recovery
Table 19 North America Radome Market Forecast by Country, 2022-2032 (USD Million, AGR%, CAGR%)
Table 20 North America Radome Market Forecast by Material, 2022-2032 (USD Million, AGR%, CAGR%)
Table 21 North America Radome Market Forecast by Application, 2022-2032 (USD Million, AGR%, CAGR%)
Table 22 U.S. Radome Market Forecast, 2022-2032 (USD Million, AGR%, CAGR%)
Table 23 Canada Radome Market Forecast, 2022-2032 (USD Million, AGR%, CAGR%)
Table 24 Europe Radome Market Forecast by Country, 2022-2032 (USD Million, AGR%, CAGR%)
Table 25 Europe Radome Market Forecast by Material, 2022-2032 (USD Million, AGR%, CAGR%)
Table 26 Europe Radome Market Forecast by Application, 2022-2032 (USD Million, AGR%, CAGR%)
Table 27 Germany Radome Market Forecast, 2022-2032 (USD Million, AGR%, CAGR%)
Table 28 UK Radome Market Forecast, 2022-2032 (USD Million, AGR%, CAGR%)
Table 29 France Radome Market Forecast, 2022-2032 (USD Million, AGR%, CAGR%)
Table 30 Italy Radome Market Forecast, 2022-2032 (USD Million, AGR%, CAGR%)
Table 31 Spain Radome Market Forecast, 2022-2032 (USD Million, AGR%, CAGR%)
Table 32 Russia Radome Market Forecast, 2022-2032 (USD Million, AGR%, CAGR%)
Table 33 Rest of Europe Radome Market Forecast, 2022-2032 (USD Million, AGR%, CAGR%)
Table 34 Asia Pacific Radome Market Forecast by Country, 2022-2032 (USD Million, AGR%, CAGR%)
Table 35 Asia Pacific Radome Market Forecast by Material, 2022-2032 (USD Million, AGR%, CAGR%)
Table 36 Asia Pacific Radome Market Forecast by Application, 2022-2032 (USD Million, AGR%, CAGR%)
Table 37 China Radome Market Forecast, 2022-2032 (USD Million, AGR%, CAGR%)
Table 38 Japan Radome Market Forecast, 2022-2032 (USD Million, AGR%, CAGR%)
Table 39 India Radome Market Forecast, 2022-2032 (USD Million, AGR%, CAGR%)
Table 40 Australia Radome Market Forecast, 2022-2032 (USD Million, AGR%, CAGR%)
Table 41 South Korea Radome Market Forecast, 2022-2032 (USD Million, AGR%, CAGR%)
Table 42 Southeast Asia Radome Market Forecast, 2022-2032 (USD Million, AGR%, CAGR%)
Table 43 Rest of Asia Pacific Radome Market Forecast, 2022-2032 (USD Million, AGR%, CAGR%)
Table 44 Latin America Radome Market Forecast by Country, 2022-2032 (USD Million, AGR%, CAGR%)
Table 45 Latin America Radome Market Forecast by Material, 2022-2032 (USD Million, AGR%, CAGR%)
Table 46 Latin America Radome Market Forecast by Application, 2022-2032 (USD Million, AGR%, CAGR%)
Table 47 Brazil Radome Market Forecast, 2022-2032 (USD Million, AGR%, CAGR%)
Table 48 Argentina Radome Market Forecast, 2022-2032 (USD Million, AGR%, CAGR%)
Table 49 Mexico Radome Market Forecast, 2022-2032 (USD Million, AGR%, CAGR%)
Table 50 Rest of Latin America Radome Market Forecast, 2022-2032 (USD Million, AGR%, CAGR%)
Table 51 Middle East & Africa Radome Market Forecast by Country, 2022-2032 (USD Million, AGR%, CAGR%)
Table 52 Middle East & Africa Radome Market Forecast by Material, 2022-2032 (USD Million, AGR%, CAGR%)
Table 53 Middle East & Africa Radome Market Forecast by Application, 2022-2032 (USD Million, AGR%, CAGR%)
Table 54 GCC Radome Market Forecast, 2022-2032 (USD Million, AGR%, CAGR%)
Table 55 South Africa Radome Market Forecast, 2022-2032 (USD Million, AGR%, CAGR%)
Table 56 Rest of Middle East & Africa Radome Market Forecast, 2022-2032 (USD Million, AGR%, CAGR%)
Table 57 Company Ranking Analysis
Table 58 Key Business Strategies Adopted by Key Players in Global Radome Market
Table 59 BAE Systems: Key Details, (CEO, HQ, Revenue, Founded, No. of Employees, Company Type, Website, Business Segment)
Table 60 BAE Systems: Product Benchmarking
Table 61 BAE Systems: Strategic Outlook
Table 62 General Dynamics Corporation: Key Details, (CEO, HQ, Revenue, Founded, No. of Employees, Company Type, Website, Business Segment)
Table 63 General Dynamics Corporation: Product Benchmarking
Table 64 General Dynamics Corporation: Strategic Outlook
Table 65 Lockheed Martin: Key Details, (CEO, HQ, Revenue, Founded, No. of Employees, Company Type, Website, Business Segment)
Table 66 Lockheed Martin: Product Benchmarking
Table 67 Lockheed Martin: Strategic Outlook
Table 68 Kitsap Composites: Key Details, (CEO, HQ, Revenue, Founded, No. of Employees, Company Type, Website, Business Segment)
Table 69 Kitsap Composites: Product Benchmarking
Table 70 Meggitt PLC: Key Details, (CEO, HQ, Revenue, Founded, No. of Employees, Company Type, Website, Business Segment)
Table 71 Meggitt PLC: Product Benchmarking
Table 72 Meggitt PLC: Strategic Outlook
Table 73 NORDAM Group, Inc.: Key Details, (CEO, HQ, Revenue, Founded, No. of Employees, Company Type, Website, Business Segment)
Table 74 NORDAM Group, Inc.: Product Benchmarking
Table 75 NORDAM Group, Inc.: Strategic Outlook
Table 76 Northrop Grumman Corp.: Key Details, (CEO, HQ, Revenue, Founded, No. of Employees, Company Type, Website, Business Segment)
Table 77 Northrop Grumman Corp.: Product Benchmarking
Table 78 Northrop Grumman Corp.: Strategic Outlook
Table 79 Saint-Gobain Performance Plastics: Key Details, (CEO, HQ, Revenue, Founded, No. of Employees, Company Type, Website, Business Segment)
Table 80 Saint-Gobain Performance Plastics: Product Benchmarking
Table 81 Saint-Gobain Performance Plastics: Strategic Outlook
Table 82 Starwin Industries: Key Details, (CEO, HQ, Revenue, Founded, No. of Employees, Company Type, Website, Business Segment)
Table 83 Starwin Industries: Product Benchmarking
Table 84 Starwin Industries: Strategic Outlook
Table 85 CPI International Inc.: Key Details, (CEO, HQ, Revenue, Founded, No. of Employees, Company Type, Website, Business Segment)
Table 86 CPI International Inc.: Product Benchmarking
Table 87 CPI International Inc.: Strategic Outlook
Table 88 Astronics Corporation: Key Details, (CEO, HQ, Revenue, Founded, No. of Employees, Company Type, Website, Business Segment)
Table 89 Astronics Corporation: Product Benchmarking
Table 90 Astronics Corporation: Strategic Outlook
Table 91 Comtech Telecommunications: Key Details, (CEO, HQ, Revenue, Founded, No. of Employees, Company Type, Website, Business Segment)
Table 92 Comtech Telecommunications: Product Benchmarking
Table 93 Comtech Telecommunications: Strategic Outlook
Table 94 Lufthansa Technik: Key Details, (CEO, HQ, Revenue, Founded, No. of Employees, Company Type, Website, Business Segment)
Table 95 Lufthansa Technik: Product Benchmarking
Table 96 Lufthansa Technik: Strategic Outlook
Table 97 Flir Systems: Key Details, (CEO, HQ, Revenue, Founded, No. of Employees, Company Type, Website, Business Segment)
Table 98 Flir Systems: Product Benchmarking
Table 99 Flir Systems: Strategic Outlook
Table 100 Boeing: Key Details, (CEO, HQ, Revenue, Founded, No. of Employees, Company Type, Website, Business Segment)
Table 101 Boeing: Product Benchmarking
Table 102 Boeing: Strategic Outlook
List of Figures
Figure 1 Global Radome Market Segmentation
Figure 2 Global Radome Market Forecast by Region: Market Attractiveness Index
Figure 3 Global Radome Market by Material: Market Attractiveness Index
Figure 4 Global Radome Market by Application: Market Attractiveness Index
Figure 5 Global Radome Market: Market Dynamics
Figure 6 Global Radome Market: Market Dynamics
Figure 7 Global COVID Impact Analysis: Radome Market Recovery Scenarios
Figure 8 Global Radome Market: Porter’s Five Forces Analysis
Figure 9 Global Radome Market: PEST Analysis
Figure 10 Radome Industry: Supply Chain Analysis
Figure 11 Global Radome Market Forecast by Material
Figure 12 Global Radome Market Share Forecast by Material, 2022, 2032 (%)
Figure 13 Glass-Fiber Radome Market Forecast, 2022-2032 (US$ Million)
Figure 14 PVC Radome Market Forecast, 2022-2032 (US$ Million)
Figure 15 PE Radome Market Forecast, 2022-2032 (US$ Million)
Figure 16 PTFE Radome Market Forecast, 2022-2032 (US$ Million)
Figure 17 Quartz Radome Market Forecast, 2022-2032 (US$ Million)
Figure 18 Other Materials Radome Market Forecast, 2022-2032 (US$ Million)
Figure 19 Global Radome Market Forecast by Application
Figure 20 Global Radome Market Share Forecast by Application, 2022, 2032 (%)
Figure 21 Radome Market Forecast for Ground Application, 2022-2032 (US$ Million)
Figure 22 Global Radome Market Size for Ground Application by Type, 2022-2032 (US$ Million)
Figure 23 Radome Market Forecast for Airborne Application, 2022-2032 (US$ Million)
Figure 24 Global Radome Market Size for Airborne Application by Type, 2022-2032 (US$ Million)
Figure 25 Radome Market Forecast for Shipboard Application, 2022-2032 (US$ Million)
Figure 26 Global Radome Market Size for Shipboard Application by Type, 2022-2032 (US$ Million)
Figure 27 Global Radome Market Forecast by Region 2022, 2027, 2032 (Revenue, CAGR%)
Figure 28 Global Radome Market Share Forecast by Region 2022, 2027, 2032(%)
Figure 29 Global Radome Market by Region, 2022-2032 (USD Mn, AGR (%), CAGR (%))
Figure 30 Global Radome Market by Region, 2022-2032 (USD Mn, AGR (%), CAGR (%)): V-Shaped Recovery
Figure 31 Global Radome Market by Region, 2022-2032 (USD Mn, AGR (%), CAGR (%)): U-Shaped Recovery
Figure 32 Global Radome Market by Region, 2022-2032 (USD Mn, AGR (%), CAGR (%)): W-Shaped Recovery
Figure 33 Global Radome Market by Region, 2022-2032 (USD Mn, AGR (%), CAGR (%)): L-Shaped Recovery
Figure 34 North America Radome Market Attractiveness Index
Figure 35 North America Radome Market by Country, 2022, 2027 & 2032 (USD Million)
Figure 36 North America Radome Market Forecast by Country, 2022-2032 (USD Million, AGR %)
Figure 37 North America Radome Market Share Forecast by Country, 2022 & 2032 (%)
Figure 38 North America Radome Market Forecast by Material, 2022-2032 (USD Million, AGR %)
Figure 39 North America Radome Market Share Forecast by Material, 2022 & 2032 (%)
Figure 40 North America Radome Market Forecast by Application, 2022-2032 (USD Million, AGR %)
Figure 41 North America Radome Market Share Forecast by Application, 2022 & 2032 (%)
Figure 42 U.S. Radome Market Forecast, 2022-2032 (USD Million, AGR %)
Figure 43 Canada Radome Market Forecast, 2022-2032 (USD Million, AGR %)
Figure 44 Europe Radome Market Attractiveness Index
Figure 45 Europe Radome Market by Country, 2022, 2027 & 2032 (USD Million)
Figure 46 Europe Radome Market Forecast by Country, 2022-2032 (USD Million, AGR %)
Figure 47 Europe Radome Market Share Forecast by Country, 2022 & 2032 (%)
Figure 48 Europe Radome Market Forecast by Material, 2022-2032 (USD Million, AGR %)
Figure 49 Europe Radome Market Share Forecast by Material, 2022 & 2032 (%)
Figure 50 Europe Radome Market Forecast by Application, 2022-2032 (USD Million, AGR %)
Figure 51 Europe Radome Market Share Forecast by Application, 2022 & 2032 (%)
Figure 52 Germany Radome Market Forecast, 2022-2032 (USD Million, AGR %)
Figure 53 UK Radome Market Forecast, 2022-2032 (USD Million, AGR %)
Figure 54 France Radome Market Forecast, 2022-2032 (USD Million, AGR %)
Figure 55 Italy Radome Market Forecast, 2022-2032 (USD Million, AGR %)
Figure 56 Spain Radome Market Forecast, 2022-2032 (USD Million, AGR %)
Figure 57 Russia Radome Market Forecast, 2022-2032 (USD Million, AGR %)
Figure 58 Rest of Europe Radome Market Forecast, 2022-2032 (USD Million, AGR %)
Figure 59 Asia Pacific Radome Market Attractiveness Index
Figure 60 Asia Pacific Radome Market by Country, 2022, 2027 & 2032 (USD Million)
Figure 61 Asia Pacific Radome Market Forecast by Country, 2022-2032 (USD Million, AGR %)
Figure 62 Asia Pacific Radome Market Share Forecast by Country, 2022 & 2032 (%)
Figure 63 Asia Pacific Radome Market Forecast by Material, 2022-2032 (USD Million, AGR %)
Figure 64 Asia Pacific Radome Market Share Forecast by Material, 2022 & 2032 (%)
Figure 65 Asia Pacific Radome Market Forecast by Application, 2022-2032 (USD Million, AGR %)
Figure 66 Asia Pacific Radome Market Share Forecast by Application, 2022 & 2032 (%)
Figure 67 China Radome Market Forecast, 2022-2032 (USD Million, AGR %)
Figure 68 Japan Radome Market Forecast, 2022-2032 (USD Million, AGR %)
Figure 69 India Radome Market Forecast, 2022-2032 (USD Million, AGR %)
Figure 70 Australia Radome Market Forecast, 2022-2032 (USD Million, AGR %)
Figure 71 South Korea Radome Market Forecast, 2022-2032 (USD Million, AGR %)
Figure 72 Southeast Asia Radome Market Forecast, 2022-2032 (USD Million, AGR %)
Figure 73 Rest of Asia Pacific Radome Market Forecast, 2022-2032 (USD Million, AGR %)
Figure 74 Latin America Radome Market Attractiveness Index
Figure 75 Latin America Radome Market by Country, 2022, 2027 & 2032 (USD Million)
Figure 76 Latin America Radome Market Forecast by Country, 2022-2032 (USD Million, AGR %)
Figure 77 Latin America Radome Market Share Forecast by Country, 2022 & 2032 (%)
Figure 78 Latin America Radome Market Forecast by Material, 2022-2032 (USD Million, AGR %)
Figure 79 Latin America Radome Market Share Forecast by Material, 2022 & 2032 (%)
Figure 80 Latin America Radome Market Forecast by Application, 2022-2032 (USD Million, AGR %)
Figure 81 Latin America Radome Market Share Forecast by Application, 2022 & 2032 (%)
Figure 82 Brazil Radome Market Forecast, 2022-2032 (USD Million, AGR %)
Figure 83 Argentina Radome Market Forecast, 2022-2032 (USD Million, AGR %)
Figure 84 Mexico Radome Market Forecast, 2022-2032 (USD Million, AGR %)
Figure 85 Rest of Latin America Radome Market Forecast, 2022-2032 (USD Million, AGR %)
Figure 86 Middle East & Africa Radome Market Attractiveness Index
Figure 87 Middle East & Africa Radome Market by Country, 2022, 2027 & 2032 (USD Million)
Figure 88 Middle East & Africa Radome Market Forecast by Country, 2022-2032 (USD Million, AGR %)
Figure 89 Middle East & Africa Radome Market Share Forecast by Country, 2022 & 2032 (%)
Figure 90 Middle East & Africa Radome Market Forecast by Material, 2022-2032 (USD Million, AGR %)
Figure 91 Middle East & Africa Radome Market Share Forecast by Material, 2022 & 2032 (%)
Figure 92 Middle East & Africa Radome Market Forecast by Application, 2022-2032 (USD Million, AGR %)
Figure 93 Middle East & Africa Radome Market Share Forecast by Application, 2022 & 2032 (%)
Figure 94 GCC Radome Market Forecast, 2022-2032 (USD Million, AGR %)
Figure 95 South Africa Radome Market Forecast, 2022-2032 (USD Million, AGR %)
Figure 96 Rest of Middle East & Africa Radome Market Forecast, 2022-2032 (USD Million, AGR %)
Figure 97 BAE Systems: Net Revenue, 2017-2021 (US$ million, AGR%)
Figure 98 BAE Systems: Segment Market Shares, 2021
Figure 99 BAE Systems: Regional Market Shares, 2021
Figure 100 BAE Systems: Gross Profit, 2017-2021 (US$ million, AGR%)
Figure 101 BAE Systems: Operating Income, 2017-2021 (US$ million, AGR%)
Figure 102 General Dynamics Corporation: Net Revenue, 2017-2021 (US$ million, AGR%)
Figure 103 General Dynamics Corporation: Segment Market Shares, 2021
Figure 104 General Dynamics Corporation: Regional Market Shares, 2021
Figure 105 General Dynamics Corporation: Gross Profit, 2017-2021 (US$ million, AGR%)
Figure 106 General Dynamics Corporation: Operating Income, 2017-2021 (US$ million, AGR%)
Figure 107 Lockheed Martin: Net Revenue, 2017-2021 (US$ million, AGR%)
Figure 108 Lockheed Martin: Segment Market Shares, 2021
Figure 109 Lockheed Martin: Regional Market Shares, 2021
Figure 110 Lockheed Martin: Gross Profit, 2017-2021 (US$ million, AGR%)
Figure 111 Lockheed Martin: Operating Income, 2017-2021 (US$ million, AGR%)
Figure 112 Meggitt PLC: Net Revenue, 2017-2021 (US$ million, AGR%)
Figure 113 Meggitt PLC: Segment Market Shares, 2021
Figure 114 Meggitt PLC: Regional Market Shares, 2021
Figure 115 Meggitt PLC: Gross Profit, 2017-2021 (US$ million, AGR%)
Figure 116 Meggitt PLC: Operating Income, 2017-2021 (US$ million, AGR%)
Figure 117 Northrop Grumman Corp.: Net Revenue, 2017-2021 (US$ million, AGR%)
Figure 118 Northrop Grumman Corp.: Segment Market Shares, 2021
Figure 119 Northrop Grumman Corp.: Contract Type Market Shares, 2021
Figure 120 Northrop Grumman Corp.: Regional Market Shares, 2021
Figure 121 Northrop Grumman Corp.: Gross Profit, 2017-2021 (US$ million, AGR%)
Figure 122 Northrop Grumman Corp.: Operating Income, 2017-2021 (US$ million, AGR%)
Figure 123 Astronics Corporation: Net Revenue, 2017-2021 (US$ million, AGR%)
Figure 124 Astronics Corporation: Segment Market Shares, 2021
Figure 125 Astronics Corporation: Product Market Shares, 2021
Figure 126 Astronics Corporation: Regional Market Shares, 2021
Figure 127 Astronics Corporation: Gross Profit, 2017-2021 (US$ million, AGR%)
Figure 128 Astronics Corporation: Operating Income, 2017-2021 (US$ million, AGR%)
Figure 129 Comtech Telecommunications: Net Revenue, 2017-2021 (US$ million, AGR%)
Figure 130 Comtech Telecommunications: Regional Market Shares, 2021
Figure 131 Comtech Telecommunications: Gross Profit, 2017-2021 (US$ million, AGR%)
Figure 132 Comtech Telecommunications: Operating Income, 2017-2021 (US$ million, AGR%)
Figure 133 Lufthansa Technik: Net Revenue, 2017-2021 (US$ million, AGR%)
Figure 134 Lufthansa Technik: EBIT, 2017-2021 (US$ million, AGR%)
Figure 135 Boeing: Net Revenue, 2017-2021 (US$ million, AGR%)
Figure 136 Boeing: Segment Market Shares, 2021
Figure 137 Boeing: Gross Profit, 2016-2020 (US$ million, AGR%)
ページTOPに戻る
Visiongain社の航空宇宙・防衛分野での最新刊レポート
本レポートと同じKEY WORD()の最新刊レポート
- 本レポートと同じKEY WORDの最新刊レポートはありません。
よくあるご質問
Visiongain社はどのような調査会社ですか?
英国の調査会社ヴィジョンゲイン社(Visiongain)は、通信とエネルギーのほか、自動車や化学・医薬品、金属など、広範な市場を対象に調査を行っています。自動車市場については、市場全般に関する調査のほ... もっと見る
調査レポートの納品までの日数はどの程度ですか?
在庫のあるものは速納となりますが、平均的には 3-4日と見て下さい。
但し、一部の調査レポートでは、発注を受けた段階で内容更新をして納品をする場合もあります。
発注をする前のお問合せをお願いします。
注文の手続きはどのようになっていますか?
1)お客様からの御問い合わせをいただきます。
2)見積書やサンプルの提示をいたします。
3)お客様指定、もしくは弊社の発注書をメール添付にて発送してください。
4)データリソース社からレポート発行元の調査会社へ納品手配します。
5) 調査会社からお客様へ納品されます。最近は、pdfにてのメール納品が大半です。
お支払方法の方法はどのようになっていますか?
納品と同時にデータリソース社よりお客様へ請求書(必要に応じて納品書も)を発送いたします。
お客様よりデータリソース社へ(通常は円払い)の御振り込みをお願いします。
請求書は、納品日の日付で発行しますので、翌月最終営業日までの当社指定口座への振込みをお願いします。振込み手数料は御社負担にてお願いします。
お客様の御支払い条件が60日以上の場合は御相談ください。
尚、初めてのお取引先や個人の場合、前払いをお願いすることもあります。ご了承のほど、お願いします。
データリソース社はどのような会社ですか?
当社は、世界各国の主要調査会社・レポート出版社と提携し、世界各国の市場調査レポートや技術動向レポートなどを日本国内の企業・公官庁及び教育研究機関に提供しております。
世界各国の「市場・技術・法規制などの」実情を調査・収集される時には、データリソース社にご相談ください。
お客様の御要望にあったデータや情報を抽出する為のレポート紹介や調査のアドバイスも致します。
|
|

