POS端末ハードウェアベンダーの市場シェアPOS Terminal Hardware Vendor Market Share 製品概要 発行日 2021年9月1日 地理 ワールドワイドまたは地域別 ライセンス エンタープライズ - 広範な内部 - フェアユースの対象 フォーマット マイクロソフトエクセル ... もっと見る
※その他の価格の詳細は、データリソースまでお問合せください。
サマリー製品概要
発行日 2021年9月1日 今回の研究 は、東芝グローバルコマース(IBM)、NCR、HP、Diebold-Nixdorf、富士通、Dell、MICROS、Radiant、Digiposなどのベンダーの出荷台数とインストールベースを四半期および年間ベースで提供しています。また、プロセッサやOSに関する過去のデータも含まれており、今後の予測も行っています。本レポートは、PCOCD(PC on Cash Drawer)市場を含むPOS市場の唯一のレビューです。 以下の「製品ハイライト」では、利用可能なデータの詳細について説明しています。プレビュー」タブでは、利用可能なデータの種類を図解しています。 これは非常にデータの多い研究です。 また、セグメント別、地域別、OS別、プロセッサタイプ別の出荷台数など、より詳細な情報を得ることができます。また、全世界のベンダーごとに集計したデータや、地域ごとに集計したデータを購入することもできます。また、ベンダー別に2年前までの過去のデータと今後6四半期までの予測も含まれています。 これらのデータは、地域別の「POS Terminal Study」と合わせてご利用いただくことを想定しています。この調査では、トレンド、参入障壁、成長の仮定などを検討しています。ここに掲載されているデータは、純粋に定量的なものです。本データの正確性を高めるために、データポイントの共有にご協力いただいたベンダーの皆様に感謝いたします。 ハイライト 4つの地域のデータがあります。
北米(アメリカ、カナダ 以下の小売セグメントごとに、上位5~7社のベンダーのデータを提供しています。
食品/スーパーマーケット 北米ではさらに、「専門店」を「専門カテゴリーキラー」と「専門その他」に、「ホスピタリティ」を「ファストフード」、「バー・レストラン」、「宿泊施設」、「カジノ・クルーズ」、「エンタテインメント」に分けています。テーマパーク、スタジアム、美術館、その他) 各地域ごとに、以下のシートをご用意しております。 総出荷台数とインストールベース - 総出荷台数とインストールベースのロールアップと総台数の予測です。これには、直近の4四半期と1年間の全体像、および次の4四半期と3年間の合計の予測が含まれます。これは、四半期ごとに更新されるローリング機能です。 地域別ベンダーシート - これはセグメント別、ベンダー別のロールアップで、直近の4四半期分、次の4四半期分、3年分の予測を含みます。出荷台数とインストールベースを含む。 地域別プロセッサー出荷数/設置ベース(ベンダー別、四半期別) - 地域のベンダー別、セグメント別、プロセッサー別に、直近の4四半期、次の4四半期、3年分をまとめています。このシートは非常に詳細なもので、まず当社のPOS調査と一致する以下のプロセッサーカテゴリーが含まれています。
286/386/486 ベンダー別地域別OS出荷数/インストールベース(四半期別) - これはプロセッサと同じフォーマットですが、プロセッサの代わりにベンダー別のOSをセグメント別に見ていきます。POSレポートと一致する)以下のOSを取り上げます。
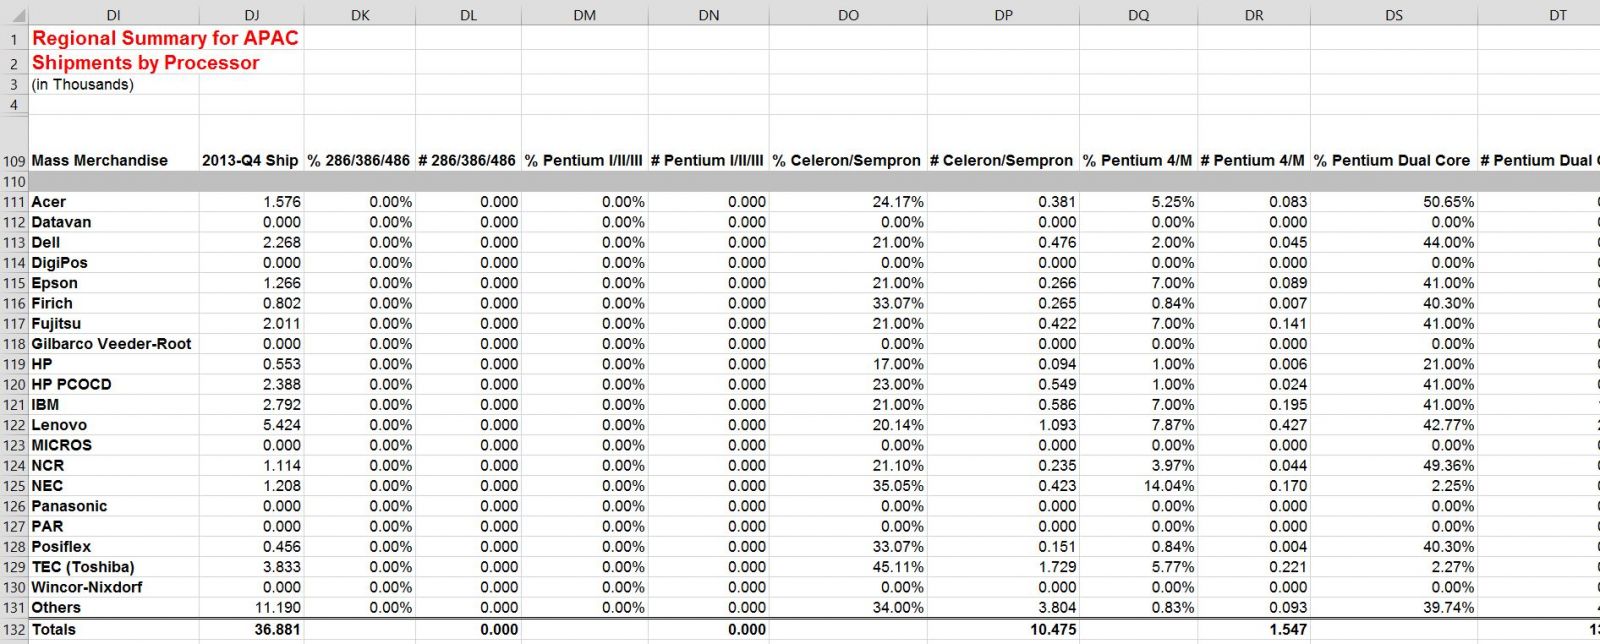
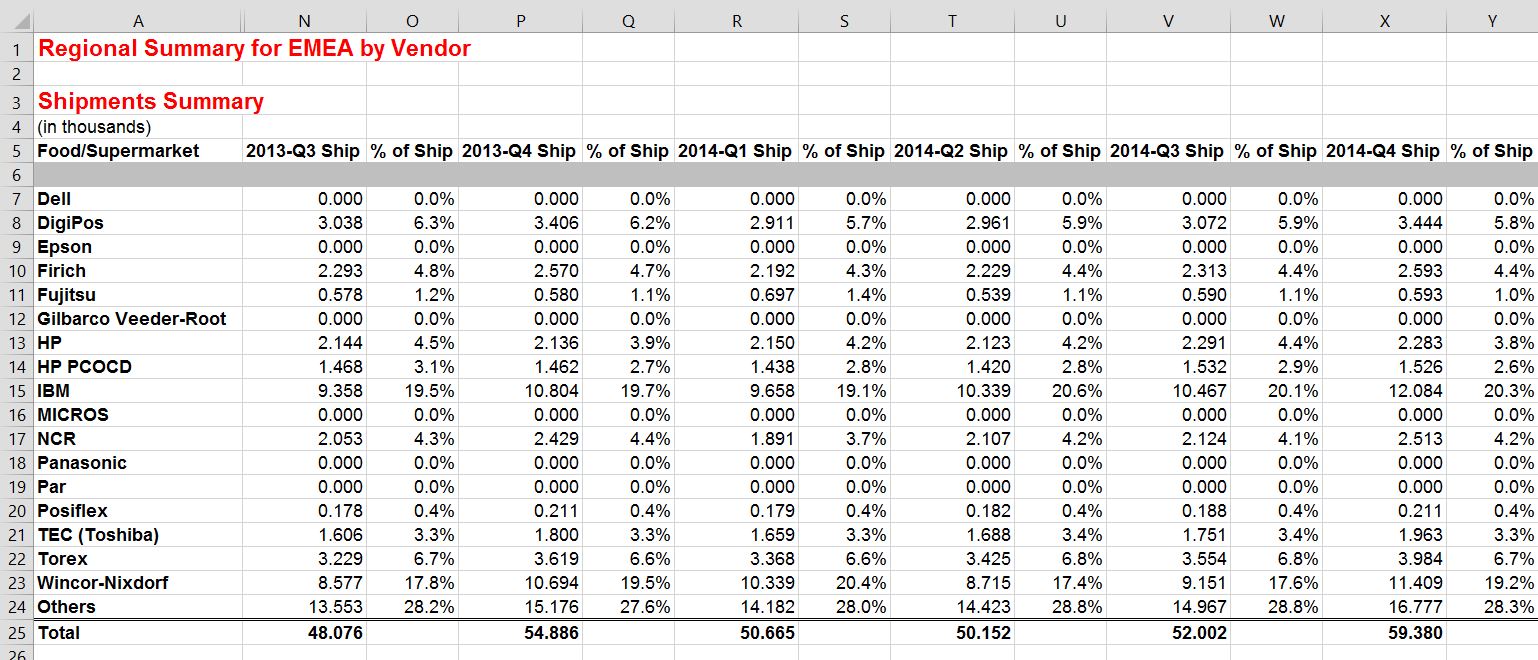
DOSとレガシーWindows プレビュー 以下、いくつかのスクリーンショットの例をご紹介します。 しかし、それらは製品を正当化するものではありません。 現在のデータは、2017年までの実際の出荷数と、ベンダーごとの予測です。 製品のデモをご希望の方は、お気軽にお問い合わせください。
よくあるご質問 POSの定義は何ですか? IHLでは、POSデバイスとして分類する定義を明確に示すことが重要だと考えています。本分析の目的のために、我々はPOSをPCベースのワークステーション、すなわちPCクラスのプロセッサベースでLANが利用可能な端末と定義している。他の人はElectronic Funds TerminalsをPOSに含めるかもしれませんが、ここでは含めません。POSの定義としては、我々が対象としているトップベンダーの現在のモデル名を使用するのが最も適切であろう。
東芝GC:SurePOS 300、500、700ファミリー 今回の調査では、PC on Cash Drawer Devices(PCOCD)も含め、可能な限りベンダーを区別しています。また、セルフチェックアウト端末もカウントに含めていますが、個別には分けていません。この詳細については、セルフチェックアウトに関する調査をお勧めします。 本調査では、Electronic Cash Registers(ECR)は対象外としています。プロセッサや接続性の点でPOSとECRの境界は曖昧になってきていますが、機能性、拡張性、サービス性の点ではデバイス間に明確な違いがあると考えています。したがって、本調査では、Wincor BEETLE /Express、HP rp5000、NCR RealPOS 20タイプのローエンド機器を対象としています。 どのような小売市場セグメント(バーティカル)に対応していますか? 当社の調査フォーマットは、以下の8つの小売市場セグメントの詳細な分析に基づいています。
食品/スーパーマーケット 北米ではさらに、専門店を「専門カテゴリーキラー」と「専門その他」に、ホスピタリティを「ファストフード」、「バー・レストラン」、「宿泊施設」、「カジノ・クルーズ」、「エンタテインメント」に分けています。娯楽:テーマパーク、スタジアム、博物館、その他。 収録されているプロセッサーはどのように定義されていますか? 本レポートでは、すべてのプロセッサーを名前ではなく、あえて速度で分類しています。インテルは市場のリーダーであり、また最も識別しやすい企業であるため、プロセッサーの定義には以下のような親しみやすい呼称を使用しています。
286/386/486 ここ数年は、VIA/CyrixやAMDなど、他のプロセッサーも登場していますが、ここでは、インテル、MediaGX、AMD K5、K6-2、Duron、Athlon、Atomなど、すべて「インテルクラス」のプロセッサーと呼んでいます。 OSをどのように分類していますか? OSに関しては、以下のような点に注目しています。
DOS&レガシーWindows(Windows 3.1、95、98、ME、NT、2000&XPを含む 本報告書では、ラボにあるユニットはカウントせず、パイロットまたはロールアウト中のユニットのみをカウントしています。 価格 POS ベンダー別出荷数」は、お客様が必要とする詳細レベルに応じて価格が決まります。すべての地域のすべてのセグメントを四半期ごとに更新することを希望する場合、価格は年間 $29,000 となります。 しかし、個々のリージョンは4,000ドルからとなっています。 年に一度しかデータを必要としない場合や、特定のセグメントや特定の地域のみを必要とする場合は、お客様に合わせてカスタマイズし、特定の価格でご提供することができます。詳細についてはお問い合わせください。 使用可能なライセンス エンタープライズライセンス - 組織内および完全子会社内の誰もが研究にアクセスし、内部で共有することを可能にするライセンス。 IHLグループライセンスおよびフェアユース契約 IHLグループの一般に公開されている研究は、すべて電子ライセンスであり、購買組織および完全子会社内で自由に共有することができます。ただし、IHLグループの許可なく、パートナーや購買企業以外の人と共有しないようお願いします。このライセンスは、ジョイントベンチャーなどの提携関係には適用されません。完全子会社以外の関係であれば、双方にライセンスが必要となります。 現実的には、次のようなことが考えられます。 1.購買会社は、国際機関が購買会社の完全子会社である限り、世界中のデータや研究を社内で使用することができます。 2.このデータや研究内容の全部または一部を、IHLグループの書面による明確な承認なしに、パートナーや顧客に配布することはできません。 3.購買会社は、顧客へのプレゼンテーションにおいて、特定のチャートなど、データの構成要素を引用することができます(限定使用)。ただし、これは構成要素のパーセンテージに限られ、個々のユニット情報は含まれません。ユニットデータは、IHLグループの書面による明示的な承認なしに、外部で共有することはできません。プレゼンテーションの中で本データを使用する場合には、本データに関するIHLグループのクレジットを明記してください。 4.購買企業は、IHLグループの書面による承認を得た上で、定性引用符を印刷物に記載することができます。 5.書面による承認を必要とするすべてのリクエストは、ihl(at)ihlservices.comに提出され、1営業日以内に審査されます。
Summary米国調査会社IHLグループ (IHL Group) の調査レポート「POS端末ハードウェアベンダーの市場シェア」は、世界のPOS端末ハードウェアベンダーの市場を調査し、プロセッサやOSに関するデータ、市場規模、トレンド、市場成長要因などについて記載しています。 Product Overview
Date of publication September 1, 2021 This research provides shipments and installed base on a quarterly and annual basis for vendors such as Toshiba Global Commerce (IBM), NCR, HP, Diebold-Nixdorf, Fujitsu, Dell, MICROS, Radiant, Digipos, and many others. It includes data on processors and operating systems historically and provides a forecast going forward. It is the only review of the POS market that includes the PC on Cash Drawer (PCOCD) market. Below in the Product Highlights section we get into the details of the data available. The Preview tab gives you some pictorial examples of the types of data available. This is very data intensive research and can go as deep as shipments by segment by region by operating system or processor-type. The data can also be purchased simply in aggregate by vendor worldwide or by individual region. Included are historical data back 2 years and projections forward for the next 6 quarters by vendor. These data are meant to be used in conjunction with the POS Terminal Studies by region. It is in these studies where we discuss trends, barriers to entry, and growth assumptions. The data here are purely quantitative in nature. We are thankful to the vendors who participate in sharing data points to make this as accurate as possible. Highlights Data is available for 4 regions:
North America (US and Canada) For each segment we provide data for the top 5-7 vendors per the following retail segments:
Food/Supermarkets For North America we further segment Specialty Stores into Specialty Category Killers and Specialty Other, and Hospitality into Fast Food, Bar/Restaurant, Lodging, Casinos/Cruises, and Entertainment: Theme Parks, Stadiums, Museums, others) For each region, we will provide the following sheets: Total Shipments and Installed Base – A rollup of total shipments and installed base with forecast for total units. This will include trailing 4 quarters and 1 year overall, and a forecast for the next 4 quarters and total of 3 years. This is a rolling function that will be updated each quarter. Regional Vendor Sheet – This is a rollup by segment and by vendor and will include the 4 trailing quarters, then forecast for next 4 quarters and total of 3 years. Includes shipments and installed base. Regional Processor Shipments/Installed Base by Vendor by Quarter – This will look at the 4 trailing quarters and the next 4 quarters and 3 years by vendor, by segment, and by processors for the region. This will be a very detailed sheet and will include the following processor categories to begin with that match our POS studies:
286/386/486 Regional OS Shipments/Installed Base by Vendor by quarter – This is the same format as processors, but instead of the processors we will look at the operating systems by vendor by segment. The following operating systems (that match our POS report) are addressed.
DOS and Legacy Windows Preview Below are some examples of some screen shots. But they do not do the product justice. Current data actual shipments through 2017 and forecasts by vendor. We welcome you to contact us for a demo of the product so you can see the level of data and detail you would be provided.
FAQS What do you define as POS? At IHL we believe it is important that we state clearly the definitions of what we are classifying as a POS device. For the purposes of our analysis, we are defining POS as PC-based workstations, namely PC-class Processor-based and LAN-available terminals. Although others might include Electronic Funds Terminals as POS, we do not include them here. Perhaps the best definitions come from the use of the current model names of the top vendors that we are including:
Toshiba GC: SurePOS 300, 500 and 700 families In this research, we also include PC on Cash Drawer Devices (PCOCD), and to the degree we are able we distinguish between vendors. We also include Self-Checkout terminals in the count, but do not break them out separately. For this detail we suggest our Self-Checkout Study. We do not include Electronic Cash Registers (ECR) in this study. Although the lines have blurred as to POS and ECR in terms of processors and connectivity, we believe there is a clear distinction in functionality, expandability, and serviceability between the devices. Thus, we are considering the low end devices in the study as those of the Wincor BEETLE /Express, HP rp5000, and NCR RealPOS 20 types. What retail market segments (verticals) do you address? Our format for the study is based on detailed analysis of the following 8 retail market segments:
Food/Supermarkets For North America we further segment Specialty Stores into Specialty Category Killers and Specialty Other, and Hospitality into Fast Food, Bar/Restaurant, Lodging, Casinos/Cruises, and Entertainment: Theme Parks, Stadiums, Museums, others. How do you define the processors included? Throughout this report, we deliberately categorize all processors by speed rather than by name. Since Intel is the market leader and the most identifiable, we use the following familiar designations for our processor definitions.
286/386/486 While in the last several years there have been other processor entries (notably VIA/Cyrix and AMD), all herein are referred to as “Intel-class” processors, whether Intel, MediaGX, AMD K5, K6-2, Duron, Athlon or Atom. How do you categorize operating systems? With regard to operating systems, our focus is on the following.
DOS & Legacy Windows (includes Windows 3.1, 95, 98, ME, NT, 2000 & XP) For the purposes of this report we do not count units that are in labs; we only count those in pilot or in rollout. Pricing The POS Shipments by Vendor product is priced based on the level of detail that you require. Should you wish to have all segments for all regions, updated quarterly, the price is $29,000 Annually. But individual regions start at $4,000. If you only need data annually or only certain segments or certain regions, we can customize the offering for you and a specific price. Please contact us for more details. Licenses Available Enterprise License – a license that allows for the research to be accessed and shared internally with anyone else within the organization and wholly owned subsidiaries. IHL Group License and Fair Use Agreement All of IHL Group’s generally available research are electronic licenses and can be shared freely within the purchasing organization and wholly owned subsidiaries. We only ask that this information not be shared with partners or others outside the purchasing company without authorization from IHL Group. The license does not extend to joint ventures or other partnerships. If the relationship is not a wholly-owned subsidiary, then both parties would need a license. Practically, this implies the following: 1. The purchasing company can use the data and research worldwide internally as long as the international organizations are wholly owned subsidiaries of the purchasing company. 2. The data or any research cannot be distributed in whole or in part to partners or customers without express written approval from IHL Group. 3. The purchasing company may quote components of the data (limited use) in presentations to customers such as specific charts. This is limited to percentage components, not individual unit information. Unit data cannot be shared externally without express written approval from IHL Group. All references to the data in presentations should include credit to IHL Group for the data. 4. The purchasing company can reference qualitative quotes in printed material with written approval from IHL Group. 5. All requests requiring written approval should be submitted to ihl(at)ihlservices.com and will be reviewed within one business day.
ご注文は、お電話またはWEBから承ります。お見積もりの作成もお気軽にご相談ください。本レポートと同分野の最新刊レポート
よくあるご質問IHL Group社はどのような調査会社ですか?IHLグループ (IHL Group) は、米国テネシー州に本社をおき、世界の小売業とサービス業向けのIT技術を専門に調査しています。 もっと見る 調査レポートの納品までの日数はどの程度ですか?在庫のあるものは速納となりますが、平均的には 3-4日と見て下さい。
注文の手続きはどのようになっていますか?1)お客様からの御問い合わせをいただきます。
お支払方法の方法はどのようになっていますか?納品と同時にデータリソース社よりお客様へ請求書(必要に応じて納品書も)を発送いたします。
データリソース社はどのような会社ですか?当社は、世界各国の主要調査会社・レポート出版社と提携し、世界各国の市場調査レポートや技術動向レポートなどを日本国内の企業・公官庁及び教育研究機関に提供しております。
|
|


.jpg)


